. 2024 Sep;4(9):1290-1307.
doi: 10.1038/s43587-024-00662-8. Epub 2024 Jun 28.

The genetic architecture of biological age in nine human organ systems

Affiliations

The genetic architecture of biological age in nine human organ systems

Junhao Wen et al. Nat Aging. 2024 Sep.

Abstract

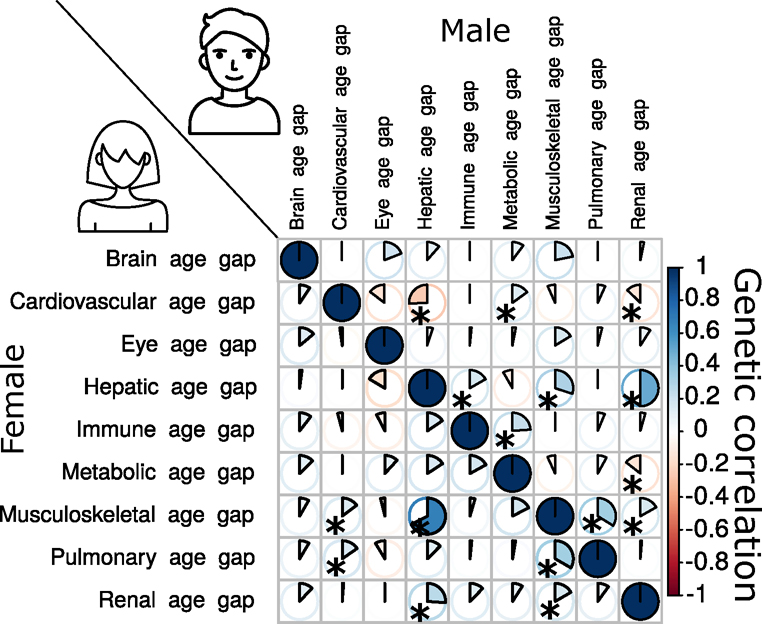
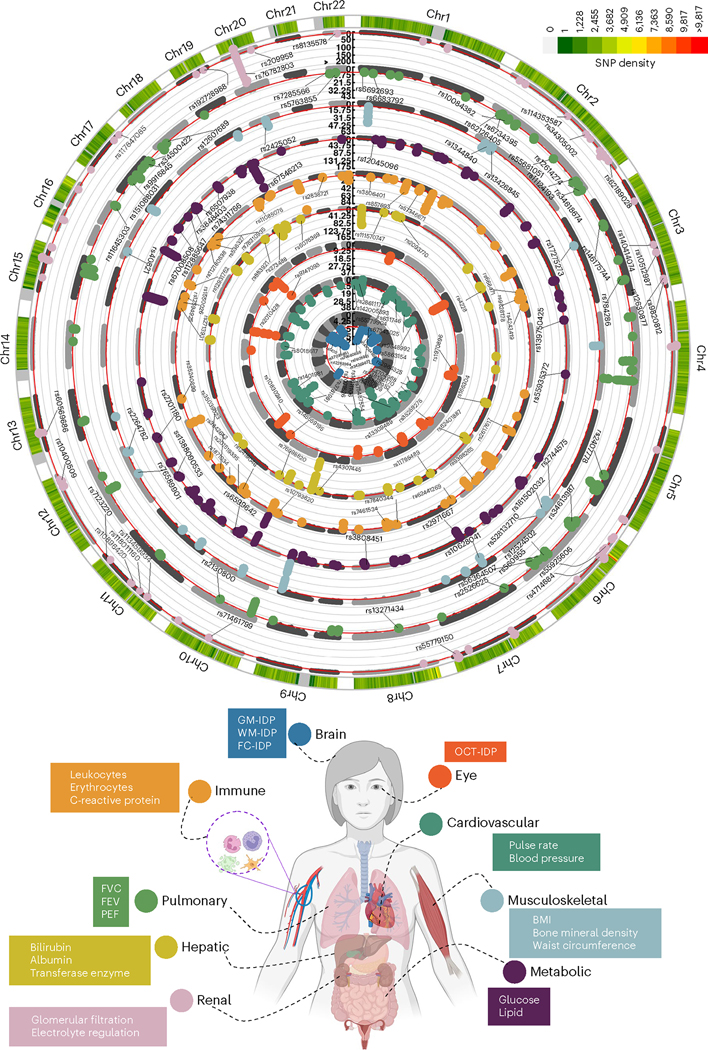
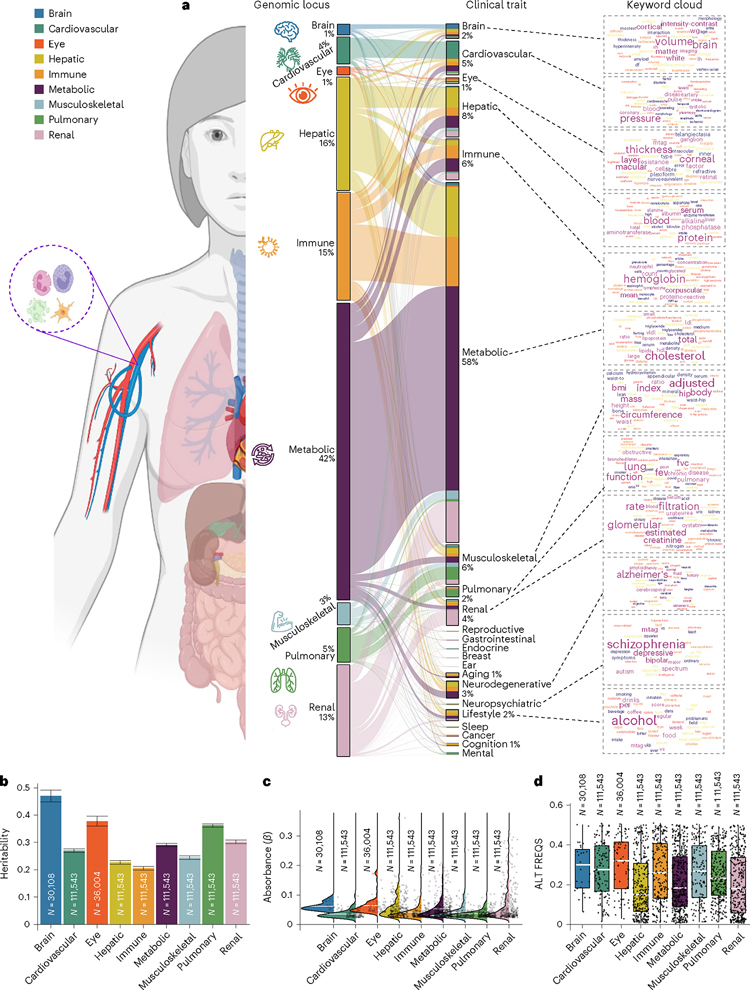
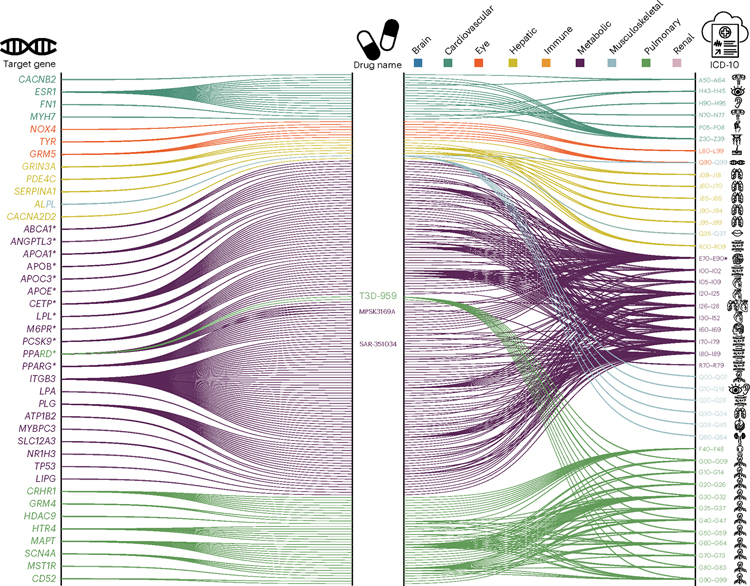
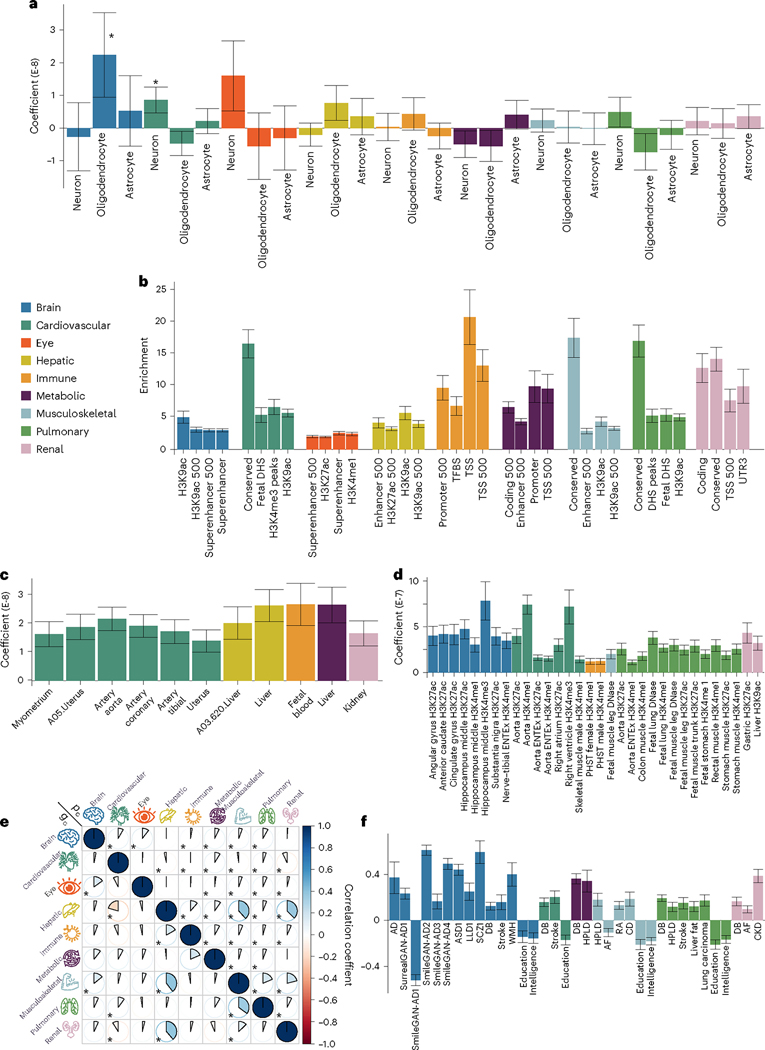
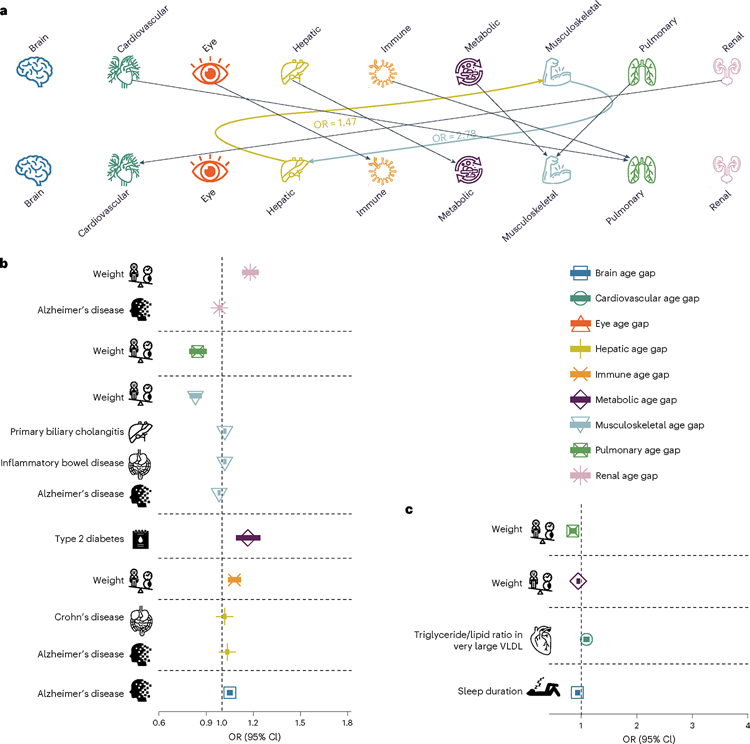
Investigating the genetic underpinnings of human aging is essential for unraveling the etiology of and developing actionable therapies for chronic diseases. Here, we characterize the genetic architecture of the biological age gap (BAG; the difference between machine learning-predicted age and chronological age) across nine human organ systems in 377,028 participants of European ancestry from the UK Biobank. The BAGs were computed using cross-validated support vector machines, incorporating imaging, physical traits and physiological measures. We identify 393 genomic loci-BAG pairs (P < 5 × 10⁻⁸) linked to the brain, eye, cardiovascular, hepatic, immune, metabolic, musculoskeletal, pulmonary and renal systems. Genetic variants associated with the nine BAGs are predominantly specific to the respective organ system (organ specificity) while exerting pleiotropic links with other organ systems (interorgan cross-talk). We find that genetic correlation between the nine BAGs mirrors their phenotypic correlation. Further, a multiorgan causal network established from two-sample Mendelian randomization and latent causal variance models revealed potential causality between chronic diseases (for example, Alzheimer's disease and diabetes), modifiable lifestyle factors (for example, sleep duration and body weight) and multiple BAGs. Our results illustrate the potential for improving human organ health via a multiorgan network, including lifestyle interventions and drug repurposing strategies.


Conflict of interest statement

Competing interests

The authors declare no competing interests.

Figures

Extended Data Fig. 1 |
Extended Data Fig. 1 |. Scatterplots of the main GWAS sensitivity analysis for nine BAGs.
We scrutinized the robustness of the nine primary GWAS using the European ancestry populations by fully considering linkage disequilibrium. We only included the independent significant SNPs in four different sensitivity check analyses. We reported three statistics i) r-β: Pearson’s r between the two sets of β coefficients from the two splits; ii) C-β: concordance rate of the sign of the β coefficients from the two splits – if the same SNP exerts the same protective/risk effect between the two splits; iii) P-β: the difference between the two sets of β coefficients from the two splits – if the two sets of β coefficients (mean) statistically differ (two-sample t-test). Detailed statistics are presented in Supplementary Note 1 for a) split-sample, b) sex-stratified, c) fastGWA vs. PLINK, and d) European vs. Non-European GWAS analyses.
Extended Data Fig. 2 |
Extended Data Fig. 2 |. SNP-based heritability, beta coefficients, and alternative allele frequency using the brain-BAG comparable populations and different inclusion criteria for the SNPs.
a) The SNP-based heritability of the nine BAGs using populations from downsampling to the brain BAG population. Error bars represent the standard error of the estimated parameters, and the measure of the center for the error bars represents the inferred statistics (that is, SNP-based heritability). b) The absolute value of the beta coefficients of the independent significant SNPs of the nine BAG GWASs using populations from downsampling to the brain BAG population (N = 30,108); the independent significant SNPs are shown separately for each BAG. c) The alternative (effective) allele frequency of the independent significant SNPs from the nine BAG GWASs using populations from downsampling to the brain BAG population (N = 30,108). d) The beta coefficients of the independent significant SNPs using the original full samples but with all identified independent significant SNPs across the nine BAG GWASs (with the same number of SNPs tested), where we see no difference regarding allele frequency in Figure e). f) The absolute value of the beta coefficients of the independent significant SNPs plus the candidate SNPs in LD of the nine BAG GWASs using the original full samples; the SNPs are shown separately for each BAG. g) The alternative allele frequency for the setting in Figure f). h) The absolute beta coefficients of the nine BAGs using all genome-wide SNPs (the y-axis was truncated to 0.1 for visualization purposes). i) the alternative allele frequency did not differ for Figure h) including all genome-wide SNPs. For Figure c, e, g, and i, the upper/lower whiskers show the upper/lower boundaries based on the 1.5xthe interquartile range (IQR). The upper/lower hinge displays the top/bottom end of the IQR. The central measures denote the median values.
Extended Data Fig. 3 |
Extended Data Fig. 3 |. Trumpet plots of the alternative allele frequency vs. the beta coefficient of the nine BAG GWASs.
The trumpet plots display the inverse relationship between the alternative (effect) allele frequency and the effect size (beta coefficient) for the brain, cardiovascular, eye, hepatic, immune, metabolic, musculoskeletal, pulmonary, and renal BAGs. Only the independent significant SNPs were considered. The dot size corresponds to the effect size, while the transparency of the dot is proportional to its statistical significance.
Extended Data Fig. 4 |
Extended Data Fig. 4 |. Bayesian colocalization signal between the pulmonary BAG and FEV/FVC.
Here, we illustrate the colocalization signal between the pulmonary BAG and the FEV/FCV feature at the genomic locus: 4q24, with the top lead SNP (causal SNP: rs7664805). Genetic colocalization was evidenced at one locus (4q24) between the pulmonary BAG and the FEV/FCV feature. The signed PP.H4.ABF (0.99) denotes the posterior probability (PP) of hypothesis H4, which suggests that both traits share the same causal SNP (rs7664805). All P-values were two-sided.
Extended Data Fig. 5 |
Extended Data Fig. 5 |. Gene-set enrichment analysis using sex-stratified GWAS results.
Gene-set enrichment analysis was performed using the GWAS summary statistics specific to females (a) and males (b). Gene set enrichment analyses were performed using curated gene sets and GO terms from the MsigDB database. Only significant gene sets are presented after adjusting for multiple comparisons using the Bonferroni correction. All P-values were two-sided.
Extended Data Fig. 6 |
Extended Data Fig. 6 |. Tissue-specific gene expression analysis using sex-stratified GWAS results.
Tissue-specific enrichment analysis was performed using the GWAS summary statistics specific to females (a) and males (b). Gene-property analyses evaluate tissue-specific gene expressions for the nine BAG-related genes using the full SNP P-values distribution. Only significant gene sets are presented after adjusting for multiple comparisons using the Bonferroni correction. All P-values were two-sided.
Extended Data Fig. 7 |
Extended Data Fig. 7 |. Genetic correlations using sex-stratified GWAS results.
The genetic correlation between each pair of BAGs was determined using sex-stratified GWAS summary statistics from our analyses. Most of the genetic correlations showed consistency between females and males, albeit sex differences are evident in certain BAGs, particularly in the cardiovascular BAG results. Specifically, males exhibit dominant correlations between cardiovascular BAGs and hepatic and renal BAGs, while females demonstrate specific correlations with musculoskeletal and pulmonary BAGs. All P-values were two-sided, and Bonferroni correction was employed to denote significant signals (* symbols).
Fig. 1 |
Fig. 1 |. Genomic loci associated with the nine BAGs.
Organ-specific BAG was derived from a large cohort of 30,108 to 111,543 participants of European ancestry from the UKBB cohort. The nine organ systems include the brain (N = 30,108), cardiovascular (N = 111,543), eye (N = 36,004), hepatic (N = 111,543), immune (N = 111,543), metabolic (N = 111,543), musculoskeletal (N = 111,543), pulmonary (N = 111,543) and renal (N = 111,543) BAGs. In total, 393 genomic loci–BAG pairs were identified using a genome-wide P value threshold (−log10 (P value) > 7.30; two sided). For visualization purposes, we denoted the genomic loci using their top lead SNPs that are not associated with any clinical traits in the EMBL-EBI GWAS Catalog. All analyses used GRCh37. We present representative features used in calculating each organ’s BAG; BMI, body mass index; Chr, chromosome; IDP, imaging-derived phenotype; GM, gray matter; WM, white matter; FC, functional connectivity; OCT, optical coherence tomography; FVC, forced vital capacity; FEV, forced expiratory volume; PEF, peak expiratory flow. The human anatomy was created with BioRender.com.
Fig. 2 |
Fig. 2 |. Phenome-wide associations of the identified genomic loci and SNP-wide heritability estimates of the nine BAGs.
a, Phenome-wide association query of the identified genomic loci in the EMBL-EBI GWAS Catalog (query date 24 April 2023 via FUMA version v1.5.4) showed an organ-specific and interorgan landscape. By examining the independent significant SNPs considering linkage disequilibrium (Methods) within each genomic locus, we linked them to various clinical traits. These traits were categorized into high-level groups encompassing different organ systems, neurodegenerative and neuropsychiatric disorders and lifestyle factors. To visually represent the findings, we generated keyword cloud plots based on the frequency of these clinical traits within each BAG. The length of each rectangle block indicates the number of associations concerning the genomic loci in our analysis and clinical traits in the literature. The individual disease traits were categorized within their respective organ systems. However, this categorization does not imply that the sum of these diseases exclusively represents the entirety of the organ system or that these diseases are solely associated with one specific organ system. Additional searches on alternative public GWAS platforms, such as the GWAS Atlas, are provided. b, The brain BAG is more heritable than other organ systems using GCTA. Error bars represent the standard error of the estimated parameters, and the measure of the center for the error bars represents the inferred statistics (that is, SNP-based heritability). c, The brain BAG showed larger effect sizes of the independent significant SNPs than other organ systems. The kernel density estimate plot shows the distribution of the effect sizes (that is, the magnitude of the linear regression β coefficients) in the nine GWASs. The white horizontal lines represent the mean effect sizes. d, Alternative allele frequency (effect allele) distribution for the nine BAGs. The upper/lower whiskers show the upper/lower boundaries based on 1.5× the interquartile range. The upper/lower hinge displays the top/bottom end of the interquartile range. The central measures denote the median values. Of note, only independent significant SNPs were shown for each BAG in c and d. All results in bd used the original full sample sizes of the nine BAGs; the brain, eye and other body organ BAGs have different sample sizes. Results for bd using the downsampled sample sizes (N = 30,108 of the brain BAG) are shown in Extended Data Fig. 2; ALT FREQS, allele frequency of the alternative (effective) allele. The human anatomy was created with BioRender.com.
Fig. 3 |
Fig. 3 |. Gene-level biological pathway annotation and tissue-specific gene expression.
a, Validation of the nine BAGs in GSEAs. GSEAs were performed using curated gene sets and Gene Ontology terms from the MSigDB database. b, Validation of the nine BAGs in gene property analyses. Gene property analyses evaluate tissue-specific gene expression for the nine BAG-related genes using the full SNP P value (two sided) distribution. Only significant gene sets are presented after adjusting for multiple comparisons using the Bonferroni correction; EGJ, esophagus gastroesophageal junction; FDVP, forebrain dorsal–ventral pattern; VLDL, very-low-density lipoprotein; CN, copy number; POR, Schmidt port targets in limb bud.
Fig. 4 |
Fig. 4 |. Gene–drug–disease network of the nine BAGs.
The gene–drug–disease network reveals a broad spectrum of gene, drug and disease interactions across the nine BAGs, highlighting the metabolic-related genes. The ICD-10 code icons symbolize disease categories linked to the primary organ systems (for example, G30 for Alzheimer’s disease in the CNS). All presented genes passed the nominal P value threshold (<0.05; two sided) and were pharmacogenetically associated with drug categories in the DrugBank database; an asterisk (*) indicates gene–drug–disease interactions that passed the Bonferroni correction.
Fig. 5 |
Fig. 5 |. Partitioned heritability enrichment and genetic correlation of the nine BAGs.
a, Cell-type-specific partitioned heritability estimates for neurons, oligodendrocytes and astrocytes. b, Partitioned heritability estimates for the general 53 functional categories. For visualization purposes, we only show the four categories with the highest significant estimates for each BAG. The label for 500 denotes a 500-base pair window around each of the 24 main annotations in the full baseline model, which prevents a biased estimate inflated by heritability in flanking regions; TSS, transcription start site; DHS, DNase I hypersensitivity site; TFBS, transcription factor binding site. c, Tissue-specific partitioned heritability estimates using gene sets from multitissue gene expression data. d, Tissue- and chromatin-specific partitioned heritability estimates using multitissue chromatin data. e, Cheverud’s conjecture: the genetic correlation between two BAGs (gc; bottom triangle) mirrors their phenotypic correlation (pc; top triangle). f, Genetic correlations between the nine BAGs and 41 clinical traits, including chronic diseases and their subtypes involving multiple human organ systems, education, intelligence and reaction time. An asterisk (*) denotes Bonferroni-corrected significance, and the absence of an asterisk indicates that all results remain significant after correction. For ad and f, the standard error of the estimated parameters is presented using error bars. The measure of the center for the error bars represents the inferred statistics. The sample sizes, P values and other detailed statistics are presented in Source Data Files 13–18 and Supplementary Table 5; all P values are two sided; AD, Alzheimer’s disease; ASD, autism spectrum disorder; LLD, late-life depression; SCZ, schizophrenia; DB, type 2 diabetes; WMH, white matter hyperintensity; HPLD, hyperlipidemia; AF, atrial fibrillation; RA, rheumatoid arthritis; CD, Crohn’s disease; CKD, chronic kidney disease; PHST, primary hematopoietic stem cell.
Fig. 6 |
Fig. 6 |. Causal multiorgan network between the nine BAGs and 17 clinical traits of chronic diseases, lifestyle factors and cognition.
a, Causal inference between each pair of BAGs using bidirectional two-sample Mendelian randomization by excluding overlapping populations. The colored lines represent causal effects that survived the correction for multiple comparisons using the Bonferroni method; the dotted lines denote the nominal significant causal effects (P < 0.05). b, Forward Mendelian randomization investigates the causal inference of 17 unbiasedly selected exposure variables on the 9 outcome variables (that is, the 9 BAGs). c, Inverse Mendelian randomization examines the causal inference of the nine BAGs on the 17 clinical traits. Significant tests were adjusted for multiple comparisons using the Bonferroni correction. The ORs and 95% CIs are presented. Detailed OR and 95% CI information can be found in Source Data Files 19 and 20. It is crucial to approach the interpretation of these potential causal relationships with caution despite our thorough efforts in conducting multiple sensitivity checks to assess any potential violations of underlying assumptions. All P values are two sided.

Update of

Similar articles

Cited by

References

    1. Melzer D, Pilling LC & Ferrucci L The genetics of human ageing. Nat. Rev. Genet. 21, 88–101 (2020). - PMC - PubMed
    1. Hodson R Precision medicine. Nature 537, S49 (2016). - PubMed
    1. Tian YE et al. Heterogeneous aging across multiple organ systems and prediction of chronic disease and mortality. Nat. Med. 29, 1221–1231 (2023).10.1038/s41591-023-02296-6 - DOI - PubMed
    1. Wen J et al. Genetic, clinical underpinnings of brain change along two neuroanatomical dimensions of clinically-defined Alzheimer’s disease. Preprint at bioRxiv https://www.biorxiv.org/content/10.1101/2022.09.16.508329v3 (2024). - DOI
    1. Liu Y et al. Genetic architecture of 11 organ traits derived from abdominal MRI using deep learning. eLife 10, e65554 (2021). - PMC - PubMed