. 2024 Aug;30(8):2170-2180.
doi: 10.1038/s41591-024-03075-7. Epub 2024 Jun 28.

Multi-parametric atlas of the pre-metastatic liver for prediction of metastatic outcome in early-stage pancreatic cancer

Linda Bojmar #  1   2 Constantinos P Zambirinis #  2   3   4 Jonathan M Hernandez #  3   5 Jayasree Chakraborty  3   6 Lee Shaashua  1 Junbum Kim  7 Kofi Ennu Johnson  1 Samer Hanna  1 Gokce Askan  6   8 Jonas Burman  1   2 Hiranmayi Ravichandran  7   9 Jian Zheng  3 Joshua S Jolissaint  1   3 Rami Srouji  1   3 Yi Song  3 Ankur Choubey  3 Han Sang Kim  1 Michele Cioffi  1 Elke van Beek  3 Carlie Sigel  6   8 Jose Jessurun  10 Paulina Velasco Riestra  2 Hakon Blomstrand  2   11 Carolin Jönsson  2 Anette Jönsson  2 Pernille Lauritzen  1 Weston Buehring  1 Yonathan Ararso  1 Dylanne Hernandez  1 Jessica P Vinagolu-Baur  1 Madison Friedman  1 Caroline Glidden  1 Laetitia Firmenich  1 Grace Lieberman  1 Dianna L Mejia  1 Naaz Nasar  3 Anders P Mutvei  12 Doru M Paul  13 Yaron Bram  14 Bruno Costa-Silva  1 Olca Basturk  6   8 Nancy Boudreau  1 Haiying Zhang  1 Irina R Matei  1 Ayuko Hoshino  1 David Kelsen  6   15 Irit Sagi  16 Avigdor Scherz  17 Ruth Scherz-Shouval  18 Yosef Yarden  16 Moshe Oren  19 Mikala Egeblad  20 Jason S Lewis  21   22 Kayvan Keshari  6   21 Paul M Grandgenett  23 Michael A Hollingsworth  23 Vinagolu K Rajasekhar  24 John H Healey  24 Bergthor Björnsson  2 Diane M Simeone  25 David A Tuveson  20 Christine A Iacobuzio-Donahue  6   8   26 Jaqueline Bromberg  15   27 C Theresa Vincent  12   28 Eileen M O'Reilly  6   13   22 Ronald P DeMatteo  3 Vinod P Balachandran  3   6   29 Michael I D'Angelica  3   6 T Peter Kingham  3   6 Peter J Allen  3 Amber L Simpson  3 Olivier Elemento  7   9 Per Sandström  2 Robert E Schwartz  14   30 William R Jarnagin  3   6 David Lyden  31   32
Affiliations

Multi-parametric atlas of the pre-metastatic liver for prediction of metastatic outcome in early-stage pancreatic cancer

Linda Bojmar et al. Nat Med. 2024 Aug.

Abstract

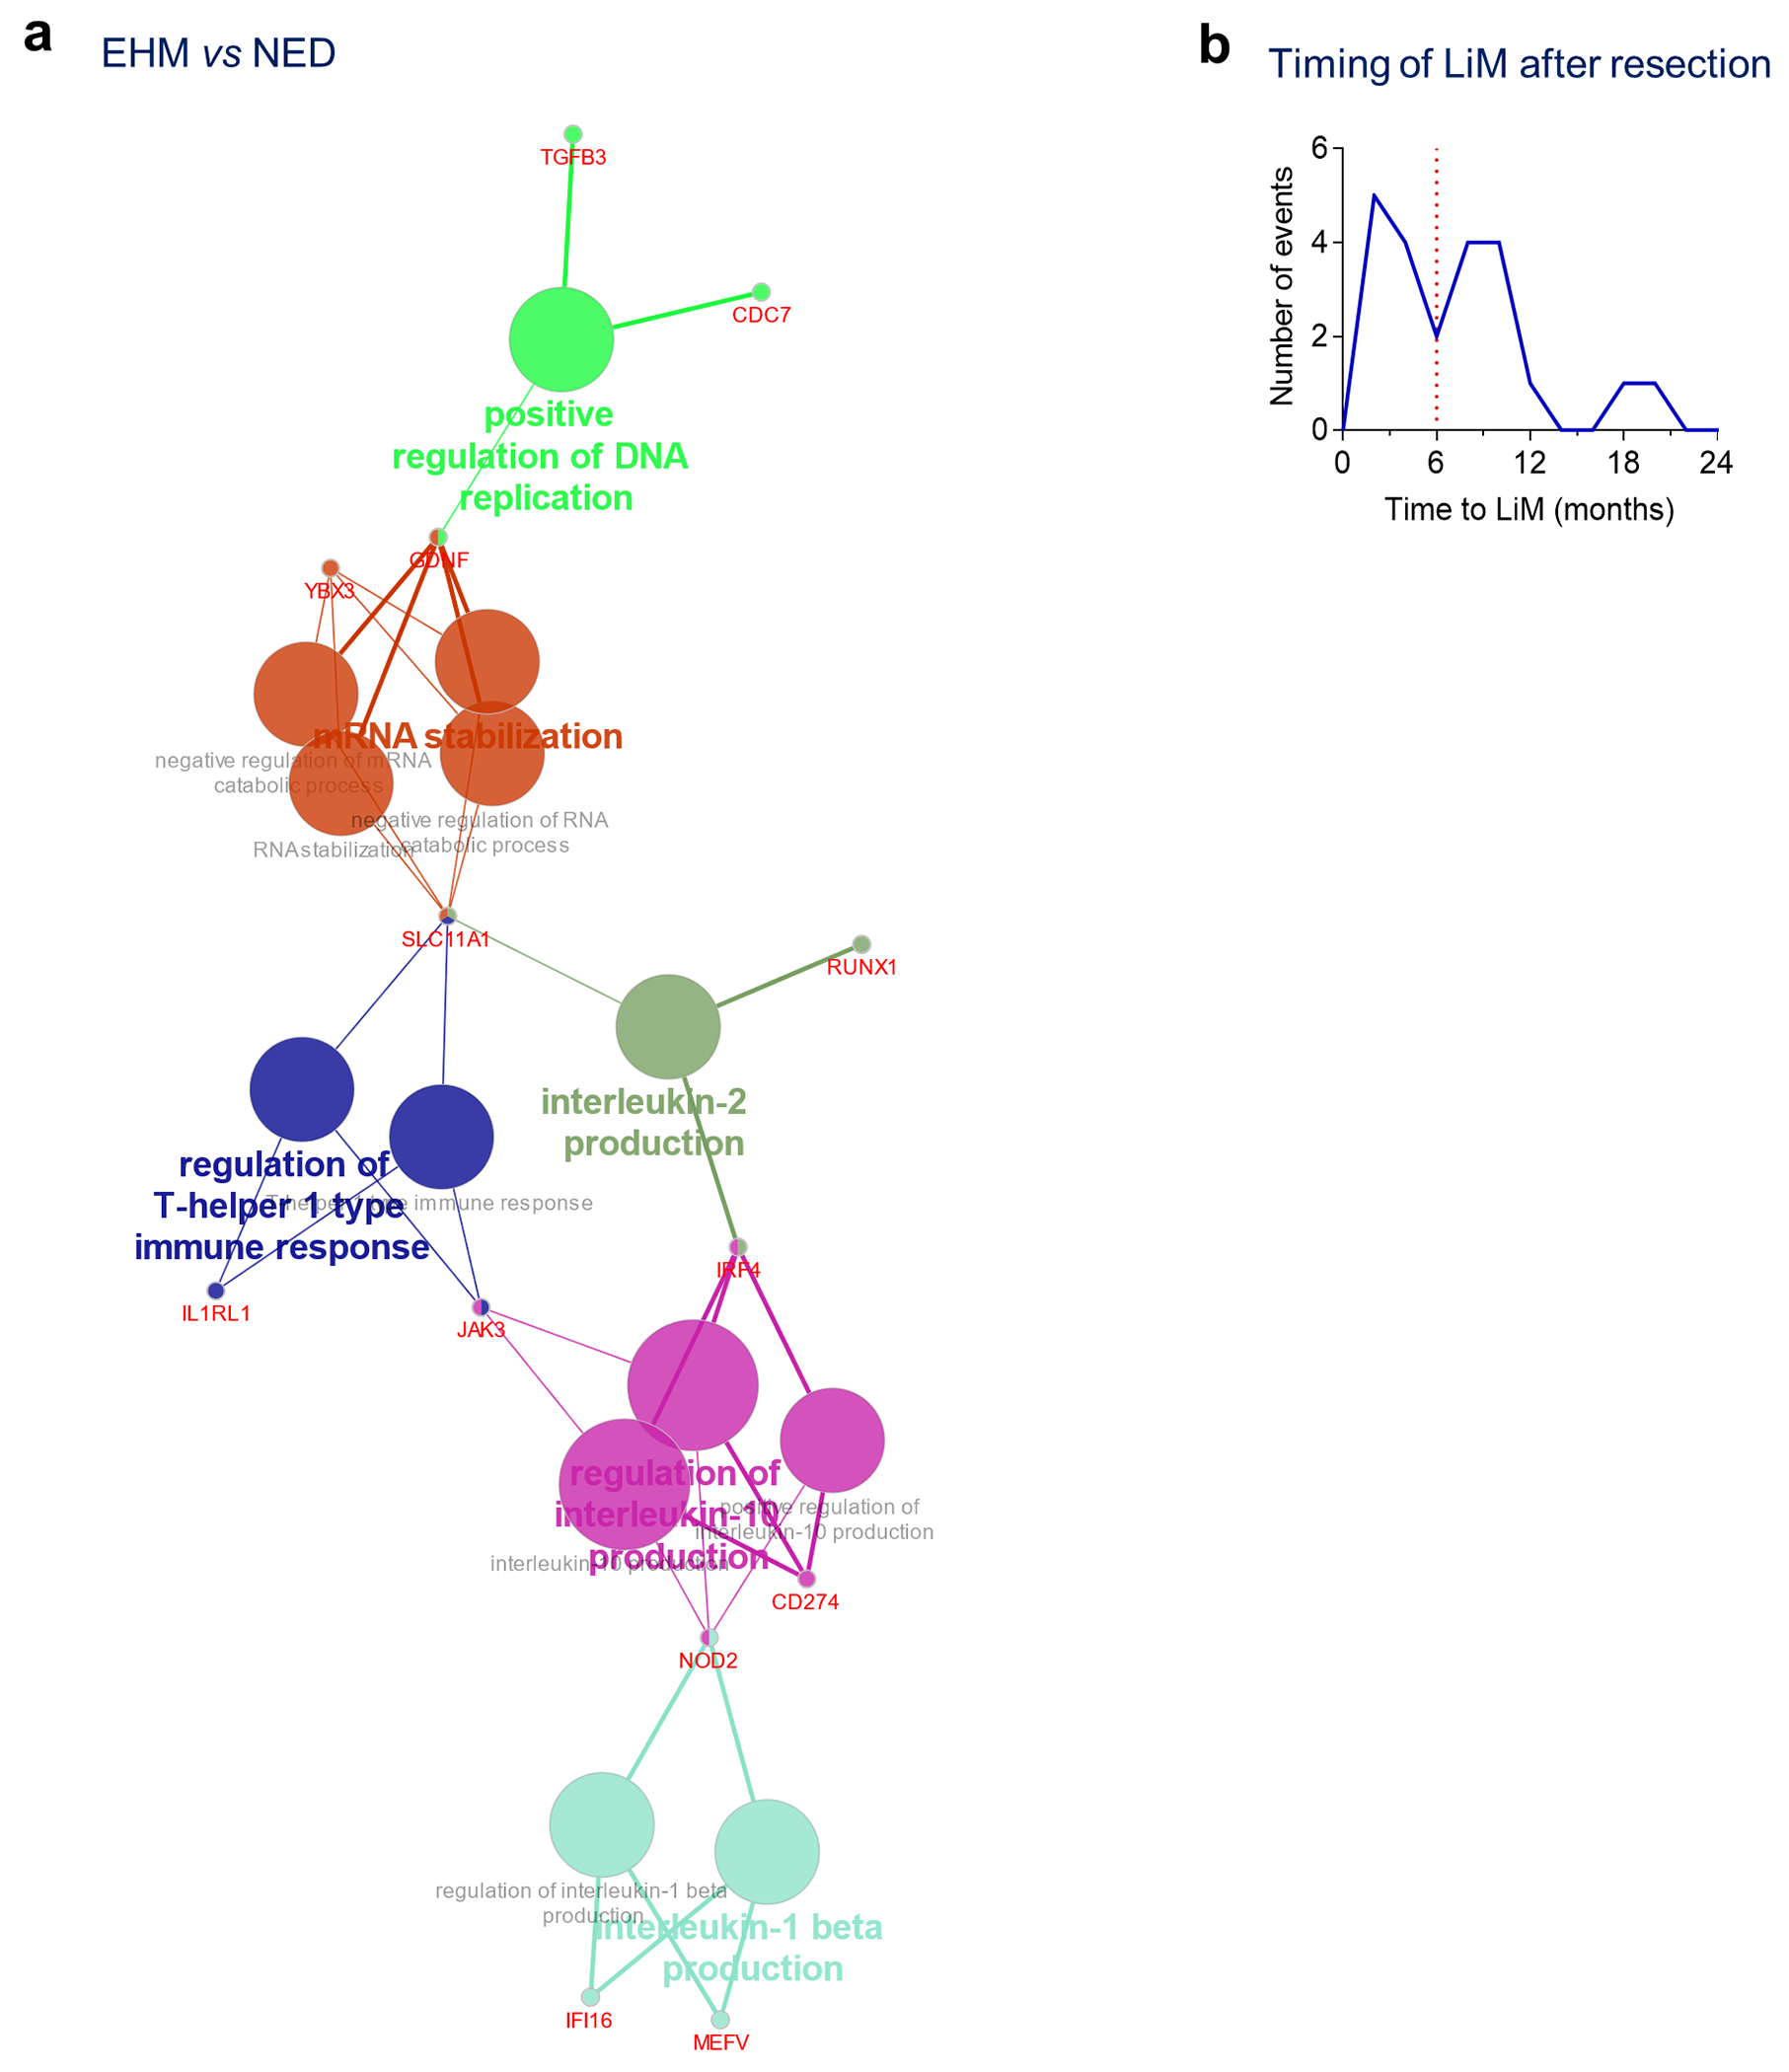
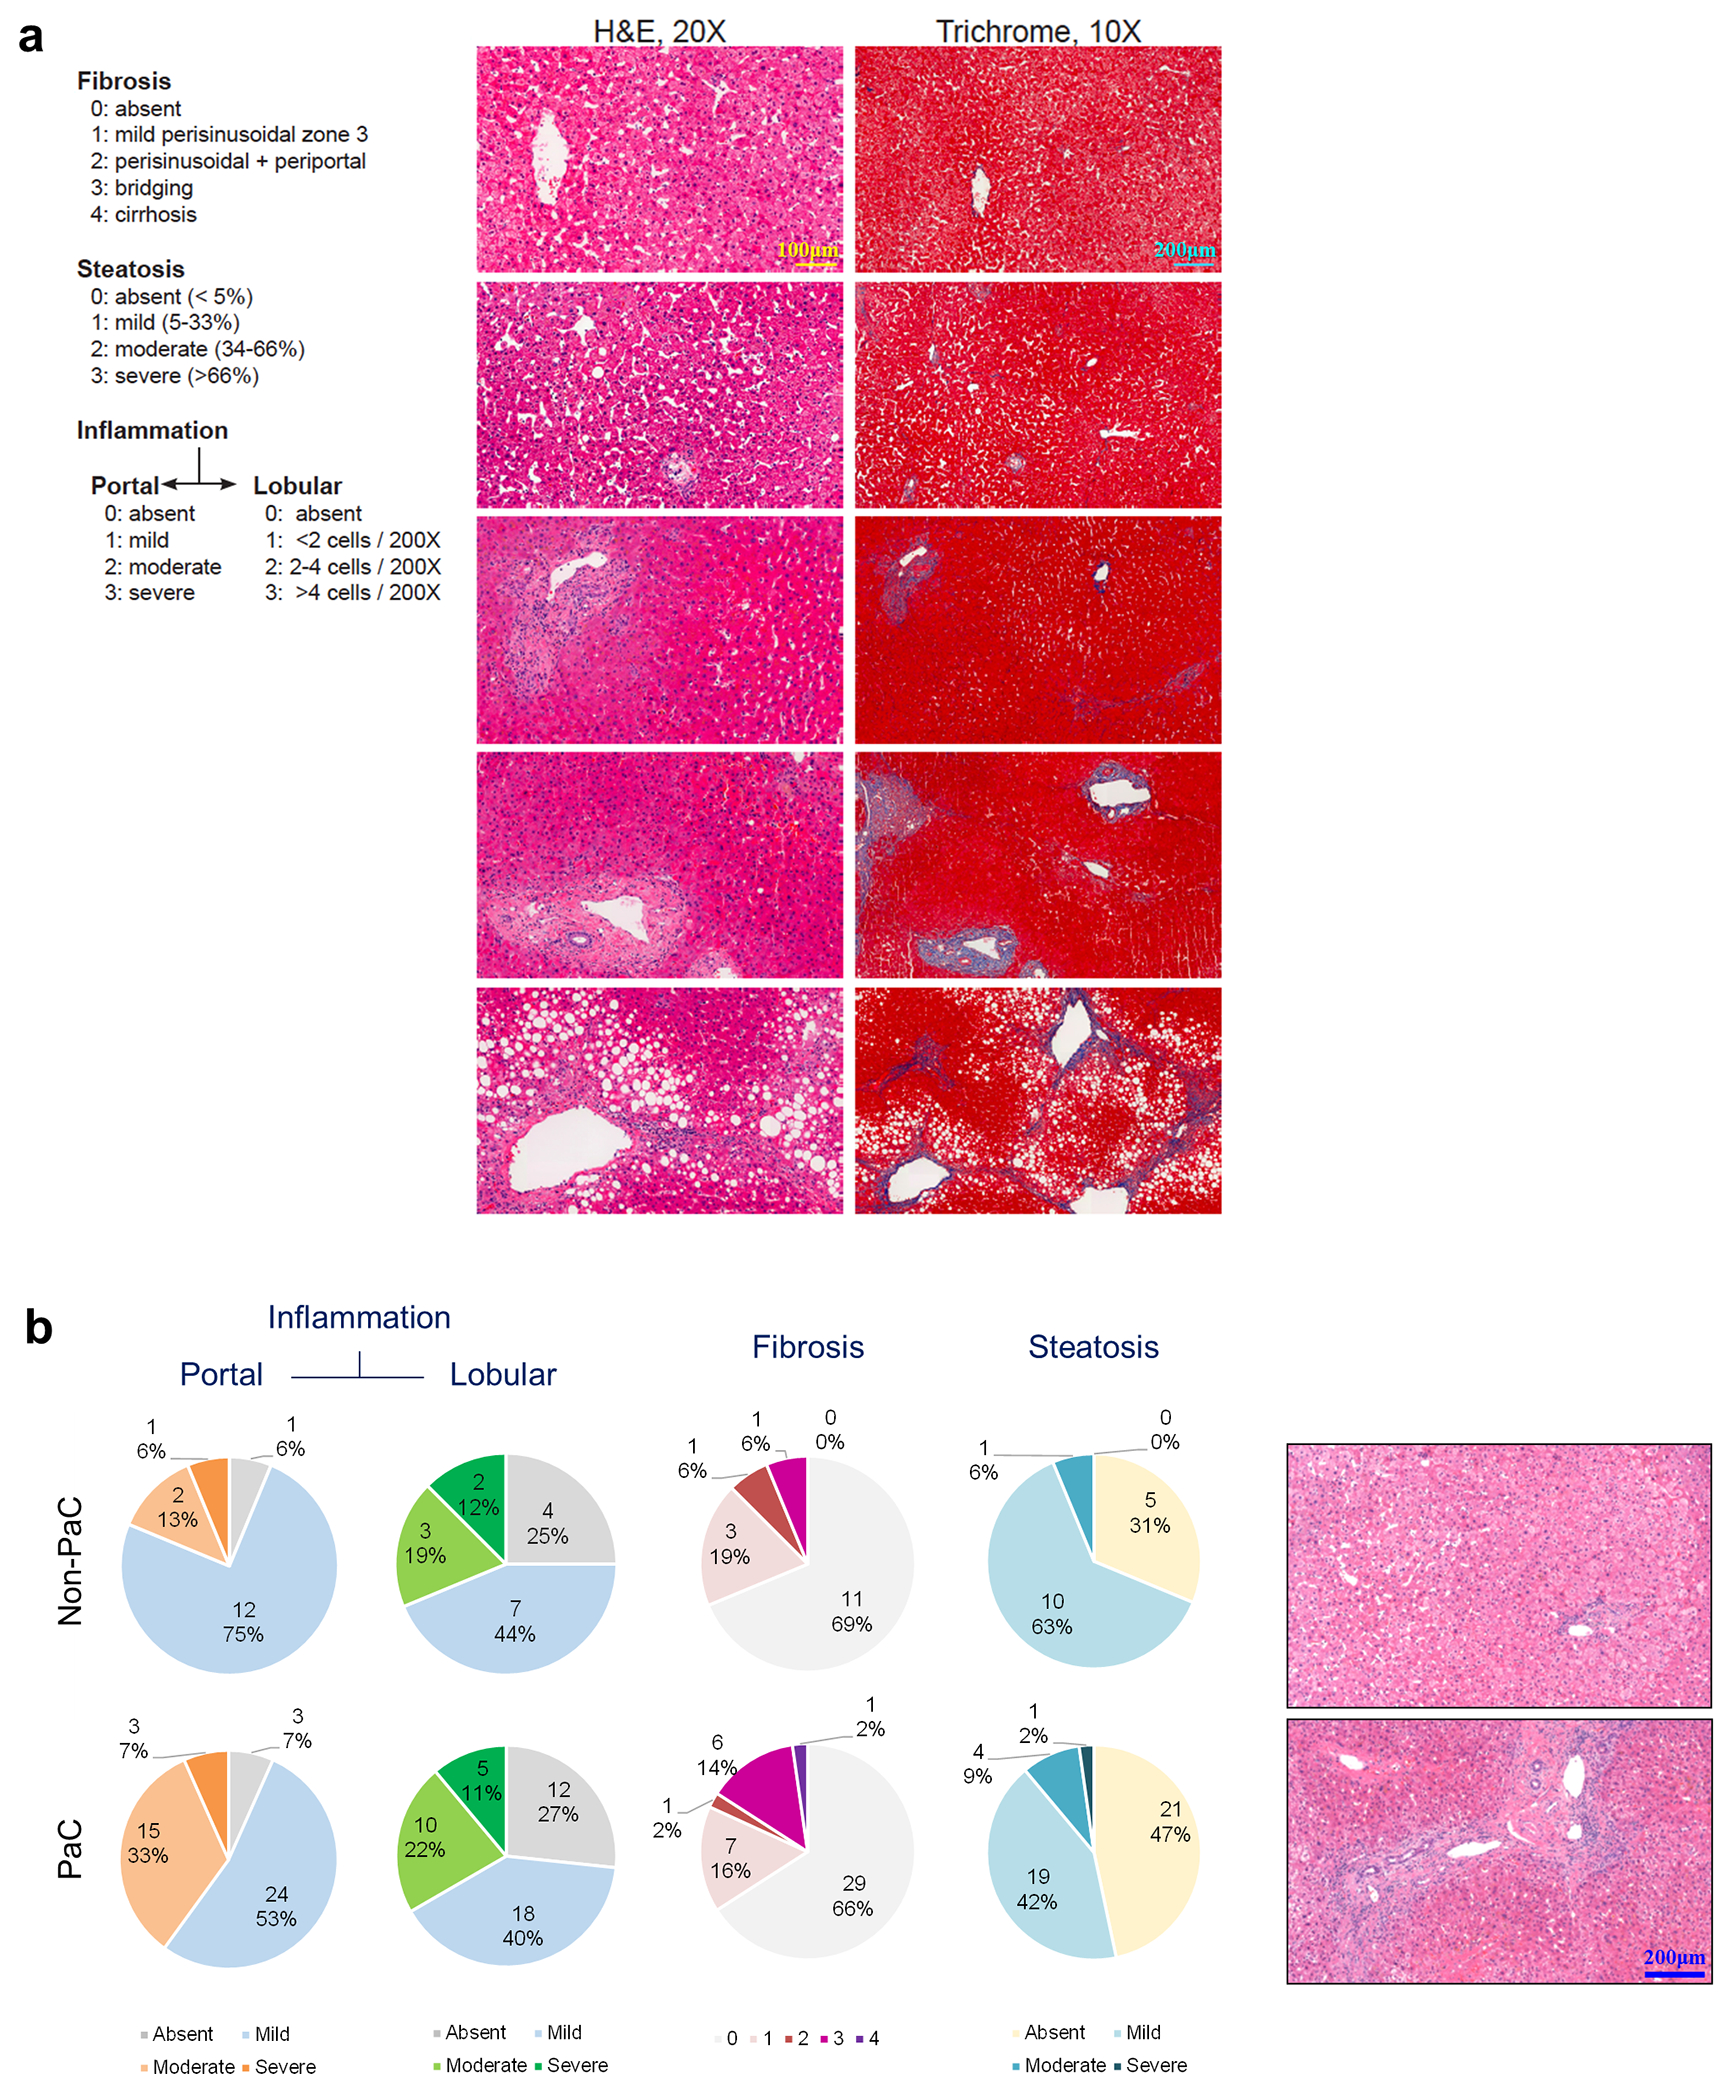
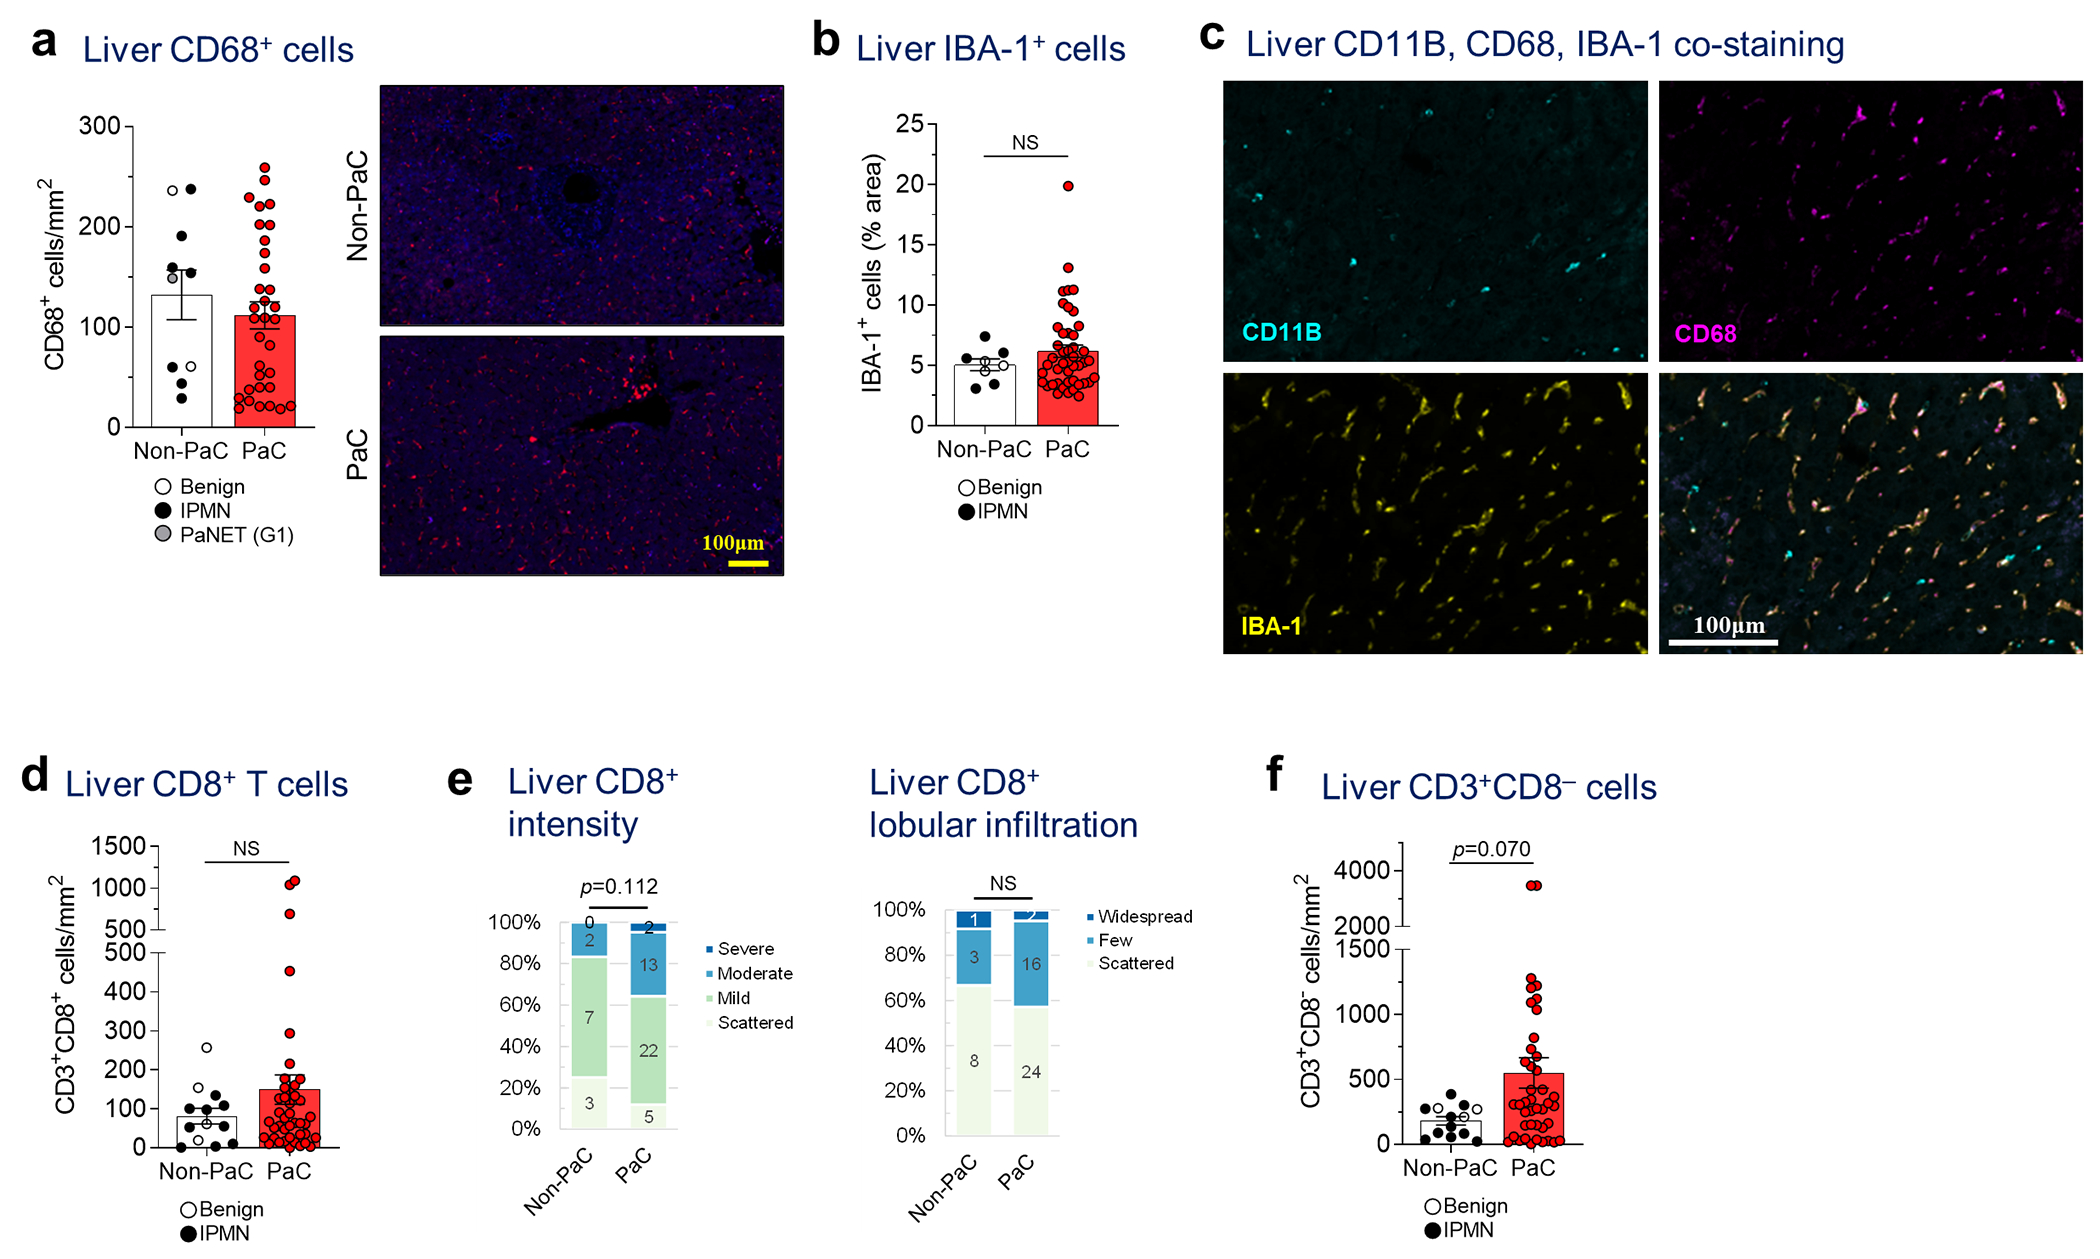
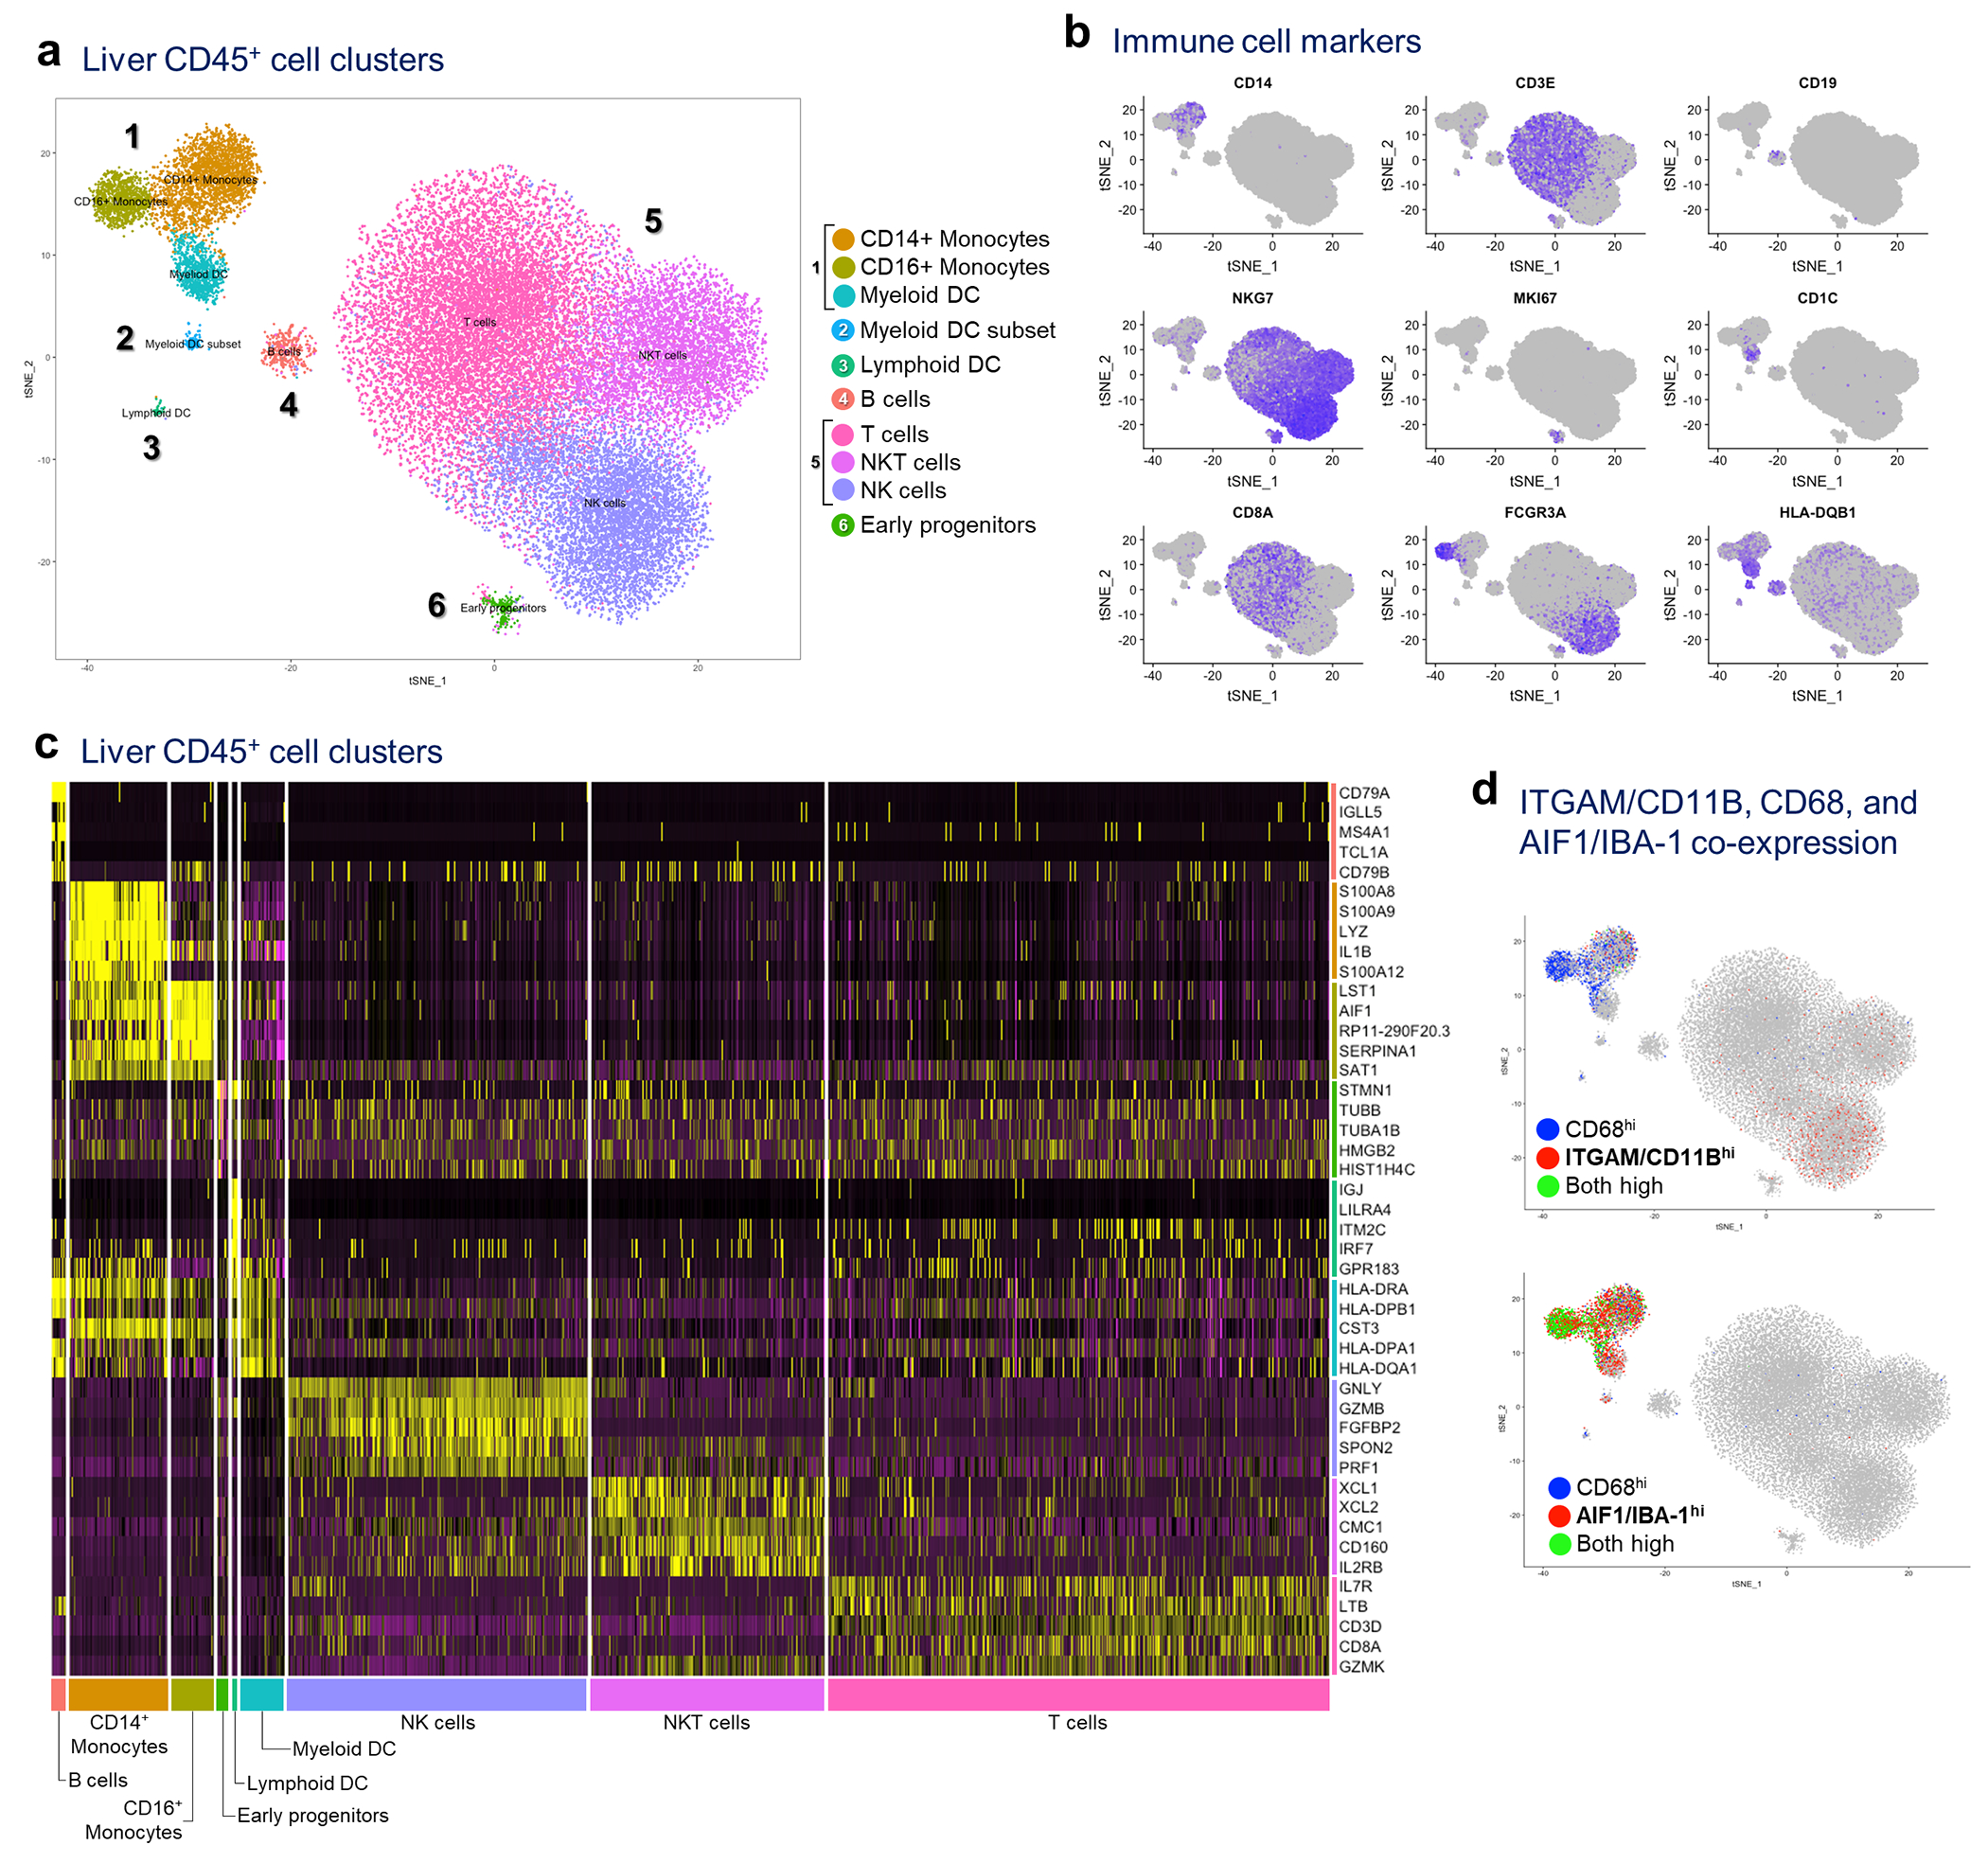
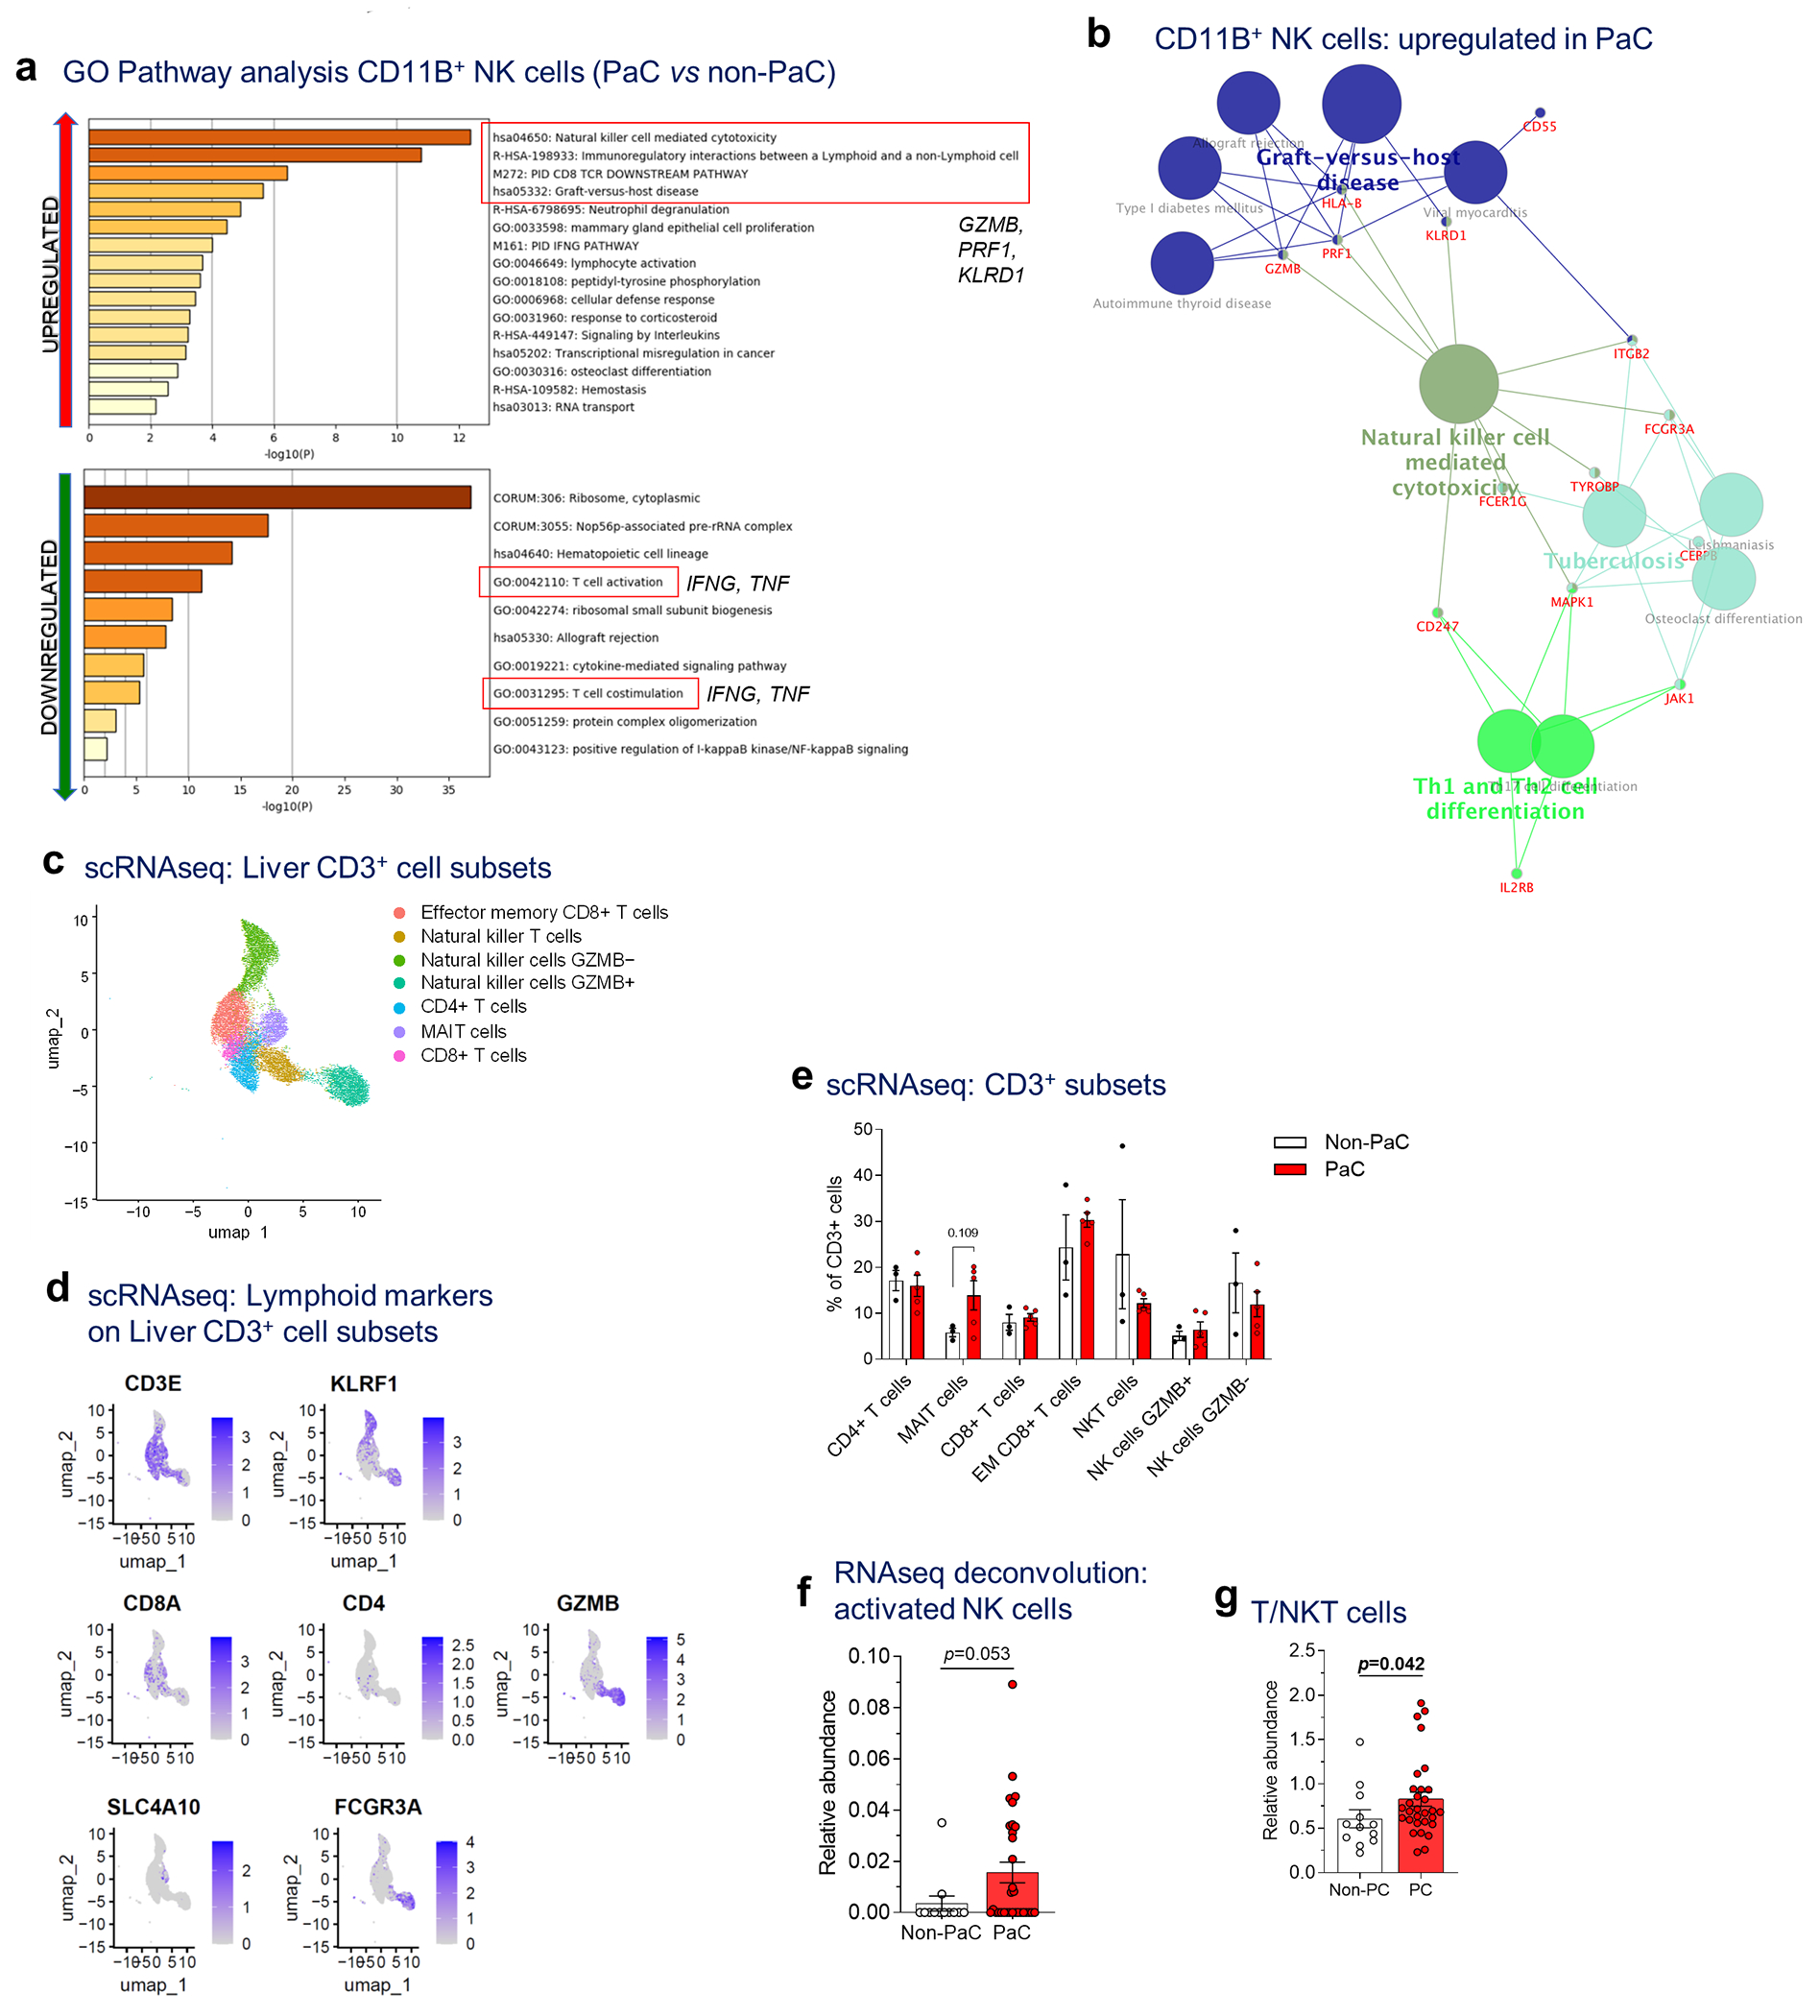
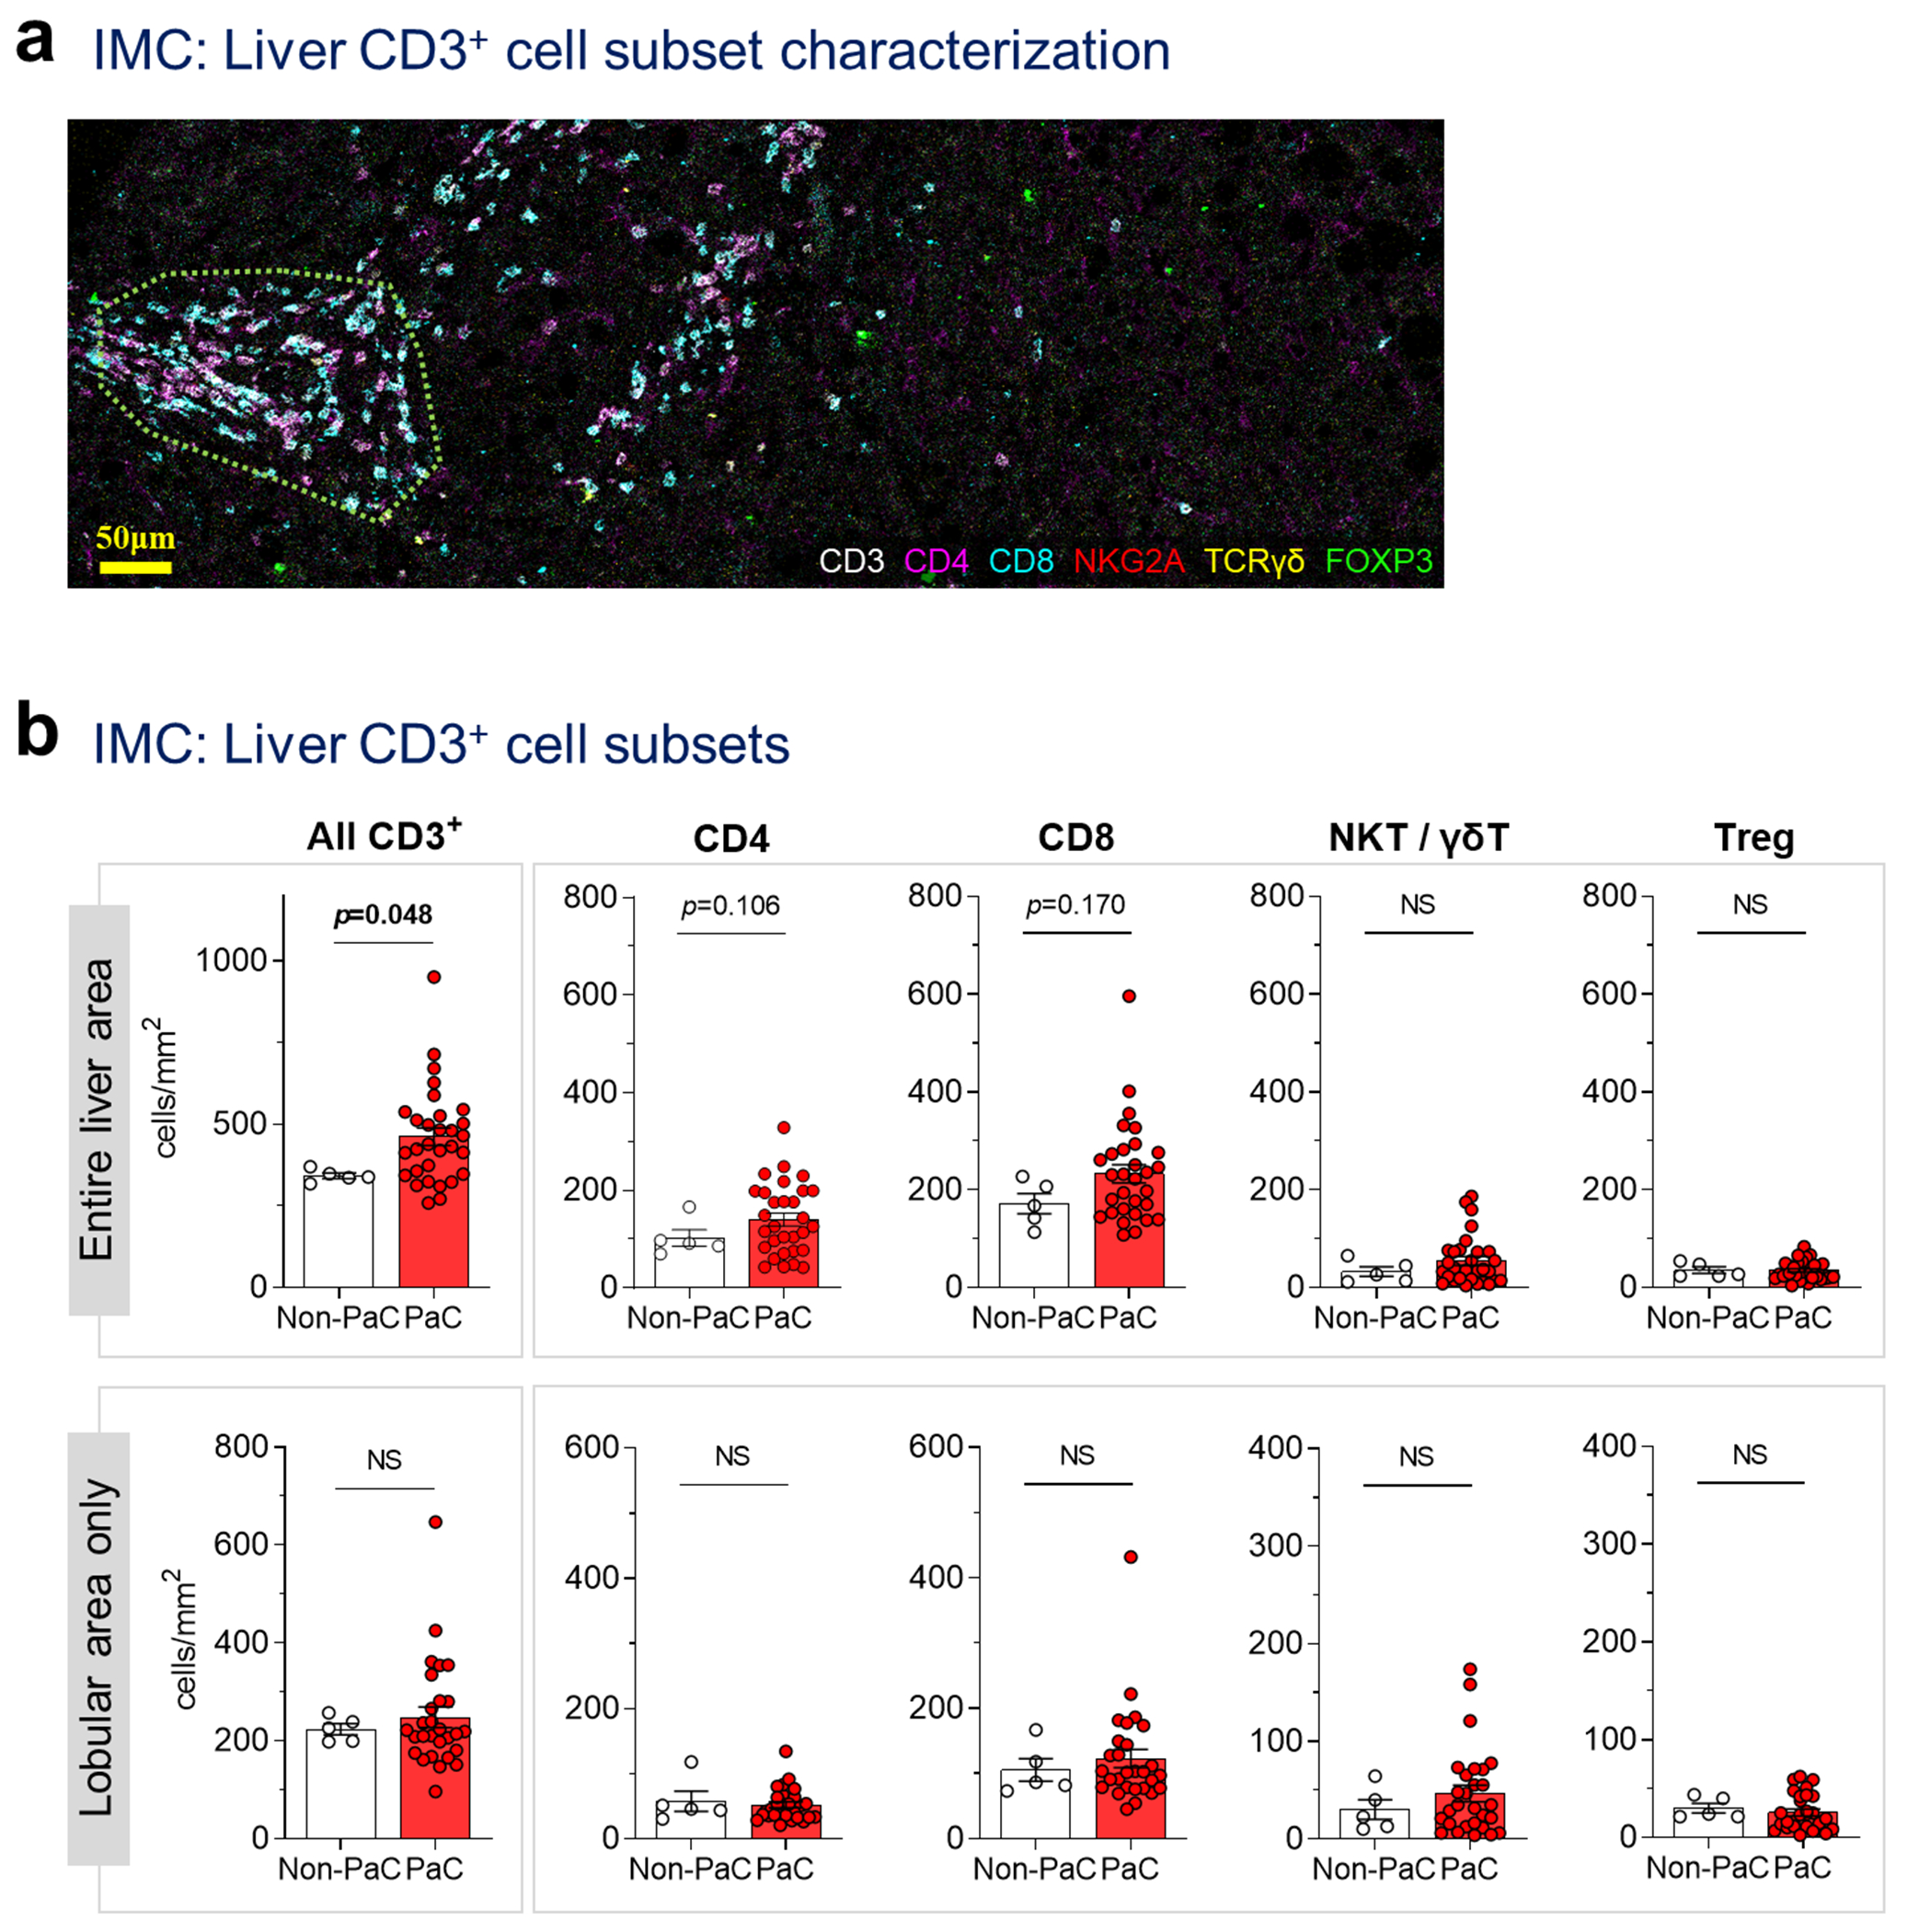
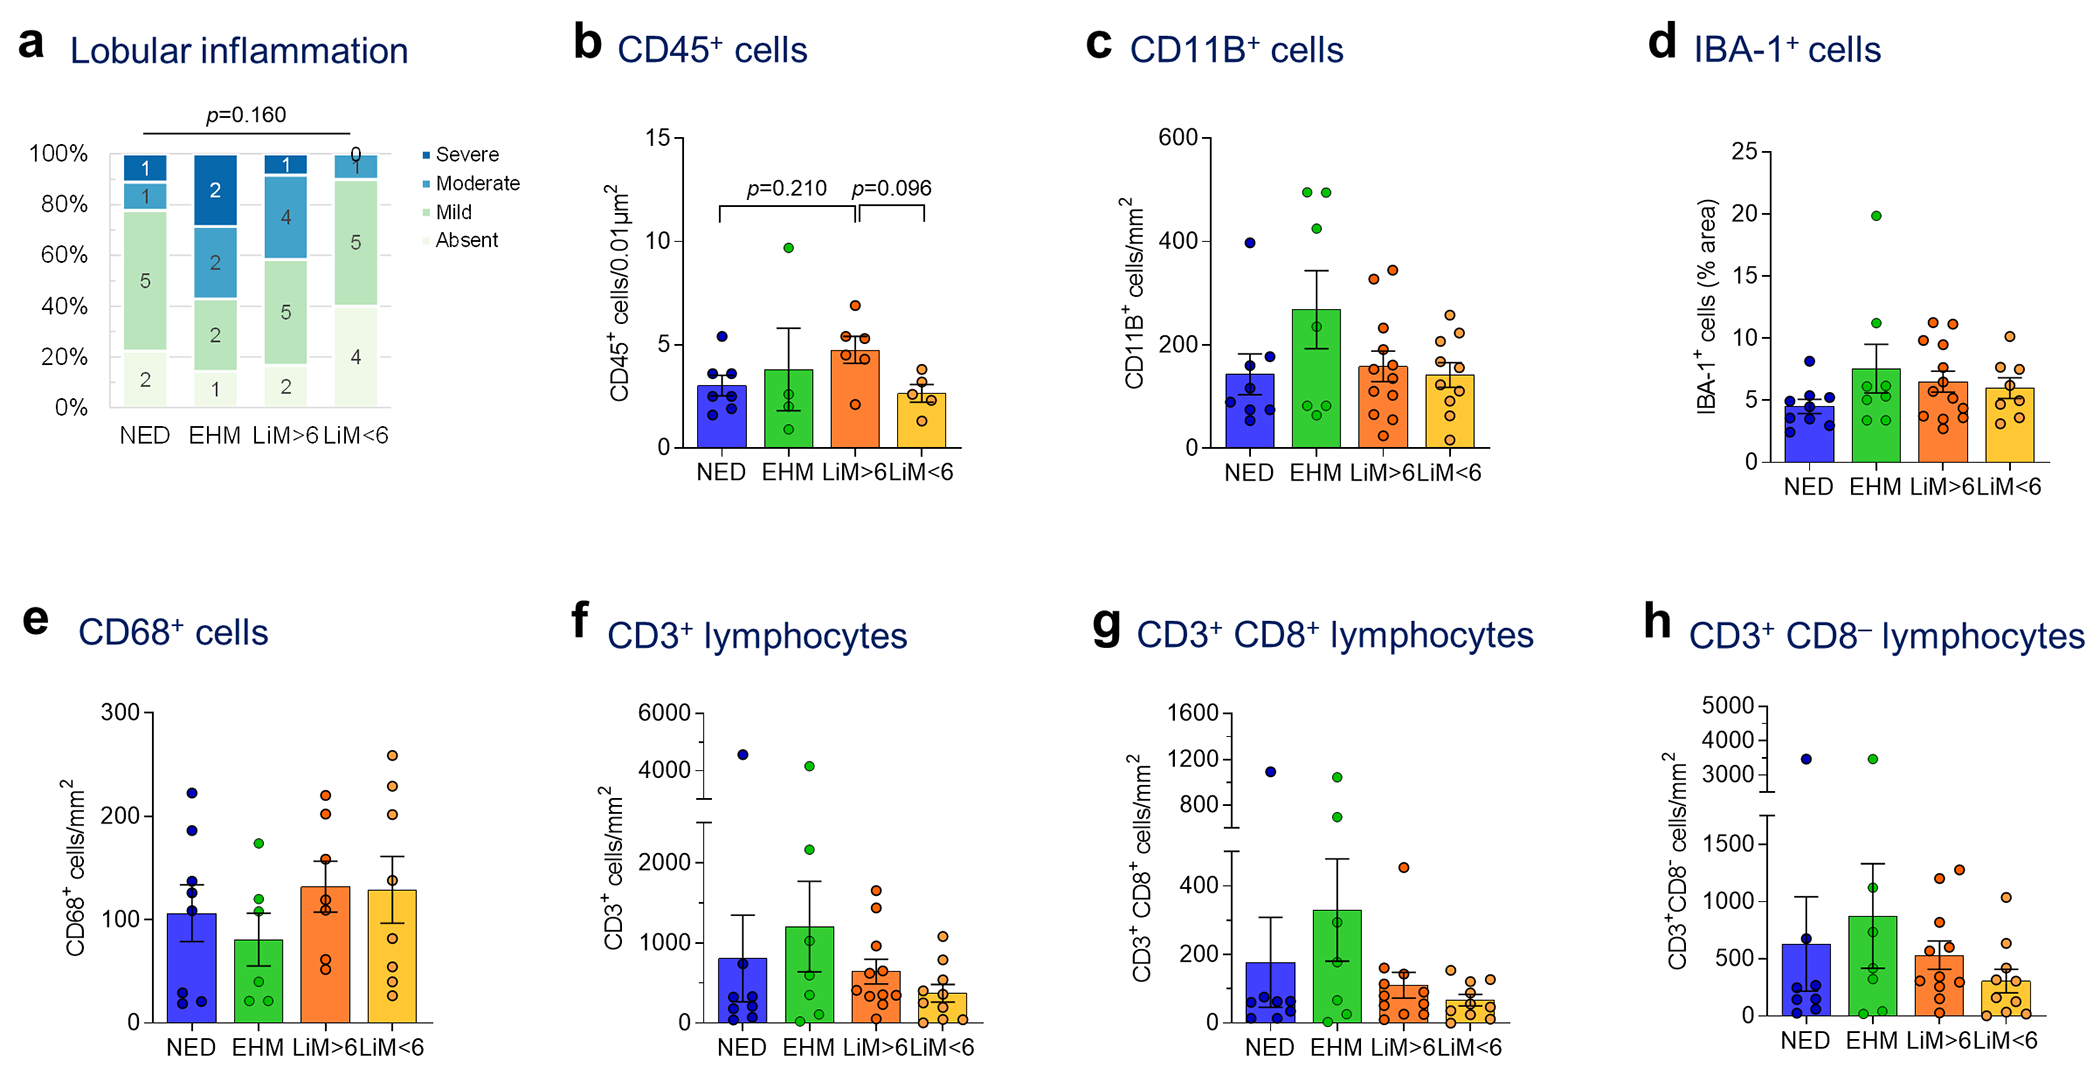
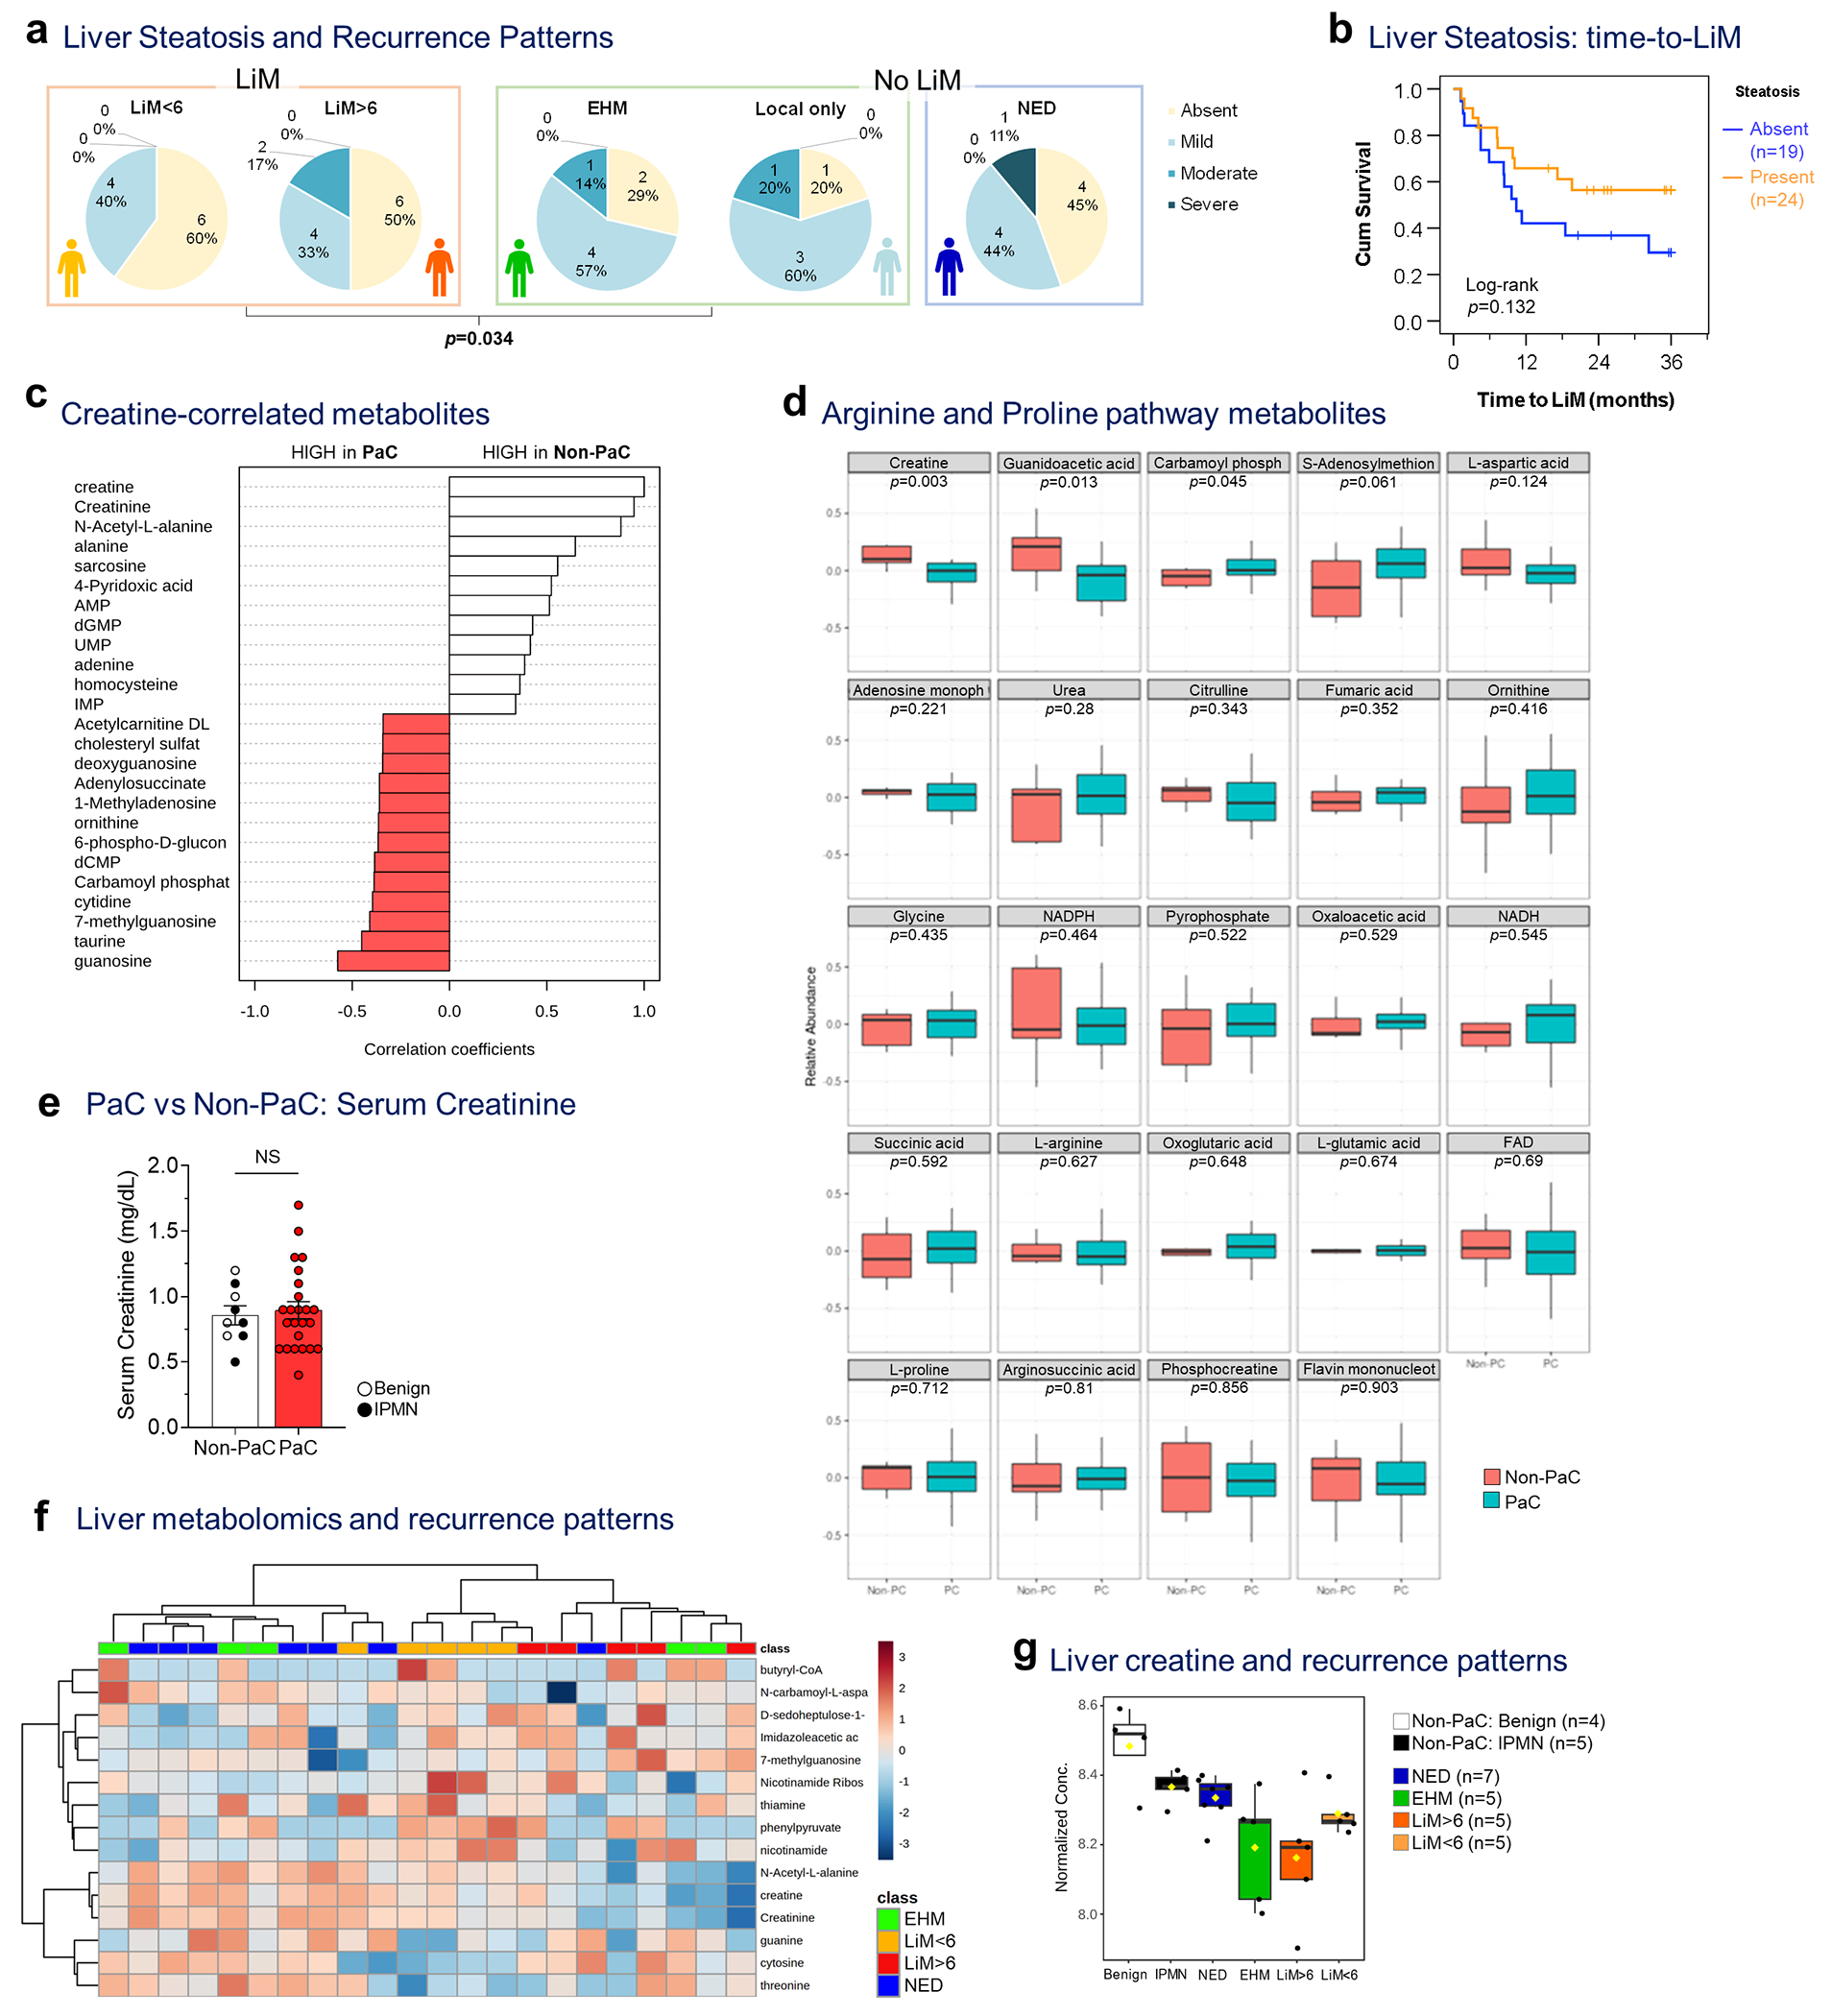
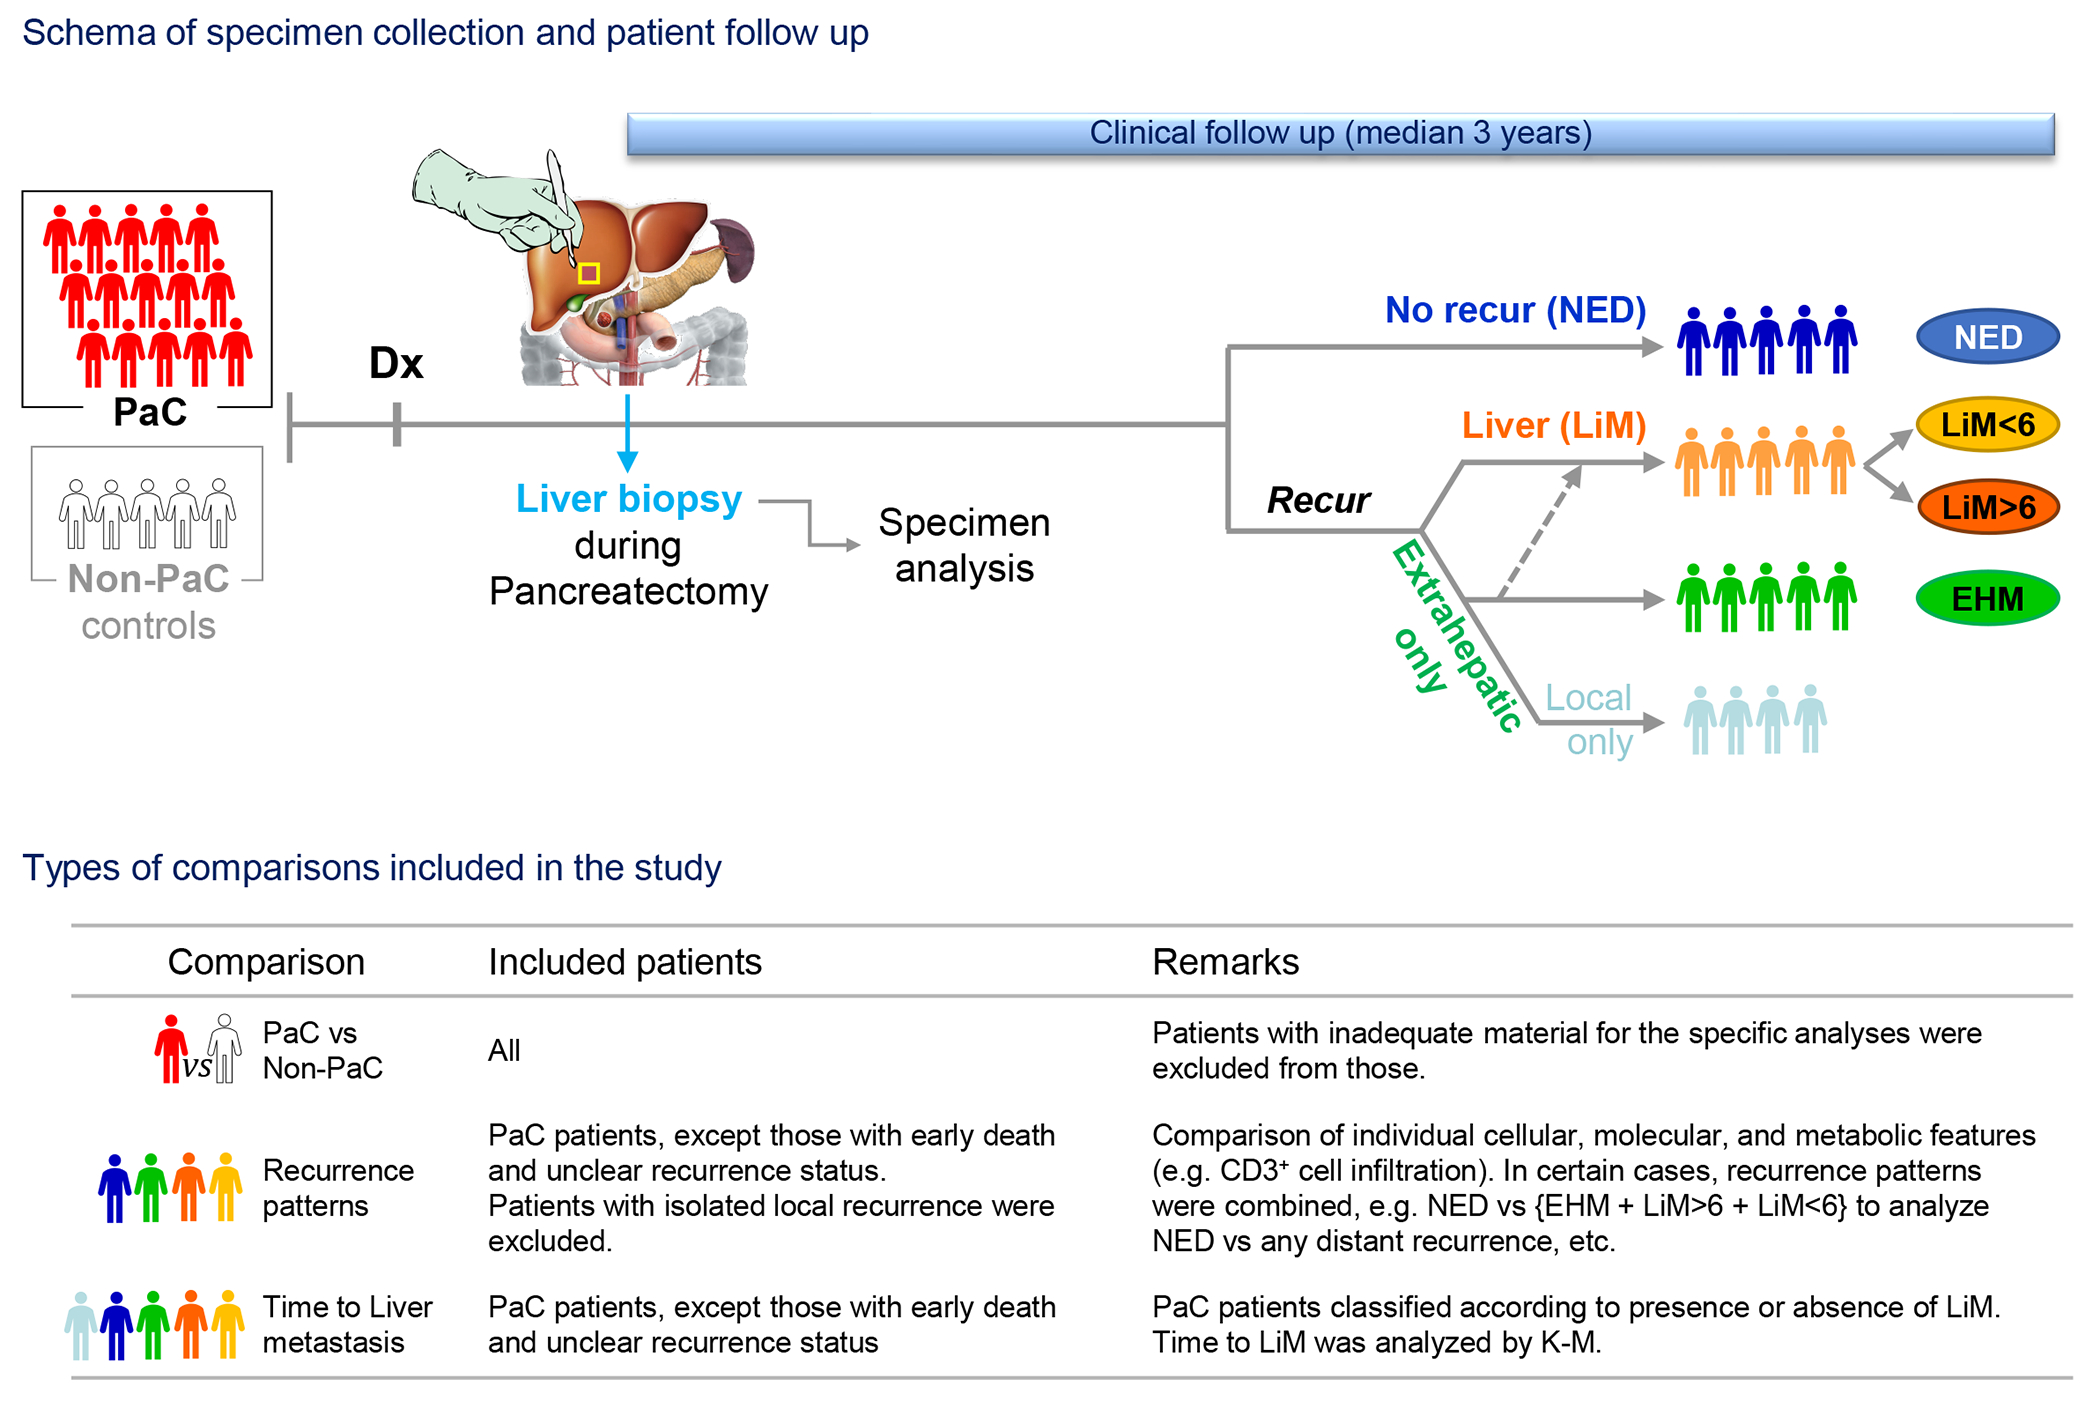
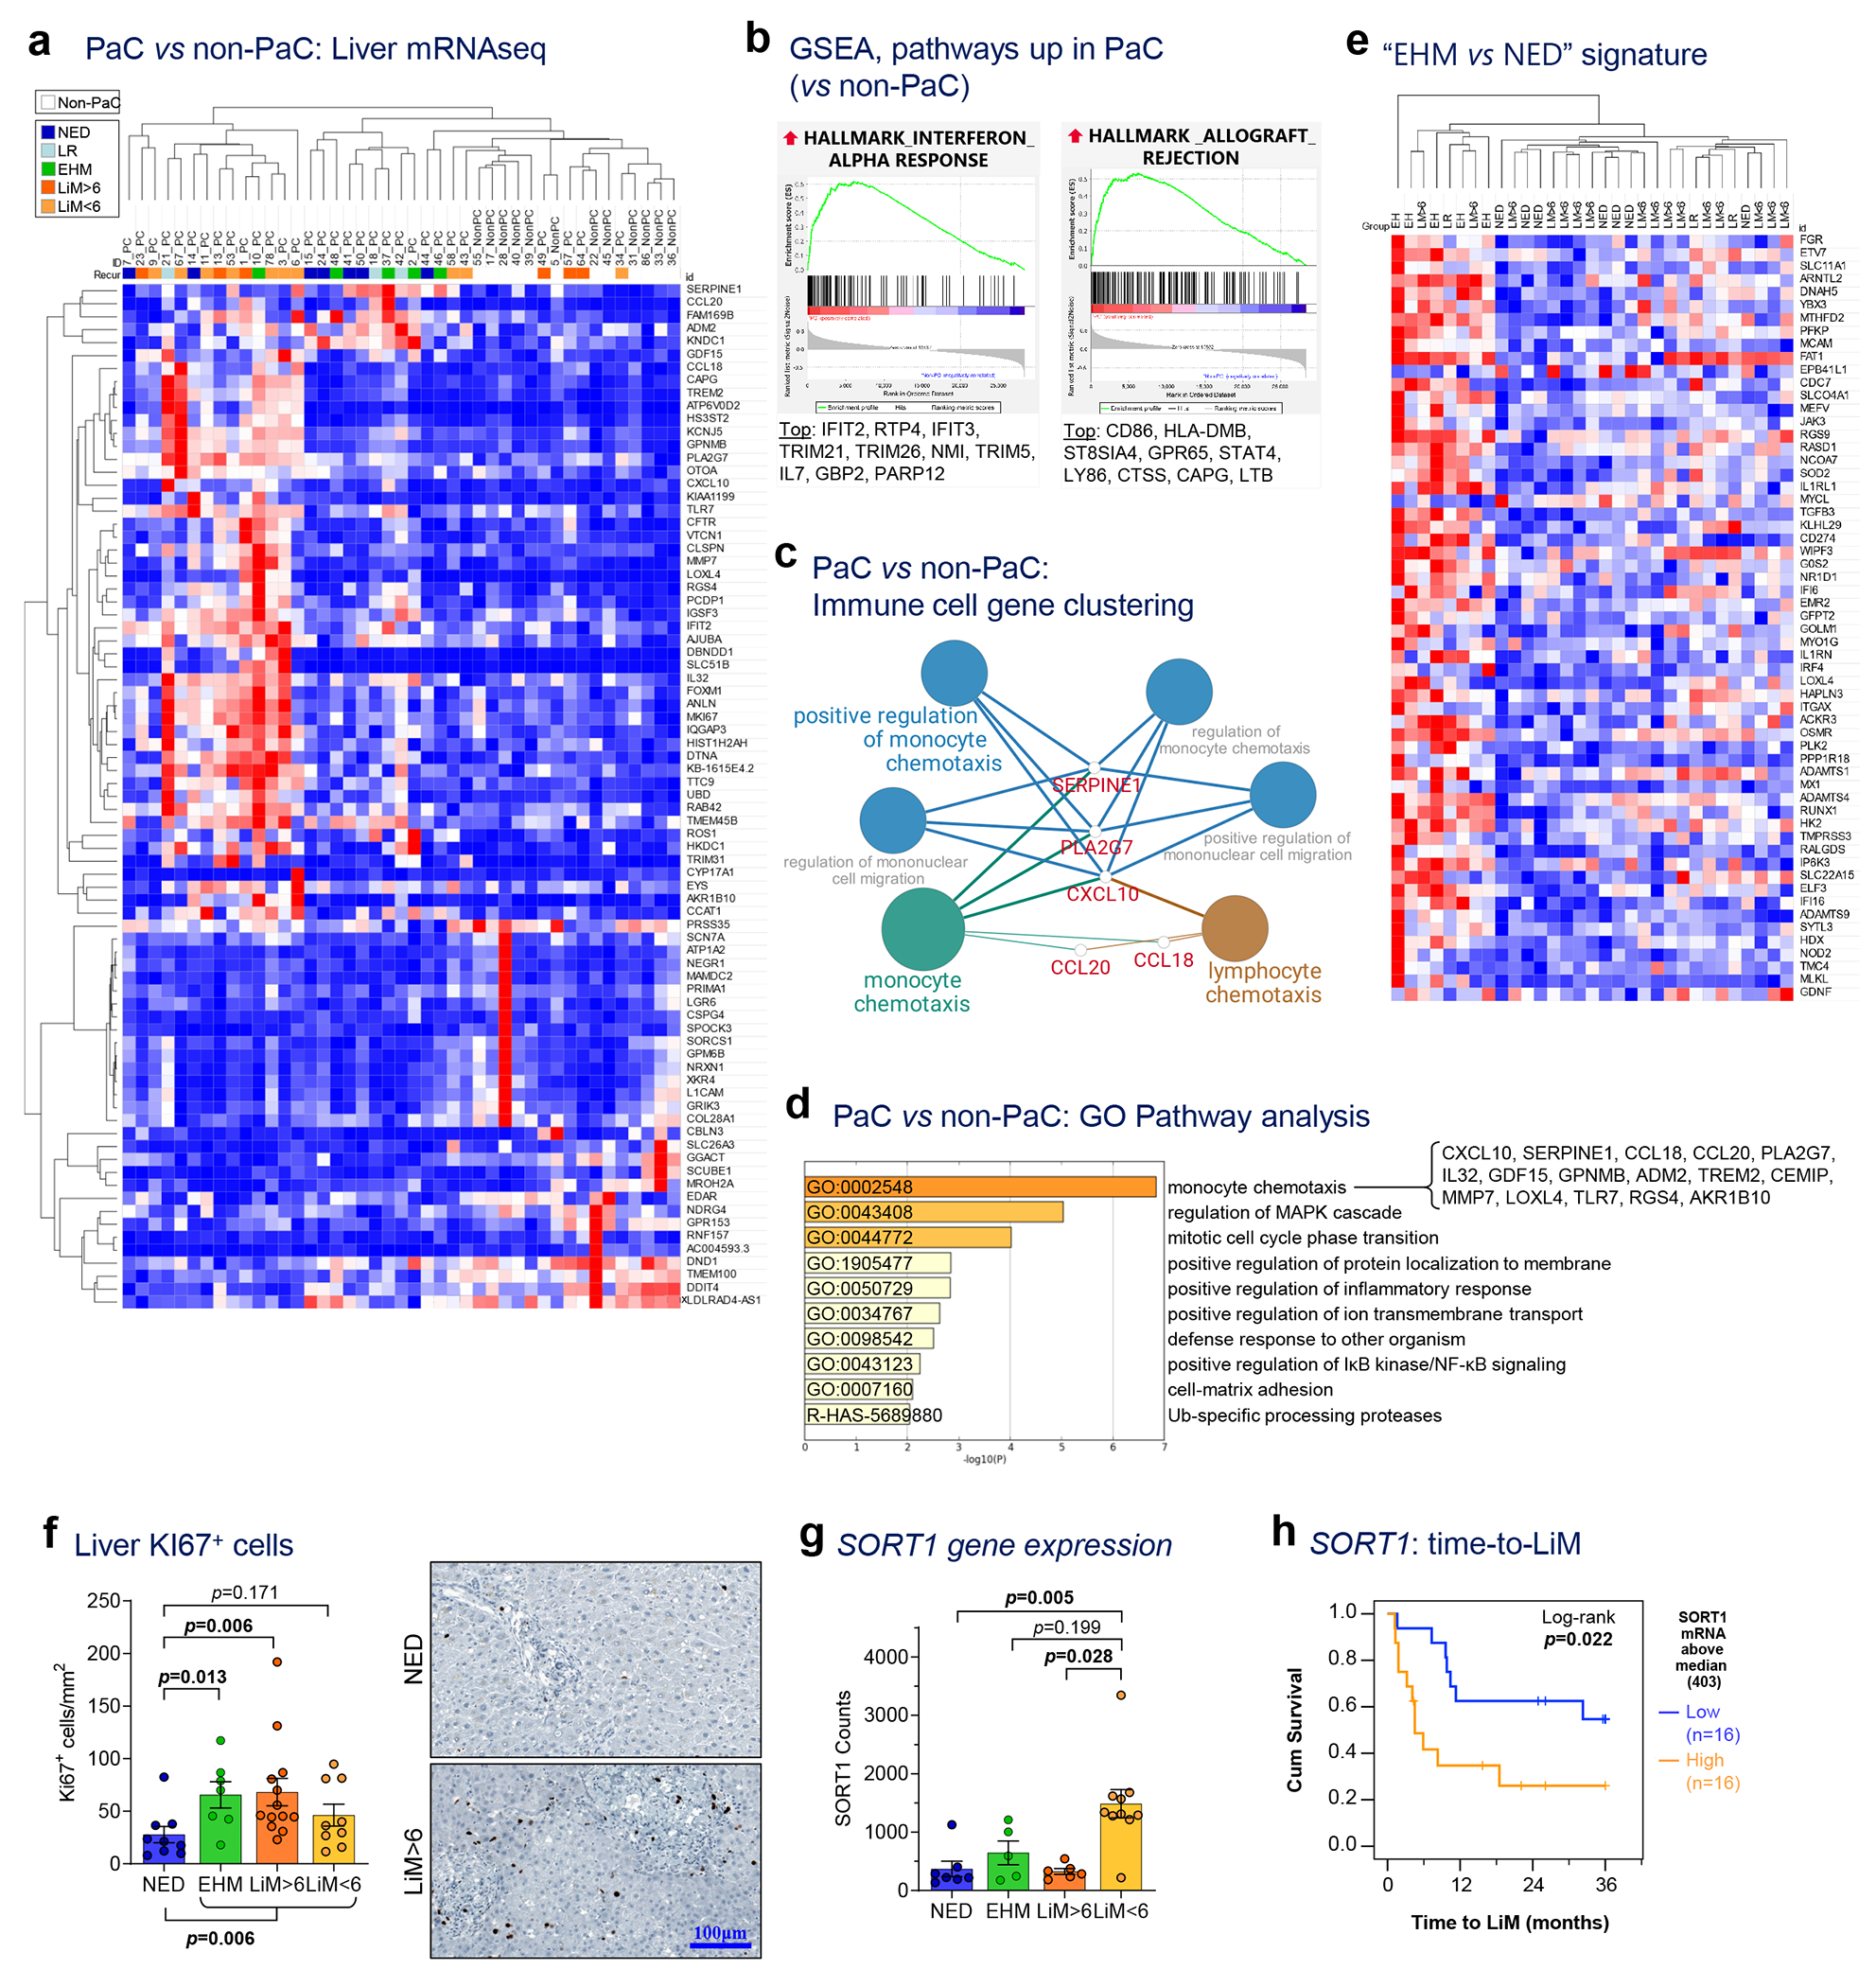
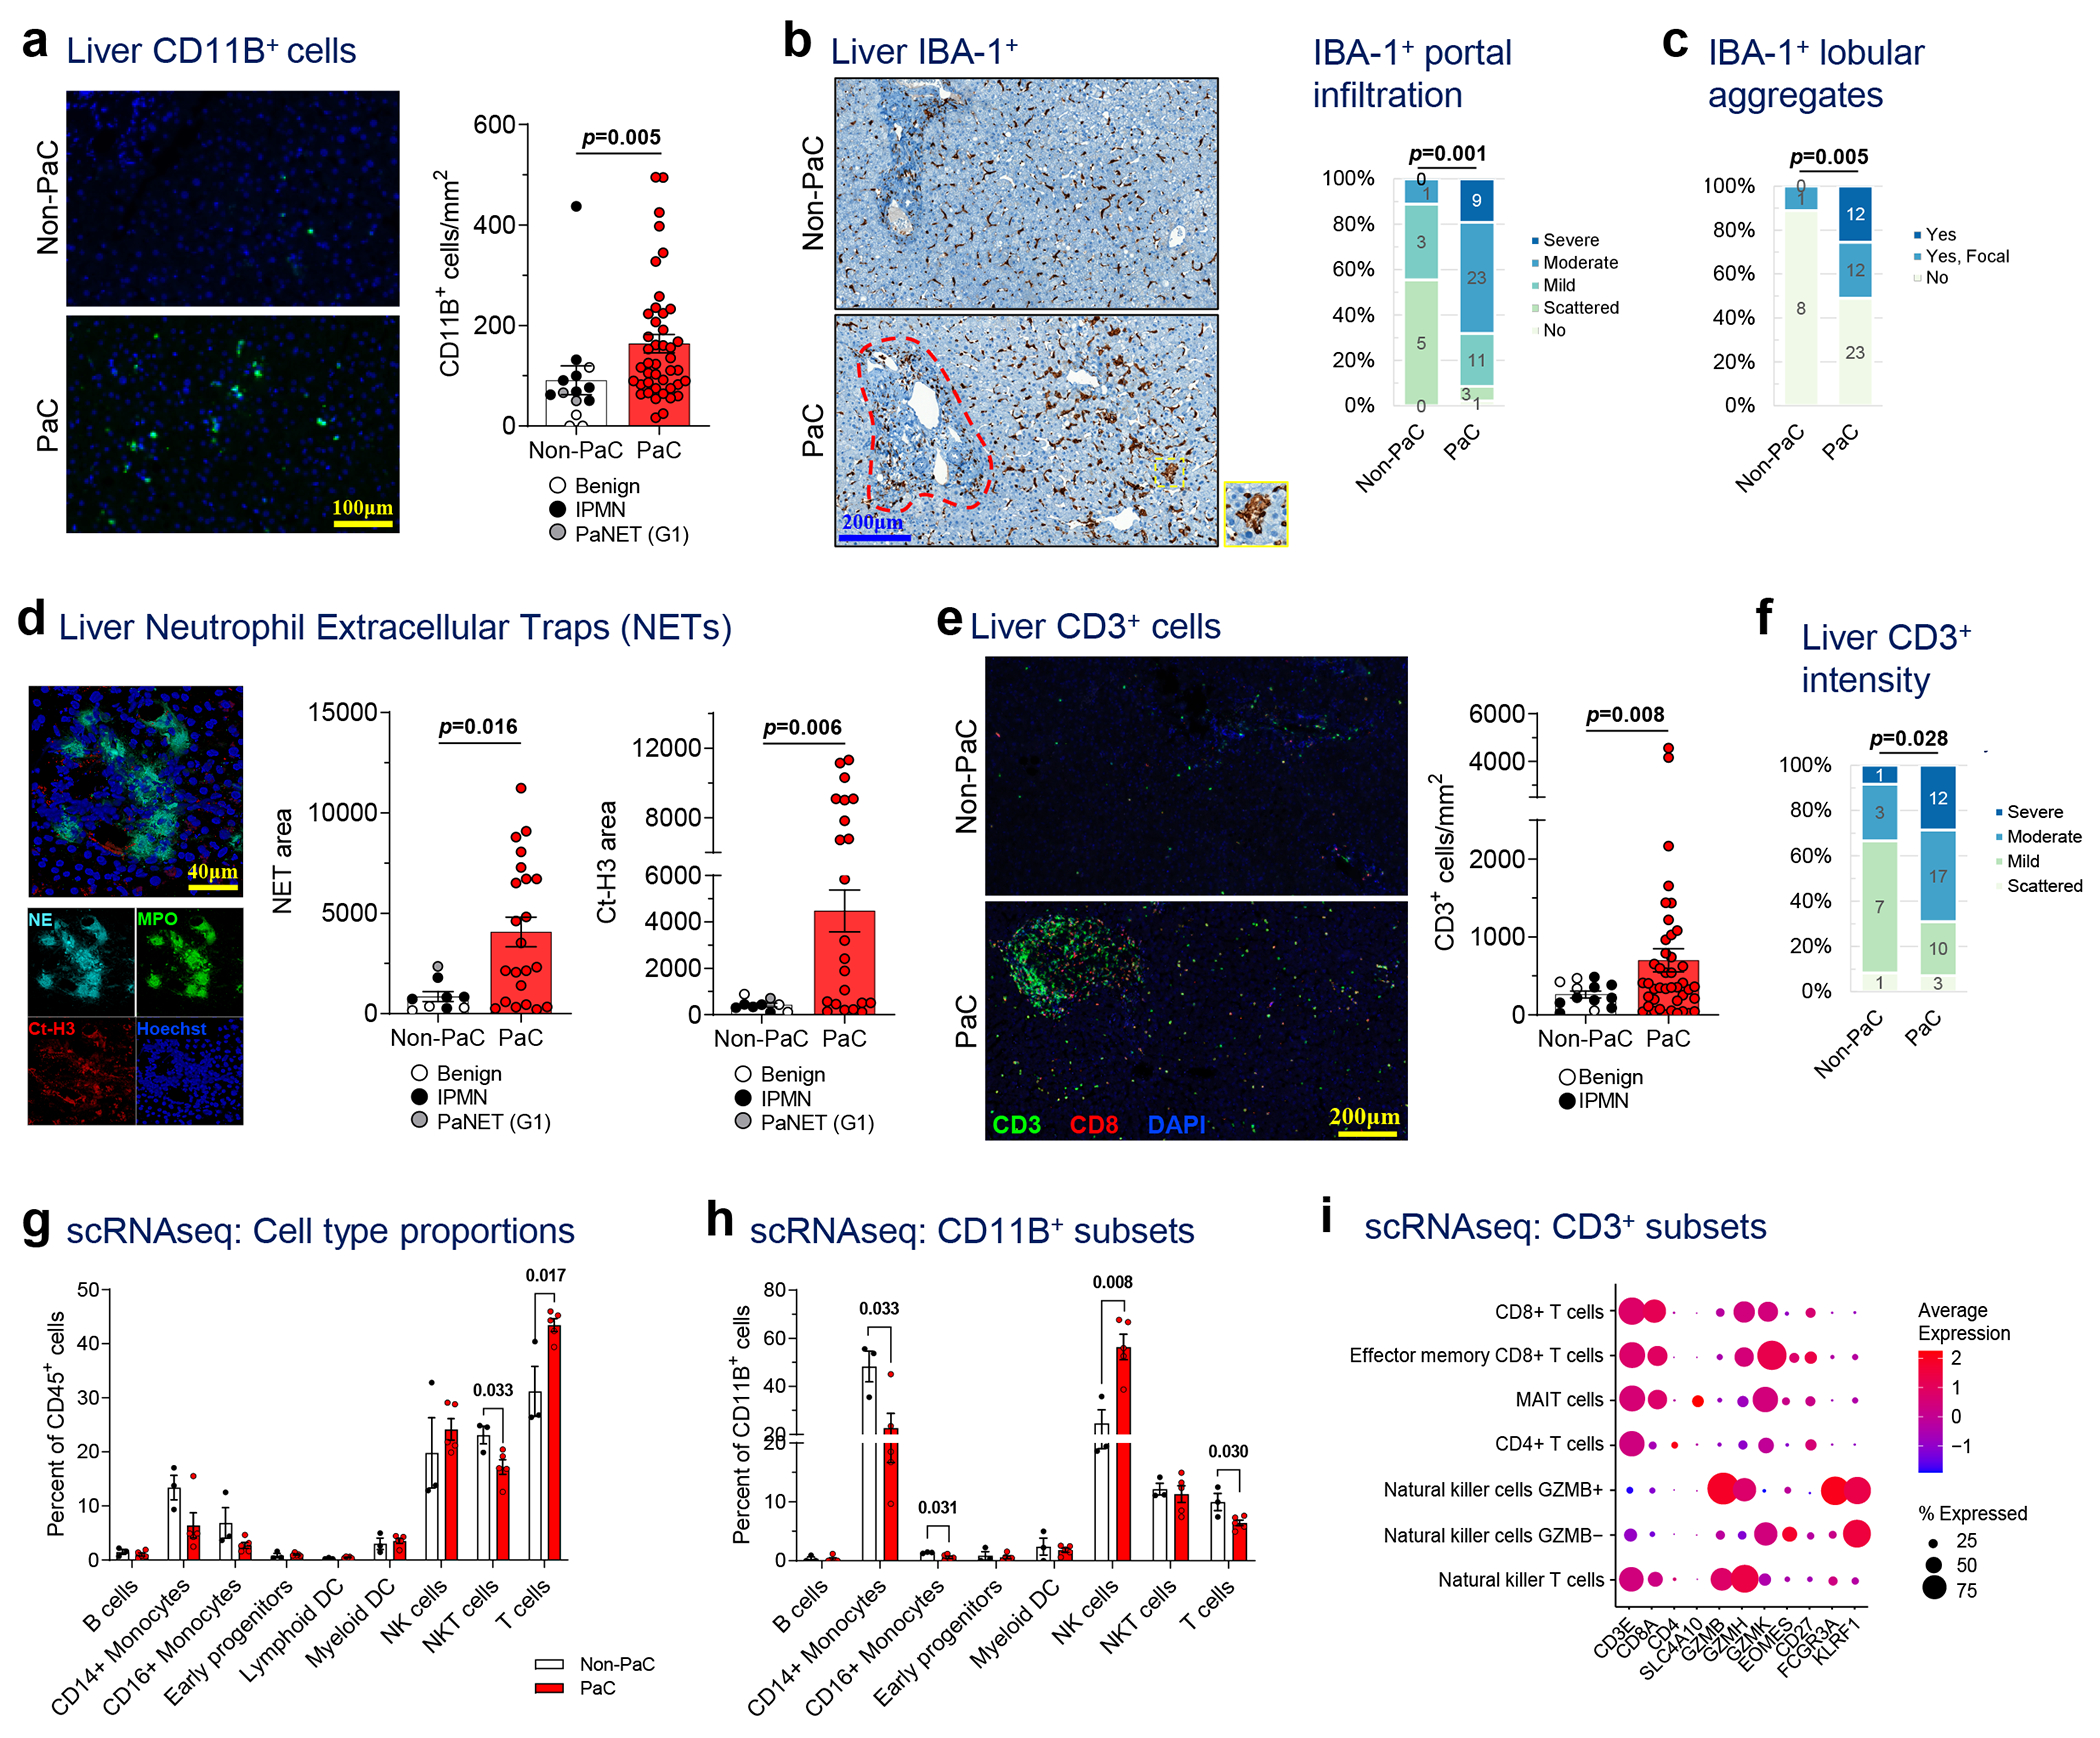
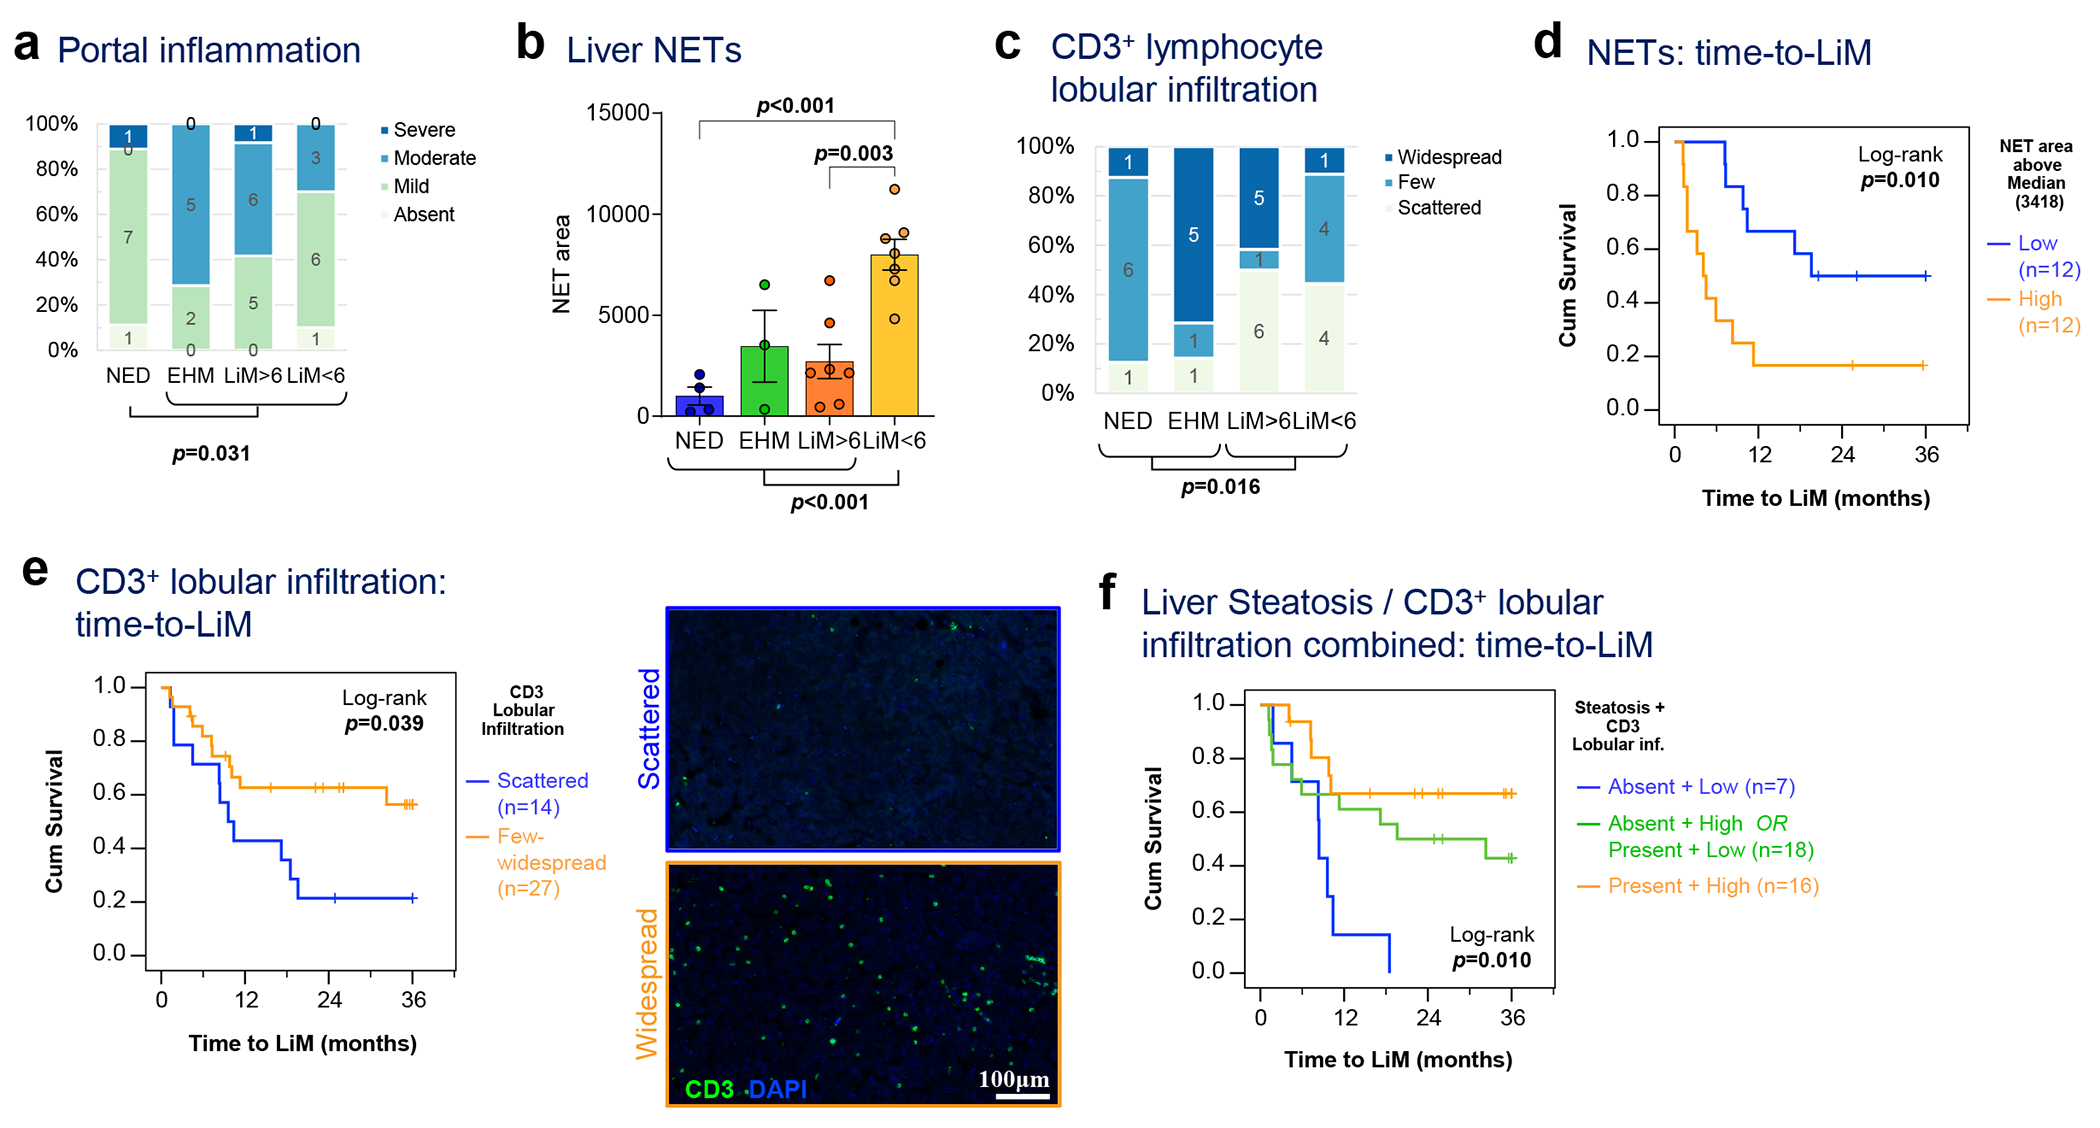
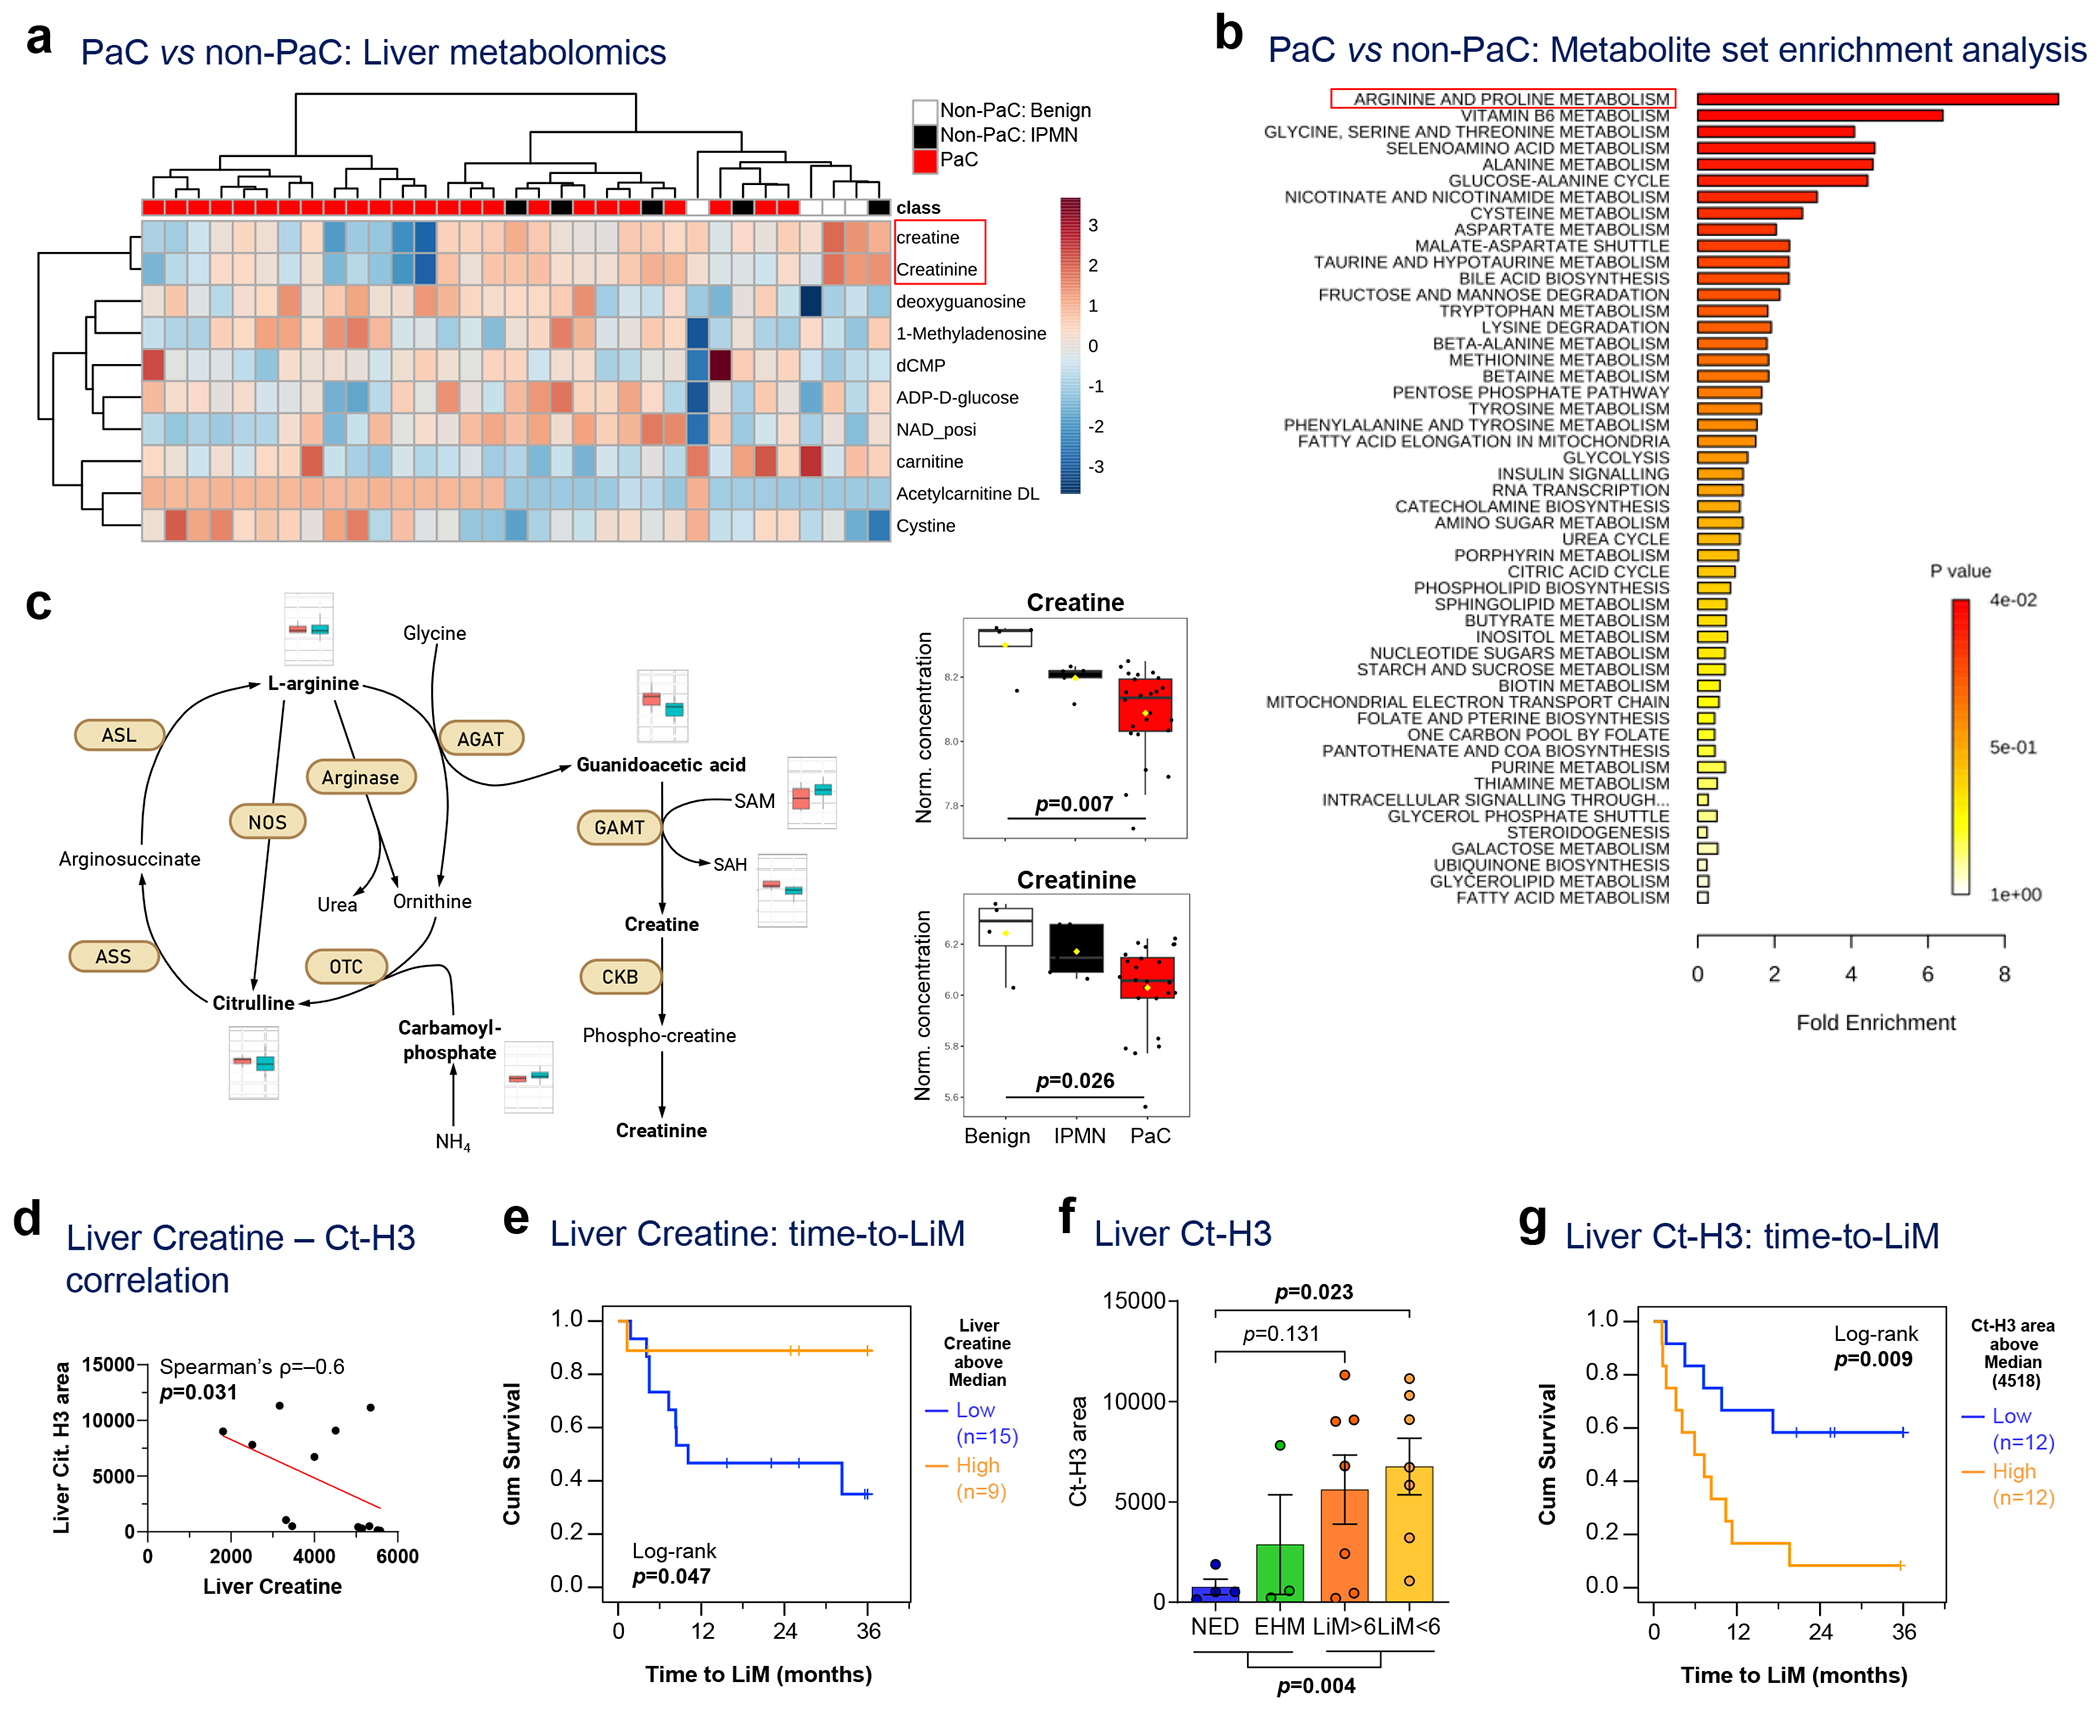
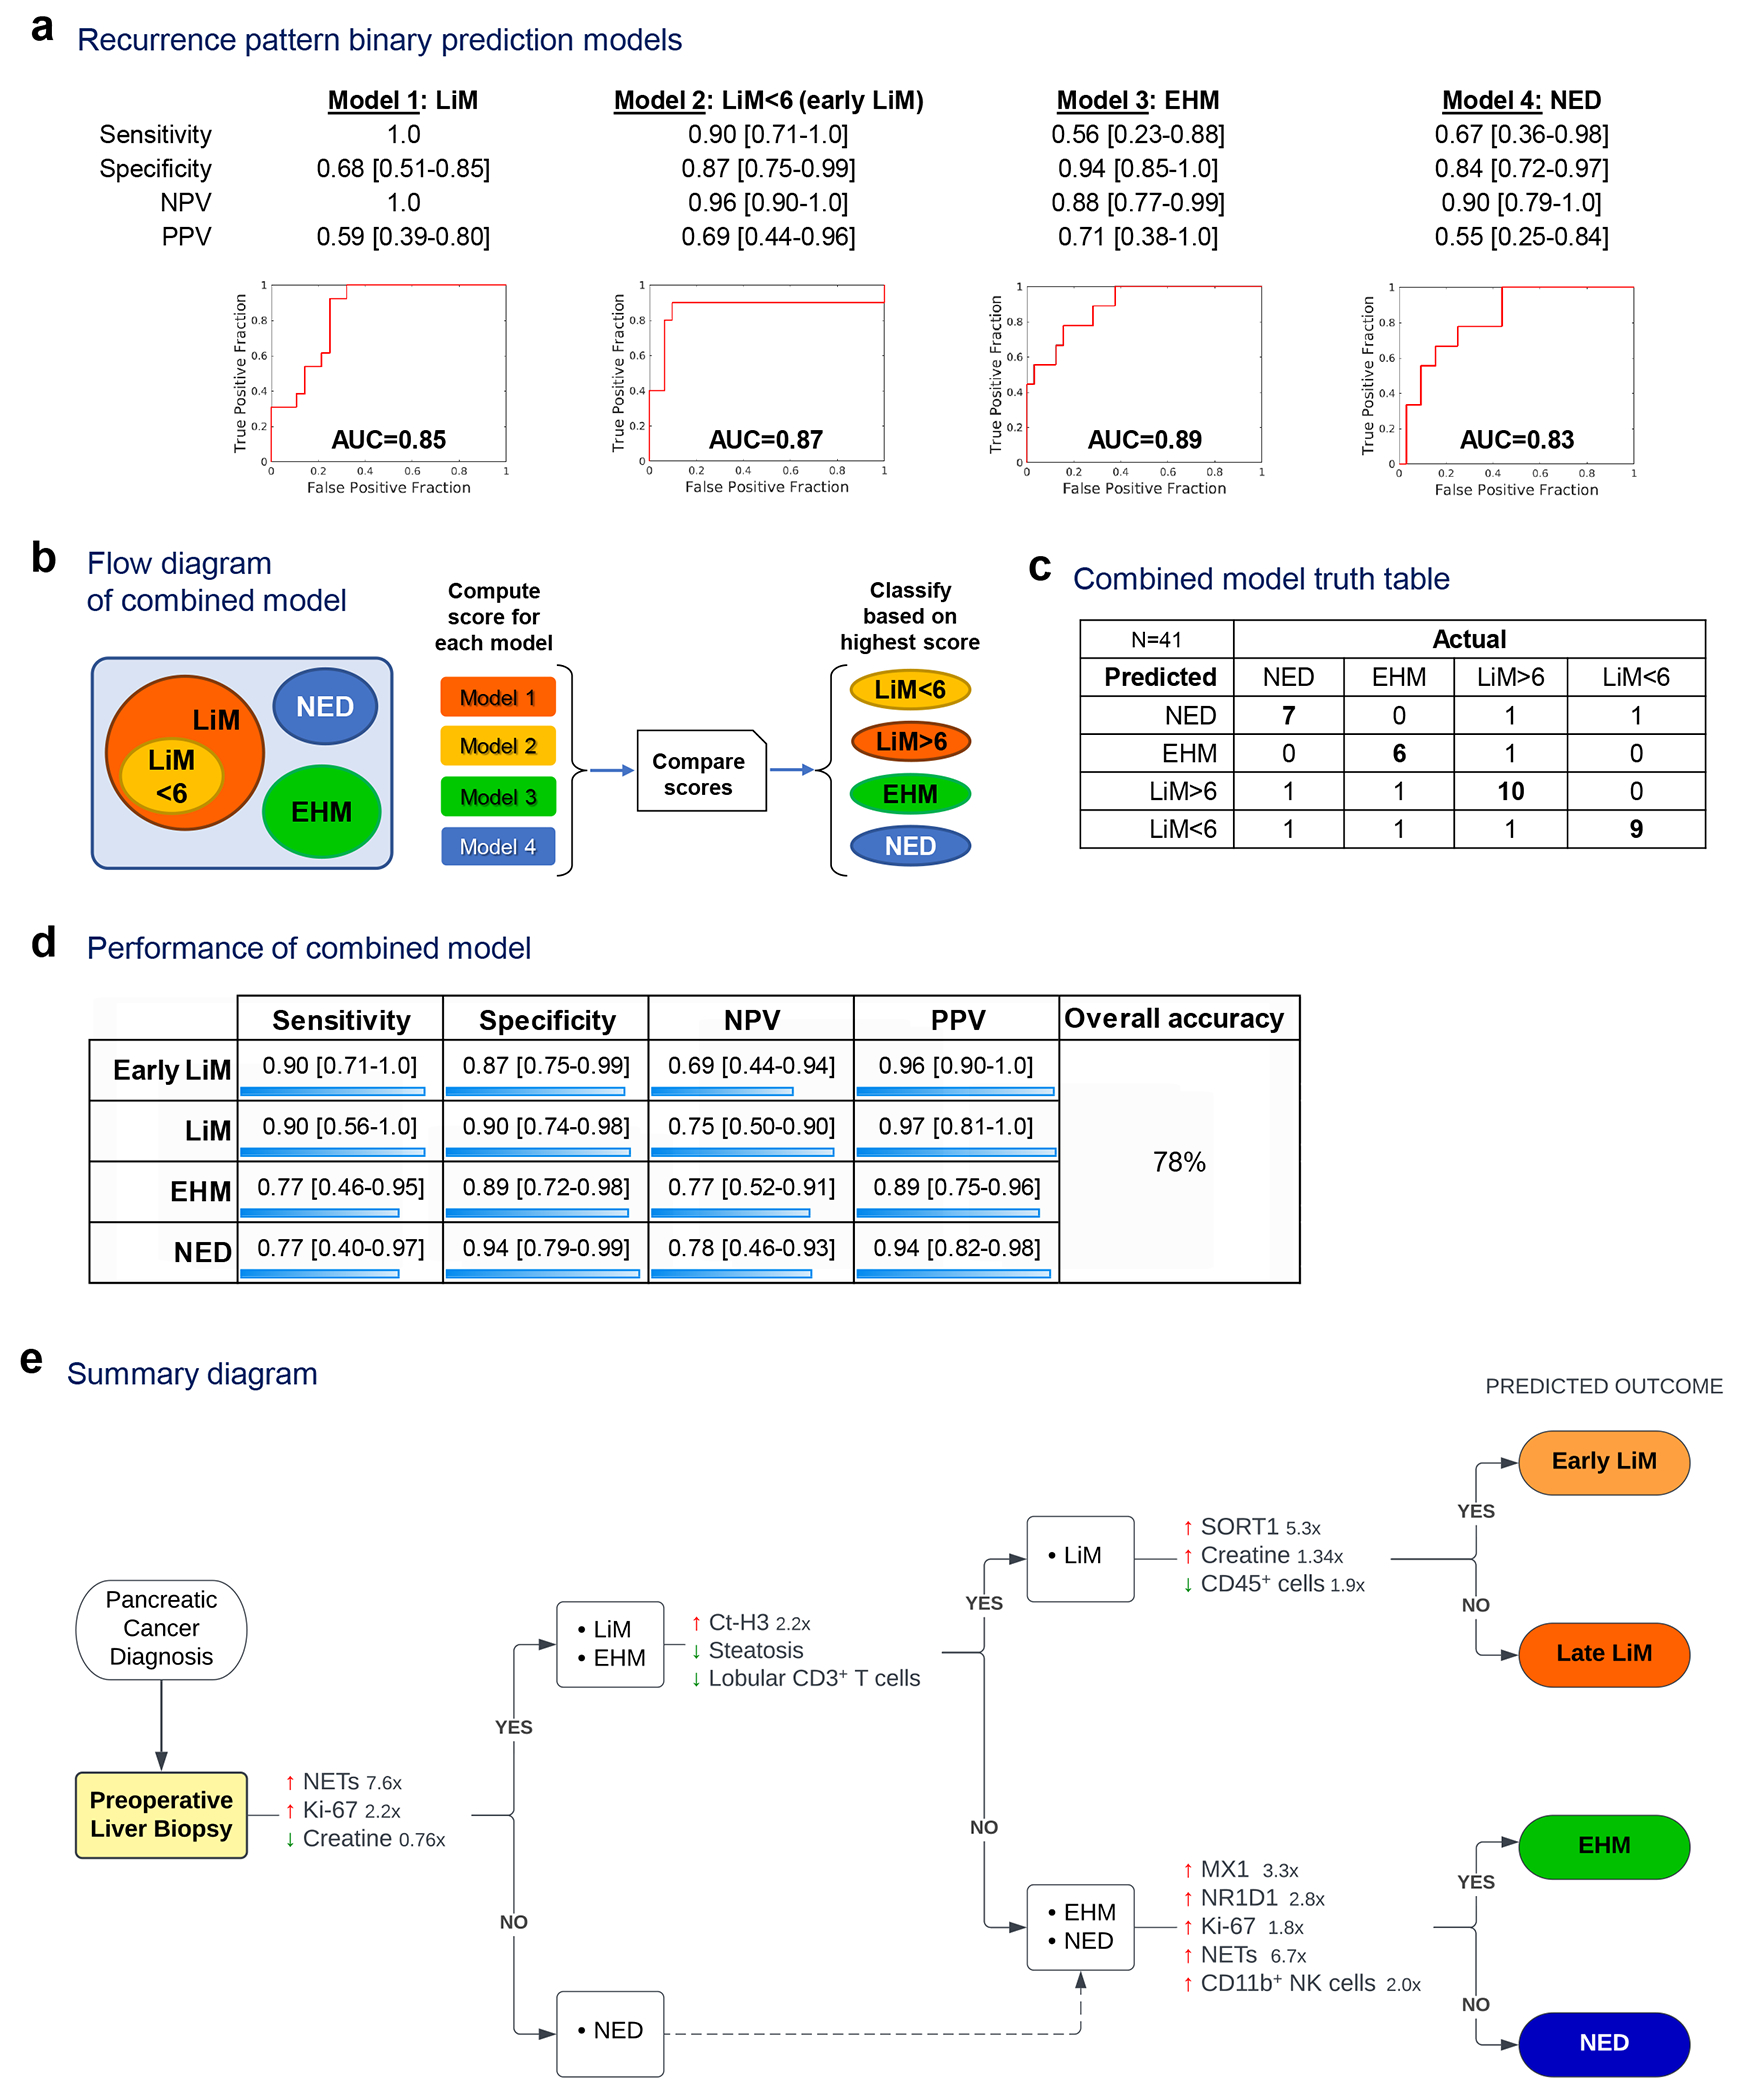
Metastasis occurs frequently after resection of pancreatic cancer (PaC). In this study, we hypothesized that multi-parametric analysis of pre-metastatic liver biopsies would classify patients according to their metastatic risk, timing and organ site. Liver biopsies obtained during pancreatectomy from 49 patients with localized PaC and 19 control patients with non-cancerous pancreatic lesions were analyzed, combining metabolomic, tissue and single-cell transcriptomics and multiplex imaging approaches. Patients were followed prospectively (median 3 years) and classified into four recurrence groups; early (<6 months after resection) or late (>6 months after resection) liver metastasis (LiM); extrahepatic metastasis (EHM); and disease-free survivors (no evidence of disease (NED)). Overall, PaC livers exhibited signs of augmented inflammation compared to controls. Enrichment of neutrophil extracellular traps (NETs), Ki-67 upregulation and decreased liver creatine significantly distinguished those with future metastasis from NED. Patients with future LiM were characterized by scant T cell lobular infiltration, less steatosis and higher levels of citrullinated H3 compared to patients who developed EHM, who had overexpression of interferon target genes (MX1 and NR1D1) and an increase of CD11B+ natural killer (NK) cells. Upregulation of sortilin-1 and prominent NETs, together with the lack of T cells and a reduction in CD11B+ NK cells, differentiated patients with early-onset LiM from those with late-onset LiM. Liver profiles of NED closely resembled those of controls. Using the above parameters, a machine-learning-based model was developed that successfully predicted the metastatic outcome at the time of surgery with 78% accuracy. Therefore, multi-parametric profiling of liver biopsies at the time of PaC diagnosis may determine metastatic risk and organotropism and guide clinical stratification for optimal treatment selection.


Conflict of interest statement

Competing interests

D.L. is on the scientific advisory board of Aufbau Holdings Ltd. R.E.S. is on the scientific advisory board of Miromatrix Inc. and Lime Therapeutics and is a speaker and consultant for Alnylam. The other authors declare no competing interests.

Figures

Extended Data Fig. 1 |
Extended Data Fig. 1 |. Gene expression patterns in the liver associated with future recurrence.
a, Immune cell gene clustering of the genes upregulated in EHM patients compared to NED (Cytoscape, ClueGO). b, Analysis of the timing of liver metastasis after resection of PaC demonstrated a pattern of an early peak of LiM, which occurred within 6 months of resection, followed by a second peak beyond 6 months.
Extended Data Fig. 2 |
Extended Data Fig. 2 |. Liver histology scoring.
a-b, Liver fibrosis, steatosis, and inflammation were scored by two blinded pathologists and compared between PaC and Non-PaC. No statistically significant differences were noted (Somer’s d test: portal inflammation, p=0.361; lobular inflammation, p=0.986; fibrosis, p= 0.695; steatosis, p=0.442).
Extended Data Fig. 3 |
Extended Data Fig. 3 |. Liver immune cell characterization.
a, Liver biopsies stained by immunofluorescence (IF) for CD68, quantified using ImageJ and compared between PaC (n=33) and Non-PaC (n=10; Mann-Whitney U-test; p=0.356). b, Liver biopsies were stained by immunohistochemistry (IHC) for the macrophage activation marker IBA-1. The percentage of stained area was quantified with ImageJ and compared between PaC (n=45) and Non-PaC (n=8; Mann-Whitney U-test; p=0.687). c Liver biopsies were co-stained by IF for CD11B, CD68, and IBA-1 to assess for overlap of these markers (n=3). d-f, Liver biopsies were co-stained by IF for CD3 and CD8 as in Fig. 2e–f. d, CD3+CD8+ T cells were quantified using ImageJ and compared between PaC (n=42) and Non-PaC (n=13; Mann-Whitney U-test; p=0.565). e, The intensity of CD8 staining and the degree of CD8+ T cell lobular infiltration in PaC livers (n=42) were assessed by a blinded pathologist and compared to non-PaC livers (n=12; Somers’ d; p=0.112 and p=0.648, respectively), f, CD3+CD8” lymphocytes were quantified using ImageJ and compared between PaC (n=42) and Non-PaC (n=13; Mann-Whitney U- test; p=0.070). MeaniSEM are shown in bar graphs.
Extended Data Fig. 4 |
Extended Data Fig. 4 |. Single cell RNA sequencing (scRNAseq) of liver immune cells.
a, Hepatic NPCs (>95% CD45+) were isolated from 3 non-PaC and 5 PaC patients and subjected to scRNAseq. A total of 33,311 cells were sequenced, with 48,294 mean reads per cell and 1,000 median genes per cell detected. The sequencing saturation was >78% for all samples, a, tSNE plot combining all samples showing clustering into 10 major cell clusters, b, Distribution of gene expression of conventional immune cell markers further defining the different cell types, c, Heatmap of top 5 genes assigning the main cell types, d, Co-expression of CD11B/ITGAM, CD68, and IBA-1/AIF1 was assessed at the gene level, revealing CD1 IB expression predominantly by the CD14+ monocyte subset of the myeloid cluster and by the NK cell subset of the lymphoid cluster, showing little co-expression with CD68 (top tSNE plot). IBA-1 was expressed by all 3 subsets of the myeloid cluster, and most CD68-expressing cells (bottom tSNE plot).
Extended Data Fig. 5 |
Extended Data Fig. 5 |. scRNAseq of liver immune cells showing altered NK cell subsets.
a, GO pathway analysis (Metascape) of the upregulated genes (upper panel) and downregulated genes (lower panel; cutoff p<0.1, after adjustment for multiple comparisons), b, Immune cell gene clustering (Cytoscape, ClueGO) of genes upregulated in CD11B+ NK cells in PaC vs non-PaC (cutoff p<0.1, after adjustment for multiple comparisons), c-e, Sub-analysis of the lymphoid cluster (corresponding to cluster 5 of Ext. Data Fig. 5a) to explore subsets of CD3-expressing lymphocytes demonstrated 7 sub-clusters (MAIT, mucosa-associated invariant T cells), c. Key defining genes are shown in d and in Figure 3i. e, The relative proportion of these subclusters was compared between PaC and Non-PaC (multiple t-tests with correction for multiple comparisons, shown if p<0.25). f, Cibersort-based deconvolution of the bulk liver mRNA sequencing data using the LM22 immune cell reference gene set for activated NK cells (PaC, n=31; Non-PaC, n=12; Mann-Whitney U-test, p=0.053, Cibersort). g Cibersort-based deconvolution of the bulk liver mRNA sequencing data using the T/NKT immune cell gene set derived in Extended Data Fig. 4 (PaC, n=30; Non-PaC, n=12; Mann-Whitney U-test, p=0.042). MeaniSEM are shown in bar graphs.
Extended Data Fig. 6 |
Extended Data Fig. 6 |. Imaging mass cytometry for characterization of CD3+ cell subsets.
Imaging mass cytometry (IMC) was performed on a tissue microarray including 2-3 cores per patient from 5 Non-PaC and 30 PaC patients, a, Representative image from a patient with LiM>6mo demonstrating the staining pattern and the spatial distribution. For calculation of lobular cell densities, portal areas (enclosed in dotted line here) were segmented and subtracted from the total cell count for each patient, b, Subsets of CD3+ cells in the entire liver section, or in the lobular areas only, were compared between PaC and non-PaC: CD3+, p=0.048 (total) and p=0.981 (lobular; Mann-Whitney U-test); CD4+, p=0.048 (total) and p=0.742 (lobular; t-test); CD8+, p=0.170 (total) and p=0.715 (lobular; Mann-Whitney U-test); NKT/yST (TCRy8+ and/or NKG2A+), p=0.477 (total) and p=0.604 (lobular; Mann-Whitney U-test); Treg (FOXP3+), p=0.727 (total) and p=0.448 (lobular; Mann-Whitney U-test). MeaniSEM are shown in bar graphs. Only p<0.25 are shown on the graphs.
Extended Data Fig. 7 |
Extended Data Fig. 7 |. Liver immune cells among recurrence groups.
a, Liver biopsies obtained at the time of resection from patients with NED, or distant recurrence (EHM, LiM>6, or LiM<6) were manually scored by a blinded pathologist for lobular inflammation (Kruskal-Wallis test), b-h, Liver biopsies were stained by IHC (b, d) or IF (c, e-h) for different immune cell markers, quantified using ImageJ and compared between the defined PaC recurrence pattern groups (ANOVA and pair-wise t-tests with multiple comparison correction by FDR; only p-values <0.25 are shown). MeaniSEM are shown in bar graphs, b, CD45+ cells (n= 22; ANOVA p=0.161). c, CD11B+ cells (n=37; ANOVA p=0.504). d, IBA1+ cells (n=38; ANOVA p=0.185). e, CD68+ cells (n=29; ANOVA p=0.544). f, CD3+ cells (n=36; ANOVA p=0.335). g, CD3+CD8+ cells (n=36; ANOVA p=0.289). h, CD3+CD8” cells (n=36; ANOVA p=0.420).
Extended Data Fig. 8 |
Extended Data Fig. 8 |. Metabolic dysregulations in the pre-metastatic liver.
a, Liver steatosis, graded at the time of resection, was examined separately among patients with LiM (LiM<6 and LiM>6), and patients without LiM (either distant EHM or isolated local recurrence) or disease-free during follow-up (NED). Patients who developed LiM had significantly less steatosis compared to those who developed recurrence at other sites (either distant EHM or isolated local recurrence) which correlated with the severity of metastatic pattern (LiM<6 being the worst and isolated local recurrence being the best prognostic group, based on overall survival outcomes [not shown]; Somer’s d test; p=0.034). b, Kaplan-Meier curve of time to LiM in patients with (n=24) or without (n=19) evidence of liver steatosis (Log-rank test). c, Top 25 metabolites correlated with creatine in the pre-metastatic liver and d, expression of metabolites in the arginine/proline pathway (PaC, n=24; Non-PaC, n=9; t- test with correction for multiple comparisons), e, Comparison of serum creatinine levels among patients who underwent liver metabolomic analysis showed no difference (PaC, n=24; Non-PaC, n=9; Mean±SEM; t-test, p=0.680). f, Top 15 metabolites separating the defined recurrence groups (EHM, n=5; LiM<6, n=5; LiM>6, n=5; NED, n=7), including creatine and g, comparison of creatine levels in all analyzed samples (ANOVA; p<0.001, FDR=0.229). Box plots represent Median±IQR, with whiskers at at 95th percentiles.
Figure 1 |
Figure 1 |. Study schema and classification into recurrence groups.
Patients with resectable pancreatic cancer (PaC; n=49) who underwent upfront resection were subjected to intraoperative liver biopsy following diagnosis (Dx). Specimens were analyzed postoperatively and patients were followed thereafter to assess for timing and pattern of recurrence (median follow-up: 36 months). Patients were classified into 4 recurrence groups: early (<6 months post resection) or late (>6 months post resection) liver metastasis (LiM), distant extrahepatic metastasis (EHM), and disease-free survivors (NED). Patients with isolated local recurrence (n=5) were classified separately and excluded from comparisons of individual recurrence groups, as described in the manuscript and summarized in the table above. Patients with benign or pre-malignant (peri-)pancreatic lesions undergoing pancreatectomy were recruited as controls and underwent similar specimen collection and analysis (Non-PaC; n=19). K-M, Kaplan-Meier.
Figure 2 |
Figure 2 |. Livers of patients with localized PaC exhibit molecular alterations with prognostic significance.
a, mRNA sequencing of liver tissue collected intraoperatively identified 79 genes differentially expressed between pancreatic cancer (PaC; n=31) and non-PaC patients (n=12; Wald test performed using the DESeq2 package with adjustment for multiple comparisons; genes shown were altered >2-fold, with adjusted p<0.1). PaC patients were classified into five mutually-exclusive recurrence groups: No evidence of disease (NED); isolated local recurrence (LR); extrahepatic metastasis (EHM); early liver metastasis (within 6 months, LiM<6); and late LiM (beyond 6 months, LiM>6). b, Enriched gene sets related to immune response in PaC livers by GSEA using the Hallmarks of Cancer reference gene set (MSigDB, H; pathways considered significant if p<0.05, FDR<0.25). The top 10 genes driving each gene set are listed, in descending order. c, Immune cell gene clustering and visualization of genes significantly upregulated in PaC livers by Cytoscape ClueGO. d, Pathway gene expression analysis of significantly upregulated genes by Metascape (cutoff p<0.1, after adjustment for multiple comparisons). e, Unsupervised clustering using the genes differentially expressed between EHM and NED patients and f, Confirmatory Ki-67 immunostaining showing upregulation in recurrence groups (n=38; Mean±SEM; Kruskal-Wallis ANOVA p=0.023, pair-wise testing with correction for multiple comparisons shown if p<0.25). g,h, SORT1 expression in recurrence groups, showing g, upregulation in LiM<6 (n=29; Mean±SEM; Kruskal-Wallis ANOVA p=0.002, pair-wise testing with correction for multiple comparisons shown if p<0.25); h, association with time to LiM (TTLiM) (n=32; log-rank test; p=0.022).
Figure 3 |
Figure 3 |. Pre-metastatic livers of PaC patients feature changes in infiltrating immune cells.
a, Liver biopsies were stained by immunofluorescence (IF) for the myeloid marker CD11B, quantified with ImageJ, and compared between PaC (n=44) and Non-PaC (n=14; Mann-Whitney U-test; p=0.005). b-c, Liver biopsies were stained by immunohistochemistry (IHC) for the macrophage activation marker IBA-1 and compared between PaC (n=47) and Non-PaC (n=9) after manual quantification by a blinded pathologist of b, the extent of IBA-1+ cell infiltration in the portal tracts (red outline; Somers’ d; p=0.001), and c, the presence of IBA-1+ cell aggregates (yellow outline) in the lobular portions of the liver parenchyma (Somers’ d; p=0.005). d, Liver biopsies were stained for neutrophil elastase (NE) and citrullinated H3 (Ct-H3) to identify clusters consistent with neutrophil extracellular traps (NETs). Stained area was quantified with ImageJ and compared between PaC (n=22) and non-PaC (n=9; Mann-Whitney U-test: NE area, p=0.016); CtH3 area, p=0.006). e-f, Liver biopsies were co-stained by IF for CD3 and CD8. e, CD3+ T cells were quantified using ImageJ and compared between PaC (n=42) and Non-PaC (n=13; t-test; p=0.008). f, A blinded pathologist quantified the intensity of CD3+ lymphocyte staining, (Somers’ d; p=0.028). g-i, Single-cell RNAseq was performed on hepatic NPCs (>90% CD45+) from 3 non-PaC and 5 PaC patients and analyzed as shown in Ext. Data Fig. 4–5. g, Comparison of the relative abundance of the major cell clusters between PaC and Non-PaC (multiple t-tests with correction for multiple comparisons, shown if p<0.25). g, The percentage of different cell clusters among CD11B+ cells was calculated and compared between PaC and non-PaC (multiple t-tests with correction for multiple comparisons, shown if p<0.25). h, Subset analysis of CD3+ cells (Ext. Data Figure 4) resulted in four T cell subclusters as well as NKT cells and two NK cell cluster (MAIT, mucosa-associated invariant T cells). i, Subset analysis of CD3+ cells resulted in four T cell subclusters as well as NKT cells and two NK cell clusters (MAIT, mucosa-associated invariant T cells). Mean±SEM are shown in bar graphs.
Figure 4 |
Figure 4 |. Alterations in pre-metastatic liver-infiltrating immune cells correlate with patterns and timing of metastasis.
a, Liver biopsies obtained at the time of resection from patients with NED, or distant recurrence (EHM, LiM>6, or LiM<6) were manually scored by a blinded pathologist for portal inflammation (Kruskal-Wallis test). b, NET area quantified as in Fig. 3d was compared among the different recurrence groups (n=21; Mean±SEM; ANOVA p=0.001; multiple t-tests with correction for multiple comparisons shown if p<0.25). c, Liver CD3+ lymphocyte lobular infiltration was manually scored by a blinded pathologist and compared among the different recurrence groups as well as between LiM and no LiM (Kruskal-Wallis test; p=0.016). d, Kaplan-Meier curve of time to LiM for high versus low NET area, as quantified in (b) (n=24; log-rank test; p=0.010). e, Kaplan-Meier curve of time to LiM for scattered versus few/widespread lobular CD3+ lymphocyte lobular infiltration, as scored in (c), with representative examples shown in side panels (log-rank test; p=0.039). f, Steatosis (absence vs presence) and CD3+ lymphocyte lobular infiltration (as in c) were used to classify PaC patients in 3 subgroups, and time to LiM was compared among them (n=42; log-rank test; p=0.010).
Figure 5 |
Figure 5 |. Metabolic features of the pre-metastatic liver correlate with patterns of recurrence in PaC.
a-c, Metabolomic analysis of liver biopsies in 24 PaC vs 9 Non-PaC patients revealed: a, creatine and creatinine to be most prominently differentially expressed using supervised clustering (p<0.001, FDR<0.15 and p<0.005, FDR<0.2, respectively); and b, enriched arginine and proline metabolism in PaC livers by metabolite set enrichment analysis (MSEA) using Metaboanalyst. c, Schematic showing the metabolism of arginine, citrulline, creatine, and creatinine, with the levels of metabolites compared between PaC (teal bars) and non-PaC (light red bars). The levels of hepatic creatine and creatinine were compared between PaC (n=24) and Non-PaC (n=9 [4 benign, 5 IPMN]; box plots represent Median±IQR, with whiskers at 95th percentiles; ANOVA p=0.007 and p=0.026, respectively). d, Negative correlation between liver creatine measured in metabolomic analysis and citrullinated H3 quantified in Fig.2e (Ct-H3; ρ=−0.6, p=0.031). e, Kaplan-Meier curve of time to LiM for patients with high vs low creatine levels (based on median; n=24; log-rank p=0.047). f-g, Total liver citrullinated H3 f, differed among recurrence groups (n=21; Mean±SEM; ANOVA p=0.023; multiple t-tests with correction for multiple comparisons shown if p<0.25) and g, associated with shorter time to LiM by Kaplan-Meier analysis (n=24; log-rank p=0.009).
Figure 6 |
Figure 6 |. Features of the PMN can be used for prediction of future metastasis.
Pre-metastatic liver-specific variables were combined in prediction models to classify patients into recurrence patterns. a, Performance of four prediction models generated using Leave-one-out with 10-fold cross-validation. b-c, The four prediction models were run concurrently (b) and their output was used to classify patients into recurrence pattern groups (c). d, Performance of the combined model. e, Summary diagram outlining stepwise comparisons of metastatic patterns, with the characteristic molecular, cellular and metabolic features favoring each pattern (fold-change is shown for continuous variables). AUC: area under the receiver operating characteristic curve.

References

    1. Siegel RL, Miller KD, Fuchs HE & Jemal A Cancer statistics, 2022. CA Cancer J. Clin. 72, 7–33 (2022). - PubMed
    1. Zambirinis CP, et al. Recurrence After Resection of Pancreatic Cancer: Can Radiomics Predict Patients at Greatest Risk of Liver Metastasis? Ann. Surg. Oncol. 29, 4962–4974 (2022). - PMC - PubMed
    1. Wangjam T, et al. Resected pancreatic ductal adenocarcinomas with recurrence limited in lung have a significantly better prognosis than those with other recurrence patterns. Oncotarget 6, 36903–36910 (2015). - PMC - PubMed
    1. Bindea G, et al. ClueGO: a Cytoscape plug-in to decipher functionally grouped gene ontology and pathway annotation networks. Bioinformatics 25, 1091–1093 (2009). - PMC - PubMed
    1. Zhou Y, et al. Metascape provides a biologist-oriented resource for the analysis of systems-level datasets. Nat Commun 10, 1523 (2019). - PMC - PubMed

Methods-only References

    1. Ibrahim J, et al. Dendritic cell populations with different concentrations of lipid regulate tolerance and immunity in mouse and human liver. Gastroenterology 143, 1061–1072 (2012). - PMC - PubMed
    1. Henning JR, et al. Dendritic cells limit fibroinflammatory injury in nonalcoholic steatohepatitis in mice. Hepatology 58, 589–602 (2013). - PMC - PubMed
    1. Sutti S & Albano E Adaptive immunity: an emerging player in the progression of NAFLD. Nature reviews. Gastroenterology & hepatology 17, 81–92 (2020). - PMC - PubMed
    1. Wang G, et al. Tumour extracellular vesicles and particles induce liver metabolic dysfunction. Nature 618, 374–382 (2023). - PMC - PubMed
    1. Di Biase S, et al. Creatine uptake regulates CD8 T cell antitumor immunity. J. Exp. Med. 216, 2869–2882 (2019). - PMC - PubMed