The genomic landscape of Ménière's disease: a path to endolymphatic hydrops
- PMID: 38943082
- PMCID: PMC11212243
- DOI: 10.1186/s12864-024-10552-3
The genomic landscape of Ménière's disease: a path to endolymphatic hydrops
Abstract
Background: Ménière's disease (MD) is a disorder of the inner ear that causes episodic bouts of severe dizziness, roaring tinnitus, and fluctuating hearing loss. To date, no targeted therapy exists. As such, we have undertaken a large whole genome sequencing study on carefully phenotyped unilateral MD patients with the goal of gene/pathway discovery and a move towards targeted intervention. This study was a retrospective review of patients with a history of Ménière's disease. Genomic DNA, acquired from saliva samples, was purified and subjected to whole genome sequencing.
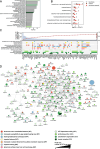
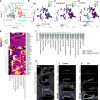
Results: Stringent variant calling, performed on 511 samples passing quality checks, followed by gene-based filtering by recurrence and proximity in molecular interaction networks, led to 481 high priority MD genes. These high priority genes, including MPHOSPH8, MYO18A, TRIOBP, OTOGL, TNC, and MYO6, were previously implicated in hearing loss, balance, and cochlear function, and were significantly enriched in common variant studies of hearing loss. Validation in an independent MD cohort confirmed 82 recurrent genes. Pathway analysis pointed to cell-cell adhesion, extracellular matrix, and cellular energy maintenance as key mediators of MD. Furthermore, the MD-prioritized genes were highly expressed in human inner ear hair cells and dark/vestibular cells, and were differentially expressed in a mouse model of hearing loss.
Conclusion: By enabling the development of model systems that may lead to targeted therapies and MD screening panels, the genes and variants identified in this study will inform diagnosis and treatment of MD.
Keywords: Gene discovery; Ménière's disease; Network analysis; Systems biology; Whole genome sequencing.
© 2024. The Author(s).
Conflict of interest statement
The authors declare no competing interests.
Figures


Similar articles
-
What is Menière's disease? A contemporary re-evaluation of endolymphatic hydrops.J Neurol. 2016 Apr;263 Suppl 1:S71-81. doi: 10.1007/s00415-015-7930-1. Epub 2016 Apr 15. J Neurol. 2016. PMID: 27083887 Free PMC article. Review.
-
Correlation between magnetic resonance imaging classification of endolymphatic hydrops and clinical manifestations and audiovestibular test results in patients with definite Ménière's disease.Auris Nasus Larynx. 2022 Feb;49(1):34-45. doi: 10.1016/j.anl.2021.03.027. Epub 2021 Apr 15. Auris Nasus Larynx. 2022. PMID: 33865653
-
Cochlear microphonics in Ménière's disease.Am J Otol. 1997 Jan;18(1):58-66. Am J Otol. 1997. PMID: 8989953
-
Gadolinium-enhanced MRI reveals dynamic development of endolymphatic hydrops in Ménière's disease.Braz J Otorhinolaryngol. 2020 Mar-Apr;86(2):165-173. doi: 10.1016/j.bjorl.2018.10.014. Epub 2018 Dec 20. Braz J Otorhinolaryngol. 2020. PMID: 30600169 Free PMC article.
-
Magnetic resonance imaging and Ménière's disease-unavoidable alliance.Neuroradiology. 2021 Nov;63(11):1749-1763. doi: 10.1007/s00234-021-02744-5. Epub 2021 Jun 17. Neuroradiology. 2021. PMID: 34142211 Review.
Cited by
-
The International Classification of Vestibular Disorders: Achievements, challenges, and future directions.J Vestib Res. 2025 May;35(3):105-112. doi: 10.1177/09574271251313803. Epub 2025 Jan 8. J Vestib Res. 2025. PMID: 39973600 Free PMC article. Review.
-
Replication of Missense OTOG Gene Variants in a Brazilian Patient with Menière's Disease.Genes (Basel). 2025 May 28;16(6):654. doi: 10.3390/genes16060654. Genes (Basel). 2025. PMID: 40565546 Free PMC article.
-
An ultra-rare missense variant in the KIF1B gene linked to autoinflammatory Menière's disease.NPJ Genom Med. 2025 May 20;10(1):42. doi: 10.1038/s41525-025-00503-6. NPJ Genom Med. 2025. PMID: 40393993 Free PMC article.
-
IL-1β promotes glutamate excitotoxicity: indications for the link between inflammatory and synaptic vesicle cycle in Ménière's disease.Cell Death Discov. 2024 Nov 20;10(1):476. doi: 10.1038/s41420-024-02246-2. Cell Death Discov. 2024. PMID: 39567494 Free PMC article.
References
-
- Tarle Y. The famous and yet little-known “principal observation of prosper Meniere” (Genesis and evolution, 1848–1861) Ann Otolaryngol. 1960;77:87–97. - PubMed
MeSH terms
LinkOut - more resources
Full Text Sources
Medical
Research Materials
Miscellaneous

