. 2024 Jun 28;22(1):602.
doi: 10.1186/s12967-024-05377-3.

Deciphering the SOX4/MAPK1 regulatory axis: a phosphoproteomic insight into IQGAP1 phosphorylation and pancreatic Cancer progression

Affiliations

Deciphering the SOX4/MAPK1 regulatory axis: a phosphoproteomic insight into IQGAP1 phosphorylation and pancreatic Cancer progression

Chao Song et al. J Transl Med. .

Abstract

Objective: This study aims to elucidate the functional role of IQGAP1 phosphorylation modification mediated by the SOX4/MAPK1 regulatory axis in developing pancreatic cancer through phosphoproteomics analysis.

Methods: Proteomics and phosphoproteomics data of pancreatic cancer were obtained from the Clinical Proteomic Tumor Analysis Consortium (CPTAC) database. Differential analysis, kinase-substrate enrichment analysis (KSEA), and independent prognosis analysis were performed on these datasets. Subtype analysis of pancreatic cancer patients was conducted based on the expression of prognostic-related proteins, and the prognosis of different subtypes was evaluated through prognosis analysis. Differential analysis of proteins in different subtypes was performed to identify differential proteins in the high-risk subtype. Clinical correlation analysis was conducted based on the expression of prognostic-related proteins, pancreatic cancer typing results, and clinical characteristics in the pancreatic cancer proteomics dataset. Functional pathway enrichment analysis was performed using GSEA/GO/KEGG, and most module proteins correlated with pancreatic cancer were selected using WGCNA analysis. In cell experiments, pancreatic cancer cells were grouped, and the expression levels of SOX4, MAPK1, and the phosphorylation level of IQGAP1 were detected by RT-qPCR and Western blot experiments. The effect of SOX4 on MAPK1 promoter transcriptional activity was assessed using a dual-luciferase assay, and the enrichment of SOX4 on the MAPK1 promoter was examined using a ChIP assay. The proliferation, migration, and invasion functions of grouped pancreatic cancer cells were assessed using CCK-8, colony formation, and Transwell assays. In animal experiments, the impact of SOX4 on tumor growth and metastasis through the regulation of MAPK1-IQGAP1 phosphorylation modification was studied by constructing subcutaneous and orthotopic pancreatic cancer xenograft models, as well as a liver metastasis model in nude mice.

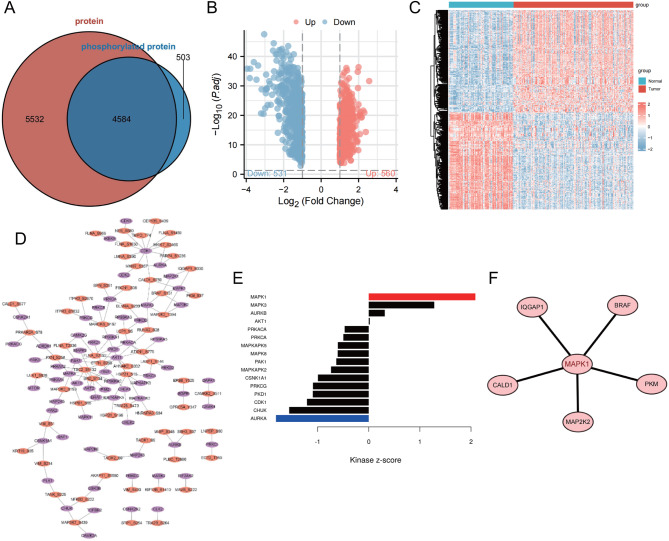
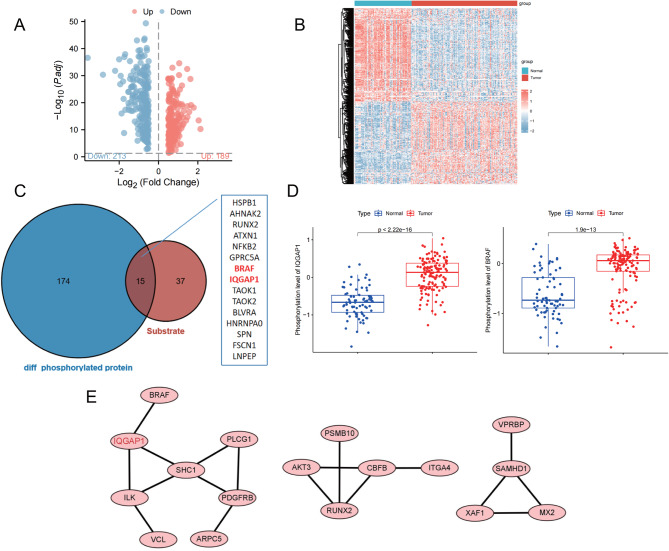
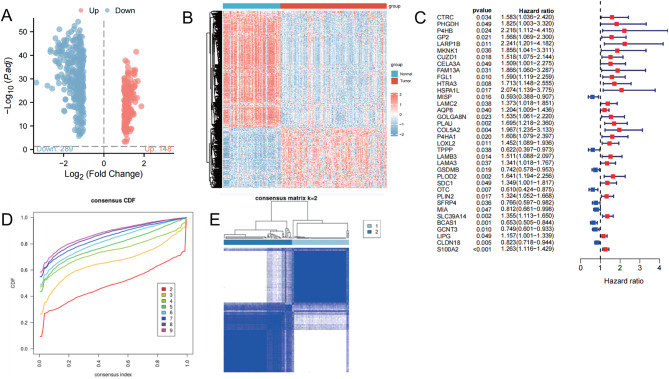
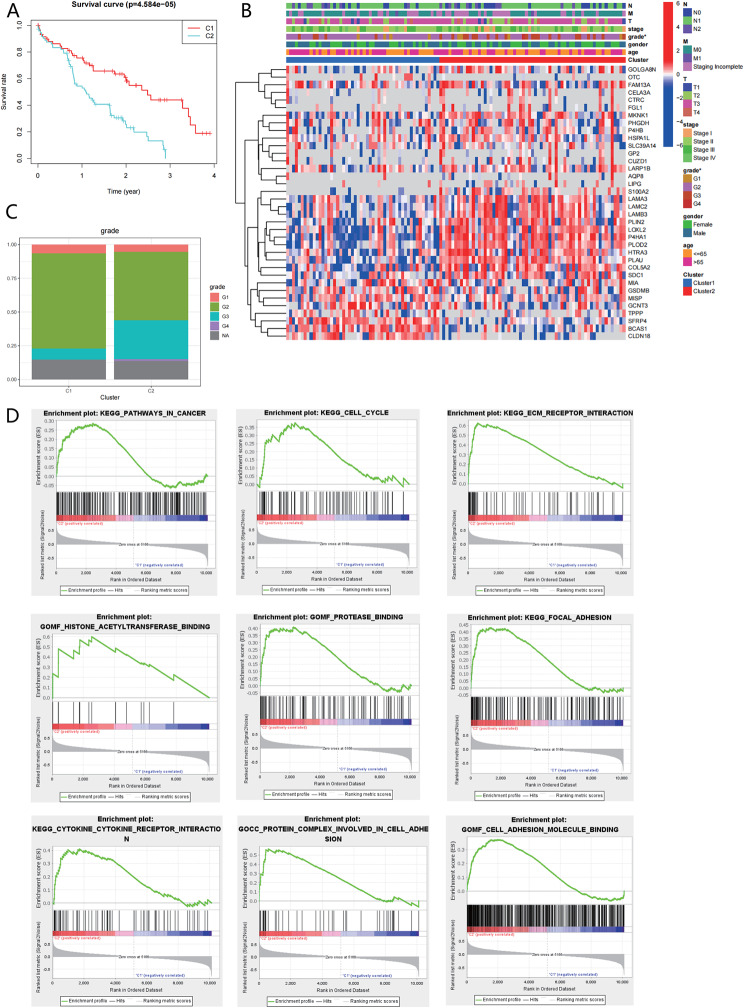
Results: Phosphoproteomics and proteomics data analysis revealed that the kinase MAPK1 may play an important role in pancreatic cancer progression by promoting IQGAP1 phosphorylation modification. Proteomics analysis classified pancreatic cancer patients into two subtypes, C1 and C2, where the high-risk C2 subtype was associated with poor prognosis, malignant tumor typing, and enriched tumor-related pathways. SOX4 may promote the occurrence of the high-risk C2 subtype of pancreatic cancer by regulating MAPK1-IQGAP1 phosphorylation modification. In vitro cell experiments confirmed that SOX4 promoted IQGAP1 phosphorylation modification by activating MAPK1 transcription while silencing SOX4 inhibited the proliferation, migration, and invasion of pancreatic cancer cells by reducing the phosphorylation level of MAPK1-IQGAP1. In vivo, animal experiments further confirmed that silencing SOX4 suppressed the growth and metastasis of pancreatic cancer by reducing the phosphorylation level of MAPK1-IQGAP1.

Conclusion: The findings of this study suggest that SOX4 promotes the phosphorylation modification of IQGAP1 by activating MAPK1 transcription, thereby facilitating the growth and metastasis of pancreatic cancer.

Keywords: IQGAP1 phosphorylation; KSEA analysis; MAPK1 kinase; Pancreatic cancer; Phosphoproteomics; SOX4; Tumor growth and metastasis; Tumor typing.


Conflict of interest statement

The authors declare that they have no competing interests.

Figures

Fig. 1
Fig. 1
Differential Analysis and KSEA analysis of phosphoproteomic data in pancreatic cancer. Note (A) Venn diagram representing the intersection between proteins and phosphorylated proteins. (B) Volcano plot showing differential phosphorylation site patterns in the dataset, with red dots indicating upregulated phosphorylation levels and blue dots indicating downregulated phosphorylation levels. (C) Heatmap of phosphorylation levels at differential peptide phosphorylation sites in the dataset, with hierarchical clustering based on phosphorylation levels on the left dendrogram, color bar on the right representing the gradient, with red indicating high phosphorylation levels, and blue indicating low phosphorylation levels. Above the histogram, red represents pancreatic cancer tissue samples (137 cases), and blue represents normal pancreatic tissue samples (74 cases). (D) Kinase-substrate network in KSEA analysis, purple representing kinases and orange representing substrates. (E) Bar graph of KSEA analysis results, with red bars representing upregulated kinases in pancreatic cancer tissue and blue bars representing downregulated kinases in pancreatic cancer tissue, while black bars represent kinases with no difference. (F) Protein-protein interaction network of the substrate corresponding to MAPK1.
Fig. 2
Fig. 2
Potential Impact of MAPK1-Mediated Phosphorylation of IQGAP1 on the Development of Pancreatic Cancer. Note (A) Volcano plot of differentially phosphorylated peptide-derived proteins in the dataset, with red dots indicating upregulated expression and blue dots indicating downregulated expression. (B) Heatmap of differential protein phosphorylation levels in the dataset, with hierarchical clustering based on protein phosphorylation levels on the left dendrogram, color bar on the right representing the gradient, with red indicating high phosphorylation levels and blue indicating low phosphorylation levels. Above the histogram, blue represents cancer tissue samples in the C1 subtype (61 cases), and red represents cancer tissue samples in the C2 subtype (73 cases). (C) Venn diagram representing the intersection between substrates and upregulated phosphorylated proteins in KSEA analysis. (D) Bar graph of BRAF and IQGAP1 protein phosphorylation levels in the dataset, with red representing pancreatic cancer tissue samples (137 cases) and blue representing normal pancreatic tissue samples (74 cases). (E) PPI network is constructed based on upregulated phosphorylated proteins
Fig. 3
Fig. 3
Subtyping of Pancreatic Cancer Patients. Note (A) Volcano plot of differential protein expression in the dataset, with red dots indicating upregulated expression and blue dots indicating downregulated expression. (B) Heatmap of differential protein expression levels in the dataset, with hierarchical clustering based on protein expression levels on the left dendrogram, color bar on the right representing the gradient, red indicating upregulated expression and blue indicating downregulated expression. Above the histogram, red represents pancreatic cancer tissue samples (137 cases), and blue represents normal pancreatic tissue samples (74 cases). (C) Forest plot of independent prognosis analysis, with blue dots representing low-risk proteins and red dots representing high-risk proteins. (D) Curve graph evaluating the subtypes of pancreatic cancer, with different colored curves representing the number of subtypes. (E) Cluster map of pancreatic cancer subtypes, with 61 cases in the C1 subtype and 73 cases in the C2 subtype, originally 137 pancreatic cancer patients, with 3 cases deleted due to missing survival information
Fig. 4
Fig. 4
Prognosis and GSEA Analysis of Pancreatic Cancer C1/C2 Subtypes. Note (A) Prognosis analysis of pancreatic cancer C1/C2 subtypes, with red representing the C1 subtype (61 cases) and blue representing the C2 subtype (73 cases). (B) Heatmap of clinical relevance with pancreatic cancer C1/C2 subtypes, with a color bar on the top indicating different clinical characteristics. The asterisk (*) indicates significance at p < 0.05. (C) Percentage of clinical grade in C1/C2 subtypes. (D) Enriched pathways in GSEA analysis for C1/C2 subtypes
Fig. 5
Fig. 5
Differential Analysis of Phosphorylated Proteins and Pathway Enrichment Analysis in Pancreatic Cancer Patients’ C1/C2 Subtypes. Note (A) Volcano plot of differentially phosphorylated proteins in pancreatic cancer patients’ C1/C2 subtypes. Red dots represent upregulated phosphorylation levels; blue dots represent downregulated phosphorylation levels; (B) Heatmap of phosphorylation levels of differentially expressed proteins in pancreatic cancer patients’ C1/C2 subtypes. The dendrogram on the left is based on protein phosphorylation levels; the color bar on the right represents the intensity of phosphorylation, with red indicating high phosphorylation levels and blue indicating low phosphorylation levels. The histogram at the top represents C1 subtype cancer tissue samples (61 cases) in blue and C2 subtype cancer tissue samples (73 cases) in red; (C) Bar chart showing the phosphorylation levels of IQGAP1 protein in pancreatic cancer patients’ C1/C2 subtypes, with blue representing C1 subtype (61 cases) and red representing C2 subtype (73 cases); (D) Network of pathway enrichment analysis for upregulated phosphorylated proteins in pancreatic cancer tissues. Red dots represent enriched pathway names, the size of the dots represents the number of enriched proteins, and the larger the dot, the greater the number of enriched proteins. Blue dots represent the enriched proteins; (E) Network of pathway enrichment analysis for upregulated phosphorylated proteins in pancreatic cancer tissues of the C2 subtype
Fig. 6
Fig. 6
Predicted molecular mechanism of SOX4-MAPK1-IQGAP1 phosphorylation modification. Note (A) Heatmap of differentially expressed tumor-related transcription factors in pancreatic cancer tissue proteomic sequencing data. The dendrogram on the left is based on protein expression levels; the color bar on the right represents the intensity of expression, with red indicating upregulated expression and blue indicating downregulated expression. The histogram at the top represents normal adjacent tissue samples (8 cases) in blue and pancreatic cancer tissue samples (8 cases) in red; (B) Venn diagram showing the intersection of 12 differentially expressed tumor-related transcription factors in pancreatic cancer tissues and proteins enriched in the turquoise module; (C) Bar chart showing the expression of SOX4, MYH11, and PDX1 proteins in pancreatic cancer tissue proteomic sequencing data, with blue representing normal adjacent tissue samples (8 cases) and red representing pancreatic cancer tissue samples (8 cases); (D) Analysis of the correlation between SOX4, MYH11, PDX1 proteins, and kinase MAPK1 in pancreatic cancer tissue proteomic sequencing data; (E) Bar chart showing the expression of SOX4 protein in pancreatic cancer-related proteomic data from the CPTAC database, with red representing pancreatic cancer tissue samples (137 cases) and blue representing normal pancreatic tissue samples (74 cases); (F) Bar chart showing the expression of SOX4 protein in pancreatic cancer patients’ C1/C2 subtypes, with blue representing C1 subtype (61 cases) and red representing C2 subtype (73 cases); (G) Prognostic analysis of pancreatic cancer patients based on the median expression of SOX4 protein, with blue representing the high expression group (67 cases) and red representing the low expression group (67 cases); (H) Predicted diagram of SOX4 involvement in the regulation of MAPK1 transcription
Fig. 7
Fig. 7
Molecular mechanism of SOX4-MAPK1-IQGAP1 phosphorylation regulation. Note (A) RT-qPCR analysis of SOX4 and MAPK1 mRNA expression levels in pancreatic cancer cells; (B) Western blot analysis of SOX4, MAPK1 protein expression levels, and IQGAP1 phosphorylation levels in pancreatic cancer cells; (C) Dual luciferase assay to assess the effect of SOX4 on MAPK1 promoter activity; (D) ChIP assay to detect the enrichment of SOX4 on the MAPK1 promoter; (E) Western blot analysis of siRNA efficiency in silencing SOX4; (F) Western blot analysis of SOX4, MAPK1 protein expression levels, and IQGAP1 phosphorylation levels in different groups of pancreatic cancer cells. *P < 0.05 compared to control group. All cell experiments were performed in triplicate
Fig. 8
Fig. 8
The impact of SOX4 on proliferation, migration, and invasion of PSN1 pancreatic cancer cells through regulation of MAPK1-IQGAP1 phosphorylation. Note (A) CCK-8 assay was performed to evaluate the proliferation of PSN1 cells in different groups; (B) Clonogenic assay was conducted to assess the colony-forming ability of PSN1 cells in different groups; (C) Transwell assay was employed to measure the migration and invasion capabilities of PSN1 cells in different groups, Scale bar = 200 μm. * indicates a difference (P < 0.05) between the two groups, and all cell experiments were repeated three times
Fig. 9
Fig. 9
The influence of SOX4 on the growth and metastasis of pancreatic cancer through regulation of MAPK1-IQGAP1 phosphorylation. Note (A) Subcutaneous tumor volume (left) and weight (right) in nude mice of different groups; (B) In situ tumor images (left) and diameter analysis (right) in nude mice of different groups; (C) Statistical analysis of the number of axillary lymph node metastases in subcutaneous transplantation tumor in different groups, LN = Lymph node; (D) Statistical analysis of the average liver metastasis number in different groups of nude mice; (E) H&E staining to detect liver metastasis in different groups of nude mice, Scale bar = 1 mm, black arrows point to the liver metastasis region; * indicates a difference (P < 0.05), with six nude mice in each group
Fig. 10
Fig. 10
Schematic diagram illustrating the molecular mechanisms by which SOX4 regulates MAPK1-IQGAP1 phosphorylation to influence pancreatic cancer growth and metastasis

References

    1. Wu Z, Huang X, Cai M, Huang P, Guan Z. Novel necroptosis-related gene signature for predicting the prognosis of pancreatic adenocarcinoma. Aging. 2022;14(2):869–91. doi: 10.18632/aging.203846. - DOI - PMC - PubMed
    1. Halbrook CJ, Lyssiotis CA, Pasca di Magliano M, Maitra A. Pancreatic cancer: advances and challenges. Cell. 2023;186(8):1729–54. doi: 10.1016/j.cell.2023.02.014. - DOI - PMC - PubMed
    1. Gan ZY, Callegari S, Cobbold SA et al. Activation mechanism of PINK1 [published correction appears in Nature. 2022;603(7903):E33]. Nature. 2022;602(7896):328–335. 10.1038/s41586-021-04340-2. - PMC - PubMed
    1. Kaiyrzhanov R, Mohammed SEM, Maroofian R, et al. Bi-allelic LETM1 variants perturb mitochondrial ion homeostasis leading to a clinical spectrum with predominant nervous system involvement. Am J Hum Genet. 2022;109(9):1692–712. doi: 10.1016/j.ajhg.2022.07.007. - DOI - PMC - PubMed
    1. Sun M, Ge S, Li Z. The Role of Phosphorylation and Acylation in the Regulation of Drug Resistance in Mycobacterium tuberculosis. Biomedicines. 2022;10(10):2592. Published 2022 Oct 15. 10.3390/biomedicines10102592. - PMC - PubMed

MeSH terms

Substances