

Driving gut microbiota enterotypes through host genetics
- PMID: 38943206
- PMCID: PMC11214205
- DOI: 10.1186/s40168-024-01827-8
Driving gut microbiota enterotypes through host genetics
Abstract
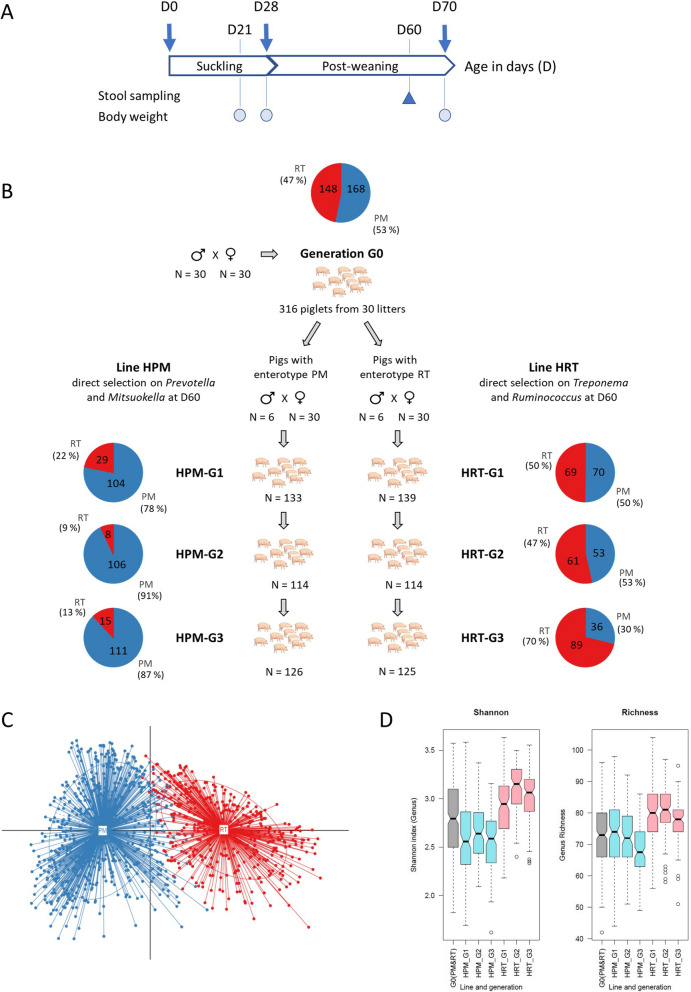
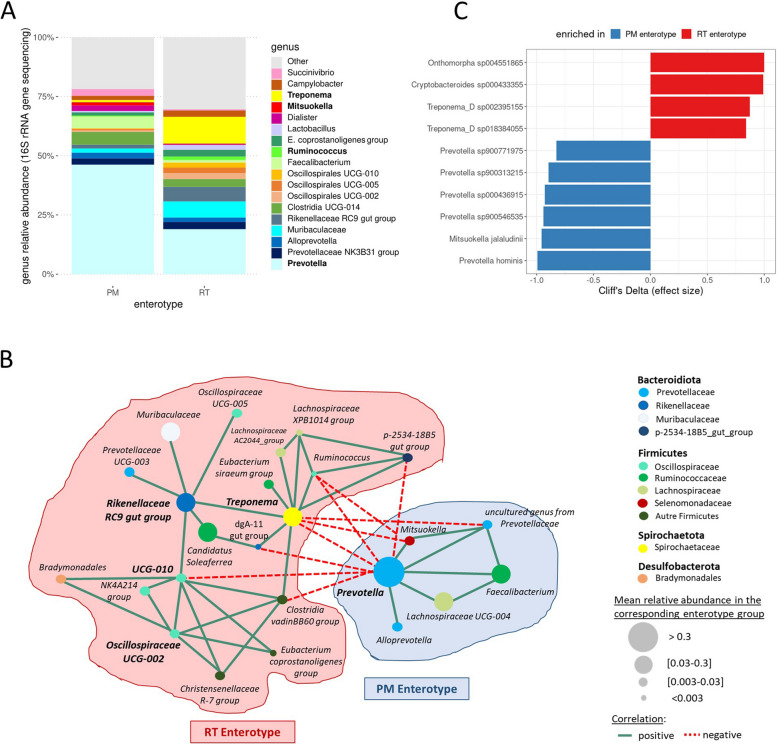
Background: Population stratification based on interindividual variability in gut microbiota composition has revealed the existence of several ecotypes named enterotypes in humans and various animal species. Enterotypes are often associated with environmental factors including diet, but knowledge of the role of host genetics remains scarce. Moreover, enterotypes harbor functionalities likely associated with varying abilities and susceptibilities of their host. Previously, we showed that under controlled conditions, 60-day-old pig populations consistently split into two enterotypes with either Prevotella and Mitsuokella (PM enterotype) or Ruminococcus and Treponema (RT enterotype) as keystone taxa. Here, our aim was to rely on pig as a model to study the influence of host genetics to assemble enterotypes, and to provide clues on enterotype functional differences and their links with growth traits.
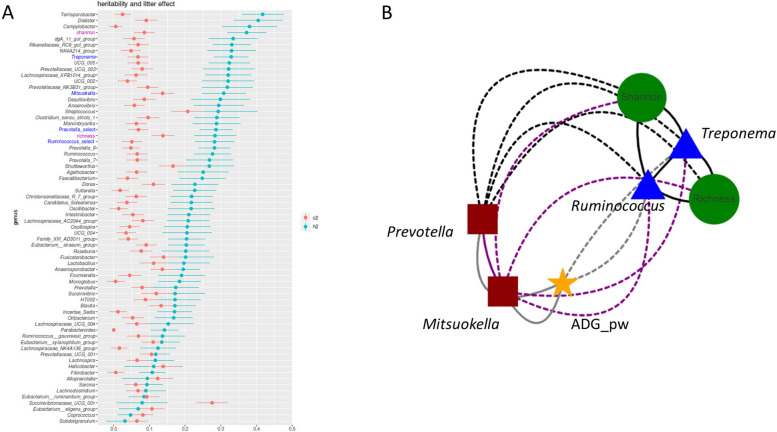
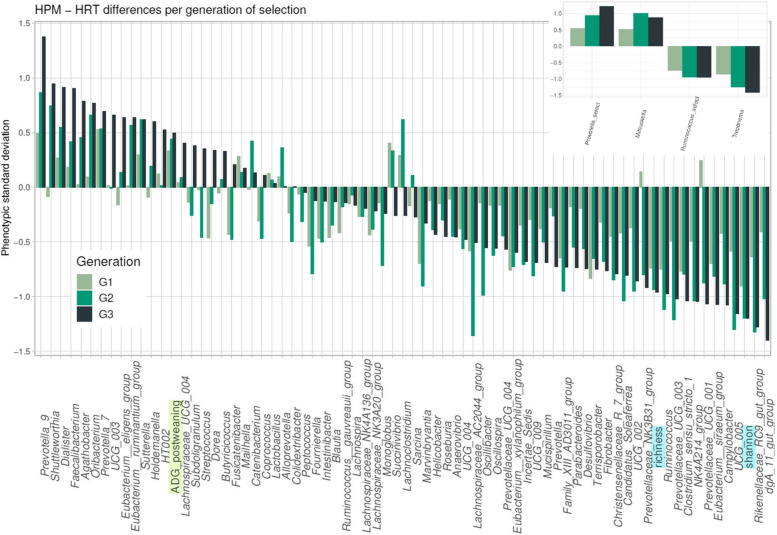
Results: We established two pig lines contrasted for abundances of the genera pairs specifying each enterotype at 60 days of age and assessed them for fecal microbiota composition and growth throughout three consecutive generations. Response to selection across three generations revealed, per line, an increase in the prevalence of the selected enterotype and in the average relative abundances of directly and indirectly selected bacterial genera. The PM enterotype was found less diverse than the RT enterotype but more efficient for piglet growth during the post-weaning period. Shotgun metagenomics revealed differentially abundant bacterial species between the two enterotypes. By using the KEGG Orthology database, we show that functions related to starch degradation and polysaccharide metabolism are enriched in the PM enterotype, whereas functions related to general nucleoside transport and peptide/nickel transport are enriched in the RT enterotype. Our results also suggest that the PM and RT enterotypes might differ in the metabolism of valine, leucin, and isoleucine, favoring their biosynthesis and degradation, respectively.
Conclusion: We experimentally demonstrated that enterotypes are functional ecosystems that can be selected as a whole by exerting pressure on the host genetics. We also highlight that holobionts should be considered as units of selection in breeding programs. These results pave the way for a holistic use of host genetics, microbiota diversity, and enterotype functionalities to understand holobiont shaping and adaptation. Video Abstract.
Keywords: Enterotype; Genetic selection; Genetics; Gut microbiota; Heritability; Holobiont; Metagenomics; Pig.
© 2024. The Author(s).
Conflict of interest statement
The authors declare no competing interests.
Figures
References
-
- Theis KR, Dheilly NM, Klassen JL, Brucker RM, Baines JF, Bosch TCG, Cryan JF, Gilbert SF, Goodnight CJ, Lloyd EA, Sapp J, Vandenkoornhuyse P, Zilber-Rosenberg I, Rosenberg E, Bordenstein SR. Getting the hologenome concept right: an eco-evolutionary framework for hosts and their microbiomes. mSystems. 2016;1:e00028–e116. doi: 10.1128/mSystems.00028-16. - DOI - PMC - PubMed
MeSH terms
Grants and funding
- Enterotypig/Institut National de Recherche pour l'Agriculture, l'Alimentation et l'Environnement
- Enterotypig/Institut National de Recherche pour l'Agriculture, l'Alimentation et l'Environnement
- Enterotypig/Institut National de Recherche pour l'Agriculture, l'Alimentation et l'Environnement
- Enterotypig/Institut National de Recherche pour l'Agriculture, l'Alimentation et l'Environnement
- Enterotypig/Institut National de Recherche pour l'Agriculture, l'Alimentation et l'Environnement
- Enterotypig/Institut National de Recherche pour l'Agriculture, l'Alimentation et l'Environnement
- Enterotypig/Institut National de Recherche pour l'Agriculture, l'Alimentation et l'Environnement
- Enterotypig/Institut National de Recherche pour l'Agriculture, l'Alimentation et l'Environnement
- Enterotypig/Institut National de Recherche pour l'Agriculture, l'Alimentation et l'Environnement
- Enterotypig/Institut National de Recherche pour l'Agriculture, l'Alimentation et l'Environnement
- Enterotypig/Institut National de Recherche pour l'Agriculture, l'Alimentation et l'Environnement
- Enterotypig/Institut National de Recherche pour l'Agriculture, l'Alimentation et l'Environnement
- Enterotypig/Institut National de Recherche pour l'Agriculture, l'Alimentation et l'Environnement
- ANR-11-DPBS-0001/Agence Nationale de la Recherche
- ANR-11-DPBS-0001/Agence Nationale de la Recherche
- ANR-11-DPBS-0001/Agence Nationale de la Recherche
- ANR-11-DPBS-0001/Agence Nationale de la Recherche
LinkOut - more resources
Full Text Sources
Medical
