

Metataxonomic and metabolomic profiling revealed Pinus koraiensis cone essential oil reduced methane emission through affecting ruminal microbial interactions and host-microbial metabolism
- PMID: 38943213
- PMCID: PMC11212255
- DOI: 10.1186/s42523-024-00325-4
Metataxonomic and metabolomic profiling revealed Pinus koraiensis cone essential oil reduced methane emission through affecting ruminal microbial interactions and host-microbial metabolism
Abstract
Background: Pinus koraiensis cone essential oil (PEO) contains functional compounds such as monoterpene hydrocarbons, and the administration of PEO reduced methane (CH4) emissions during growing phase of goats. However, the mode of action of PEO driven CH4 reduction is not known, especially how the administration of PEO can affect rumen microbiota and host metabolism in goats during the fattening phase. This study aimed to elucidate the potential microbial and host responses PEO supplementation in goats using metataxonomics (prokaryotes and protozoa) and metabolomics (rumen fluid and serum).
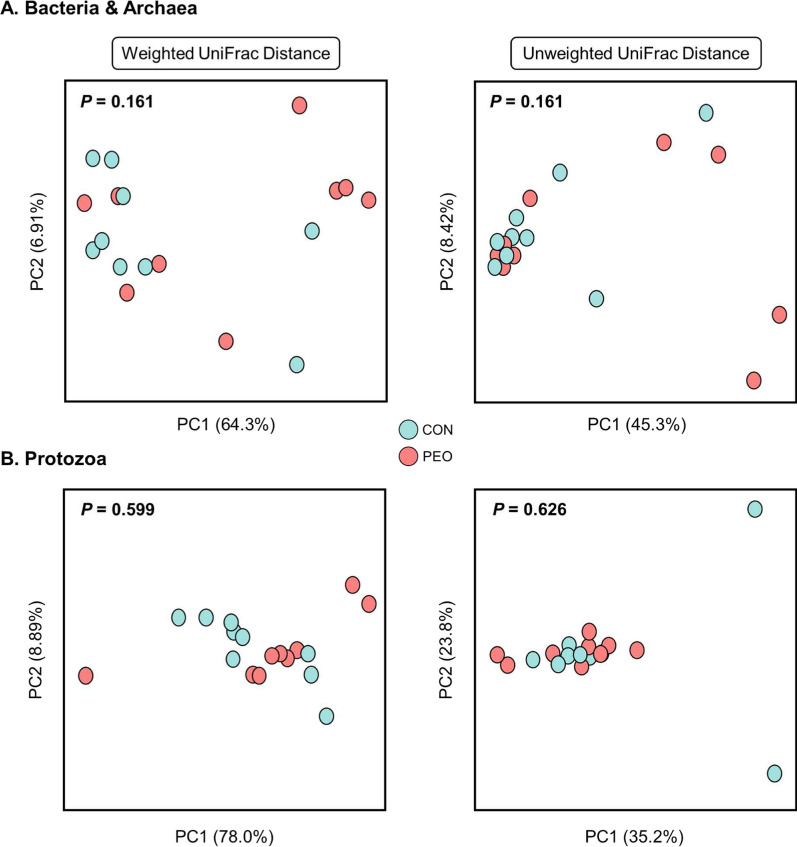
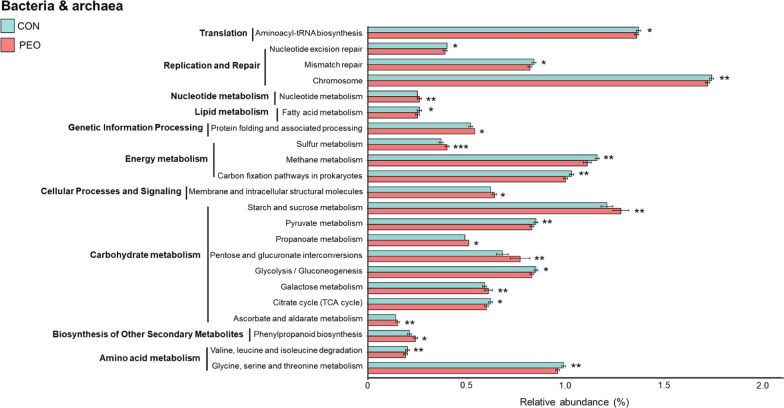
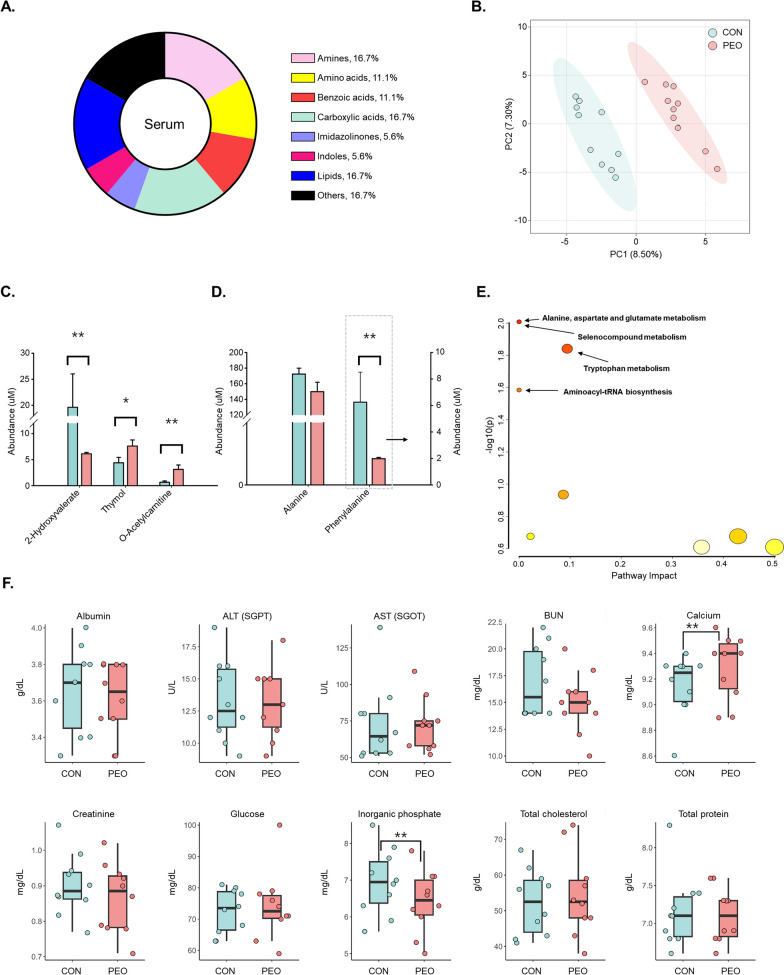
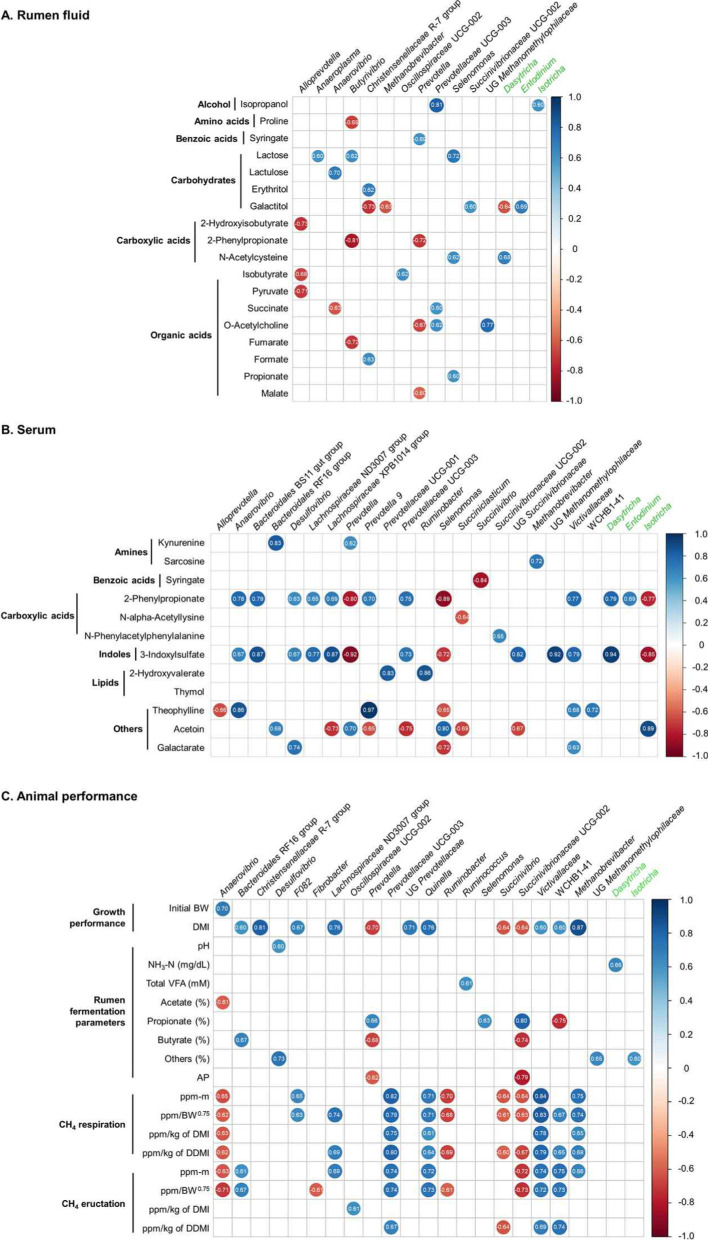
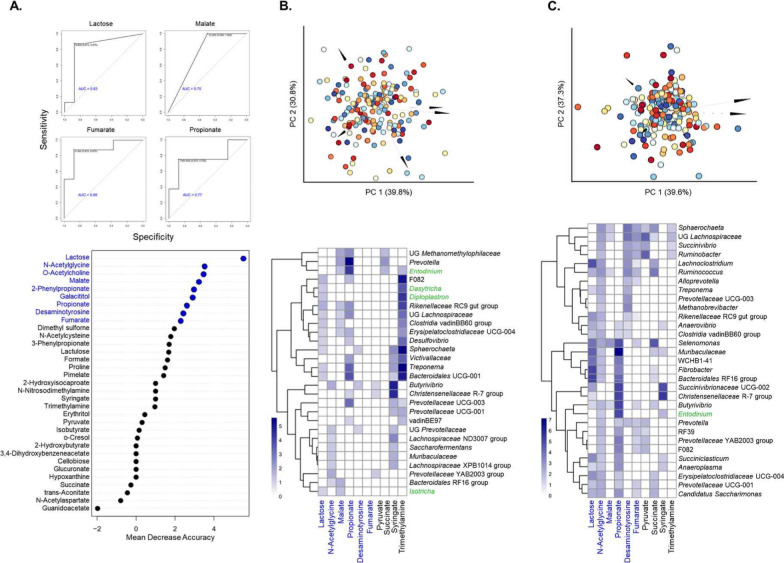
Results: Ten fattening Korean native goats were divided into two dietary groups: control (CON; basal diet without additives) and PEO (basal diet + 1.5 g/d of PEO) with a 2 × 2 crossover design and the treatment lasted for 11 weeks. Administration of PEO reduced CH4 concentrations in the exhaled gas from eructation by 12.0-13.6% (P < 0.05). Although the microbial composition of prokaryotes (bacteria and archaea) and protozoa in the rumen was not altered after PEO administration. MaAsLin2 analysis revealed that the abundance of Selenomonas, Christensenellaceae R-7 group, and Anaerovibrio were enriched in the rumen of PEO supplemented goats (Q < 0.1). Co-occurrence network analysis revealed that Lachnospiraceae AC2044 group and Anaerovibrio were the keystone taxa in the CON and PEO groups, respectively. Methane metabolism (P < 0.05) was enriched in the CON group, whereas metabolism of sulfur (P < 0.001) and propionate (P < 0.1) were enriched in the PEO group based on microbial predicted functions. After PEO administration, the abundance of 11 rumen and 4 serum metabolites increased, whereas that of 25 rumen and 14 serum metabolites decreased (P < 0.1). Random forest analysis identified eight ruminal metabolites that were altered after PEO administration, among which four were associated with propionate production, with predictive accuracy ranging from 0.75 to 0.88. Additionally, we found that serum sarcosine (serum metabolite) was positively correlated with CH4 emission parameters and abundance of Methanobrevibacter in the rumen (|r|≥ 0.5, P < 0.05).
Conclusions: This study revealed that PEO administration reduced CH4 emission from of fattening goats with altered microbial interactions and metabolites in the rumen and host. Importantly, PEO administration affected utilizes various mechanisms such as formate, sulfur, methylated amines metabolism, and propionate production, collectively leading to CH4 reduction. The knowledge is important for future management strategies to maintain animal production and health while mitigate CH4 emission.
Keywords: Enteric methane emission; Essential oil; Goat; Metabolomics; Metataxonomics.
© 2024. The Author(s).
Conflict of interest statement
The authors declare that the research was conducted in the absence of any commercial or financial relationships that could be construed as a potential conflict of interest.
Figures


Similar articles
-
Oral administration of Pinus koraiensis cone essential oil reduces rumen methane emission by altering the rumen microbial composition and functions in Korean native goat (Capra hircus coreanae).Front Vet Sci. 2023 May 18;10:1168237. doi: 10.3389/fvets.2023.1168237. eCollection 2023. Front Vet Sci. 2023. PMID: 37275608 Free PMC article.
-
Corn oil supplementation enhances hydrogen use for biohydrogenation, inhibits methanogenesis, and alters fermentation pathways and the microbial community in the rumen of goats.J Anim Sci. 2019 Dec 17;97(12):4999-5008. doi: 10.1093/jas/skz352. J Anim Sci. 2019. PMID: 31740932 Free PMC article.
-
Linseed oil and DGAT1 K232A polymorphism: Effects on methane emission, energy and nitrogen metabolism, lactation performance, ruminal fermentation, and rumen microbial composition of Holstein-Friesian cows.J Dairy Sci. 2017 Nov;100(11):8939-8957. doi: 10.3168/jds.2016-12367. Epub 2017 Sep 13. J Dairy Sci. 2017. PMID: 28918153
-
Bacillus subtilis and Macleaya cordata extract regulate the rumen microbiota associated with enteric methane emission in dairy cows.Microbiome. 2023 Oct 19;11(1):229. doi: 10.1186/s40168-023-01654-3. Microbiome. 2023. PMID: 37858227 Free PMC article.
-
Review: Diving into the cow hologenome to reduce methane emissions and increase sustainability.Animal. 2023 Jun;17 Suppl 2:100780. doi: 10.1016/j.animal.2023.100780. Epub 2023 Mar 17. Animal. 2023. PMID: 37032282 Review.
References
-
- OECD/FAO. OECD-FAO agricultural outlook 2020–2029. Oecd. 2020
-
- CCAC U. United nations environment programme and climate and clean air coalition. Global Methane Assessment: Benefits and Costs of Mitigating Methane Emissions Nairobi: United Nations Environment Programme. 2021
Grants and funding
- PJ01477803/National Institute of Animal Science, Ministry of Rural Development Administration
- PJ01477803/National Institute of Animal Science, Ministry of Rural Development Administration
- PJ01477803/National Institute of Animal Science, Ministry of Rural Development Administration
- PJ01477803/National Institute of Animal Science, Ministry of Rural Development Administration
LinkOut - more resources
Full Text Sources