. 2024 Jun 28;12(1):18.
doi: 10.1186/s40170-024-00345-3.

Sulfatide imaging identifies tumor cells in colorectal cancer peritoneal metastases

Affiliations

Sulfatide imaging identifies tumor cells in colorectal cancer peritoneal metastases

G M Sarcinelli et al. Cancer Metab. .

Abstract

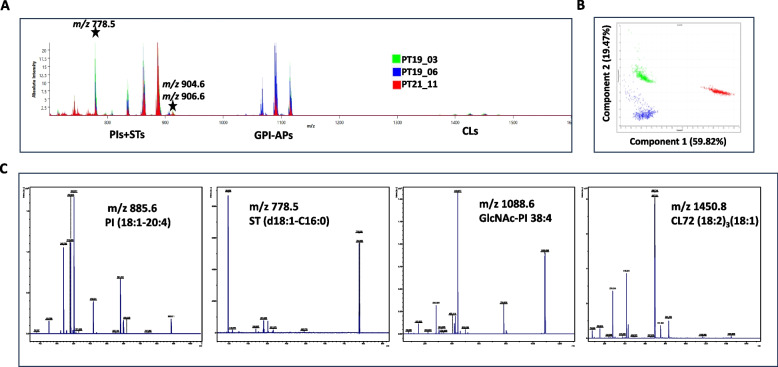
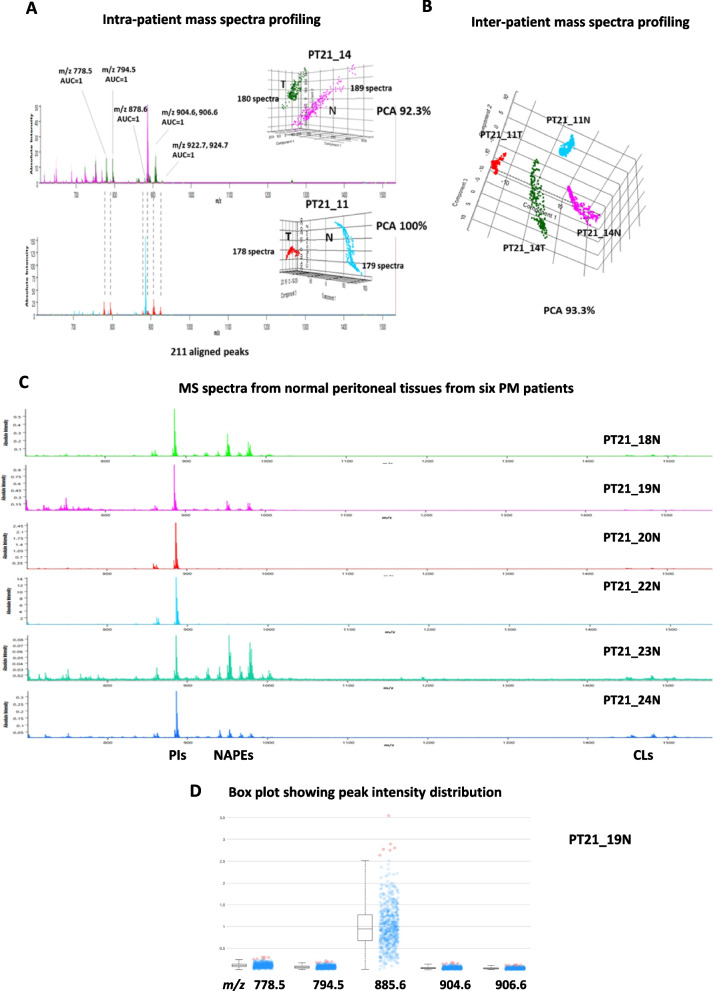
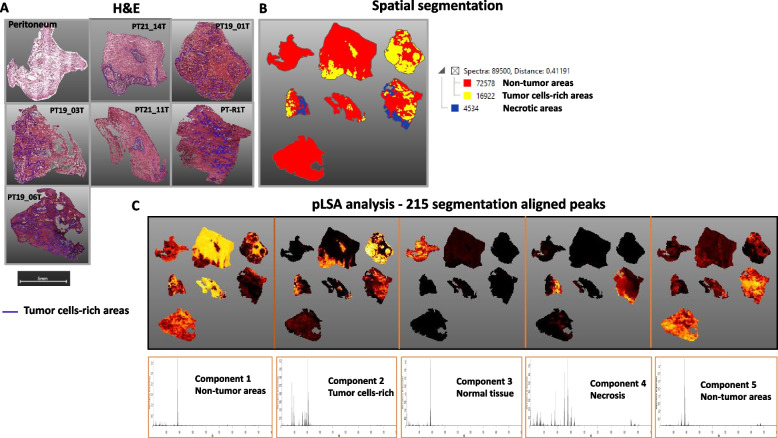
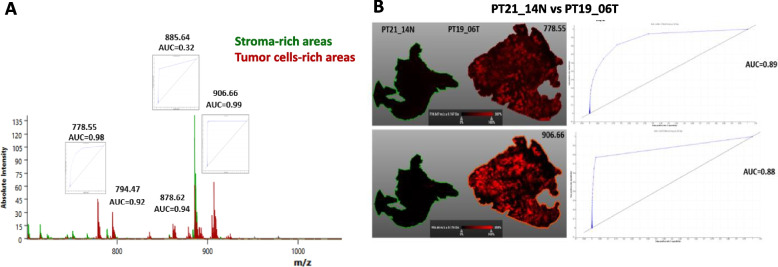
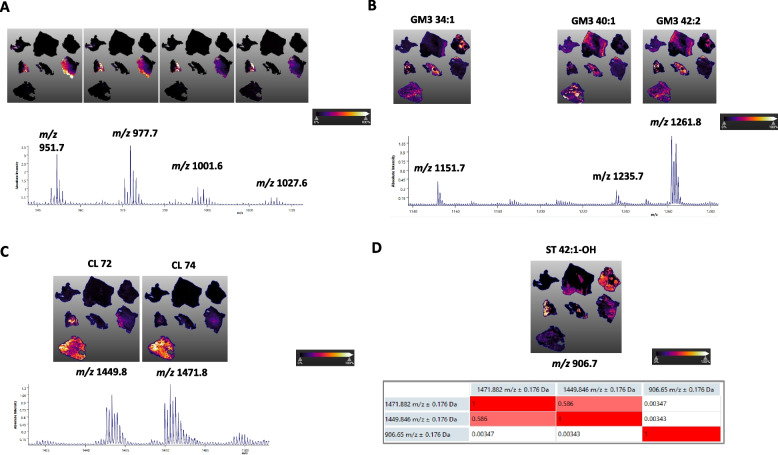
Even with systemic chemotherapy, cytoreductive surgery (CRS), and hyperthermic intraperitoneal chemotherapy (HIPEC), peritoneal metastases (PM) remain a common site of disease progression for colorectal cancer (CRC) and are frequently associated with a poor prognosis. The mass spectrometry (MS) method known as Matrix-Assisted Laser Desorption/Ionization - Time of Flight (MALDI-TOF) is frequently used in medicine to identify structural compounds and biomarkers. It has been demonstrated that lipids are crucial in mediating the aggressive growth of tumors. In order to investigate the lipid profiles, particularly with regard to histological distribution, we used MALDI-TOF MS (MALDI-MS) and MALDI-TOF imaging MS (MALDI-IMS) on patient-derived tumor organoids (PDOs) and PM clinical samples. According to the MALDI-IMS research shown here, the predominant lipid signature of PDOs in PM tissues, glycosphingolipid (GSL) sulfates or sulfatides, or STs, is unique to the areas containing tumor cells and absent from the surrounding stromal compartments. Bioactive lipids are derived from arachidonic acid (AA), and AA-containing phosphatidylinositol (PI), or PI (18:0-20:4), is shown to be highly expressed in the stromal components. On the other hand, the tumor components contained a higher abundance of PI species with shorter and more saturated acyl chains (C34 and C36 carbons). The cellular subversion of PI and ST species may alter in ways that promote the growth, aggressiveness, and metastasis of tumor cells. Together, these findings suggest that the GSL/ST metabolic programming of PM may contain novel therapeutic targets to impede or halt PM progression.

Keywords: Lipid; MALDI-imaging; Organoids; Peritoneal carcinomatosis; Sulfatide.


Conflict of interest statement

The authors declare no competing interests.

Figures

Fig. 1
Fig. 1
Negative ion mode MALDI-MS analysis of the lipid extracts of three PDO cell lines derived from PT19_03, PT19_06 and PT21_11 patients. A Lipid profiles acquired in negative ion mode by automatic acquisition. Lipid species can be grouped in two main ranges: the m/z range 700–900, where GPL and GPS species are present, and the m/z range 1100–1500, where minor peaks compatible with GSLs and CLs species are visible. B Two-dimensional principal component analysis (2D PCA) scores plot of the individual PDO cumulated spectra (525, 483 and 462, respectively) using 131 aligned peaks. Two principal components (PC) explained 79.28% of the variance of the data. In (C), we show the fragmentation pattern of ions with m/z 885.6, 778.5, 1088.5, and 1450 obtained by MS/MS analysis. m/z 885.6 corresponding to PI 38:4 was fragmented into the characteristic product ions with m/z 419.2, 283.1, and 240.8; m/z 778.5 was fragmented into ions with m/z 96.9 (hydrogen sulfate ion), m/z 258.7 (dehydrogenated galactose-sulfate) and m/z 240.7 (dehydrated galactose-sulfate), ions known to be representative signals of the ST head group and corresponding to ST d18:1-C16:0. The m/z 1088.6 ion corresponding to the GlcNAc-PI 38:4 species [15] was fragmented into product ions with m/z 443.9 (GlcNAc-myo-inositol-1,2-cyclic phosphate) and its dehydration product at m/z 425.7. These two ions are characteristic of the negative ion GlcNAc-PI spectra. Peaks at m/z 78.7, 152.7, and 282.9 are (phosphate), (glycerol-cyclic phosphate), and (stearate), respectively. m/z 1450.8 was fragmented into product ions with m/z 831.7, 751.7, 695.6, 697.6, 415.2, 417.5, 281, and 279 typical fragments of CL72:7, with the most intense peaks corresponding to linoleate (m/z 279), monoacylglycerol phosphatidate (m/z 415.2), and diacylglycerol phosphatidate (m/z 695.6)
Fig. 2
Fig. 2
MALDI-MS analysis of PM vs matched healthy peritoneum from PT21_11 and PT21_14 patients. A Intra-patient mass spectra peaks of PM lesion vs healthy peritoneum with the AUC values of the most discriminative peaks. B 3-dimensional plot of PCA scores of inter-patient mass spectra peaks originating from healthy peritoneum and tumor tissue. A percentage explaining the variance between samples is shown. C MS spectra from normal peritoneal tissues from six PM patients. D The peak intensities distributions in solubilized PT21_19N tissue are depicted through box plots that match m/z values of certain STs (778.5, 794.5, 904.6, 906.6) and PI 38:4 (885.6)
Fig. 3
Fig. 3
MALDI-IMS of tissue sections. A Sections from a normal peritoneum and PM lesions from six patients, stained with H&E for sections overlapping with the MALDI-IMS image. Blu lines surround tumor cells-rich areas (annotated by the reference pathologists). B Segmentation map analysis of MALDI-IMS spectral data. Assigned areas per spectral similarity are indicated with color generated by bisecting k-means clustering based on 215-aligned peaks and dendrogram with the respective correlation distances (numbers) representing non tumor cells-rich areas (in red), tumor cells-rich areas (in yellow) and necrotic areas (in blue). C Unsupervised multivariate analysis and correlation with sections’ regions. The unsupervised multivariate analysis was performed on the single pixels using pLSA based on 215-aligned peaks with deterministic initialization algorithm; week denoising and TIC normalization were performed
Fig. 4
Fig. 4
Univariate analysis of MALDI-IMS data determining single lipids is the most discriminative between stroma-rich and tumor cells-rich areas. A ROC analysis (AUC values) testing the power of ST-related peaks to distinguish between normal peritoneum tissue or regions rich in stroma and areas rich in tumor cells. Note it is shown a portion of the spectrum containing 215-aligned peaks that was used for automatic segmentation showed in Fig. 3. B STs discriminate between PT19_06 (PM sample) and normal peritoneum. PT19_06 shows discriminant STs (d18:1-C16:0 and d18:1-C24:0-OH) ion intensity when compared to normal peritoneum
Fig. 5
Fig. 5
Spatial localization of selected lipid species. A NAPEs distributions in necrotic areas (N); B GGs-distributions in stroma areas; and CL72 and CL74 distributions in C together with their inverse correlation with ST 42:1-OH (at 906.7, ST(d18:1-C24:0-OH)) in D
Fig. 6
Fig. 6
PT-R1T tissue section images showing the QuPath markup image. A Images correspond to H&E-stained section; B-E optical and ion images showing the spatial distribution of PI 38:4 and ST 42:1-OH. Red mask indicates tumor cells-rich areas annotated by the pathologist using QuPath. Representative spectra for PI 38:4-rich areas and ST 42:1-OH-rich areas are shown. Ions corresponding to different STs and PI38:4 are indicated by asterisks

References

    1. Baratti D, Kusamura S, Pietrantonio F, Guaglio M, Niger M, Deraco M. Progress in treatments for colorectal cancer peritoneal metastases during the years 2010–2015. A systematic review. Crit Rev Oncol Hematol. 2016;100:209–22. 10.1016/j.critrevonc.2016.01.017 - DOI - PubMed
    1. Bowman AP, Bogie JFJ, Hendriks JJA, Haidar M, Belov M, Heeren RMA, et al. Evaluation of lipid coverage and high spatial resolution MALDI-imaging capabilities of oversampling combined with laser post-ionisation. Anal Bioanal Chem. 2020;412(10):2277–89. 10.1007/s00216-019-02290-3 - DOI - PMC - PubMed
    1. Bozzi F, Mogavero A, Varinelli L, Belfiore A, Manenti G, Caccia C, et al. MIF/CD74 axis is a target for novel therapies in colon carcinomatosis. J Exp Clin Cancer Res. 2017;36(1):16. 10.1186/s13046-016-0475-z - DOI - PMC - PubMed
    1. Breil C, Abert Vian M, Zemb T, Kunz W, Chemat F. “Bligh and Dyer” and Folch methods for solid-liquid-liquid extraction of lipids from microorganisms comprehension of Solvatation. mechanisms and towards substitution with alternative solvents. Int J Mol Sci. 2017;18(4):708. 10.3390/ijms18040708 - DOI - PMC - PubMed
    1. Buschard K, Antvorskov JC. The C24:0 sulfatide isoform as an important molecule in type 1 diabetes. Front Biosci (Landmark Ed). 2022;27(12):331. 10.31083/j.fbl2712331 - DOI - PubMed