. 2024 Aug 12;52(14):8100-8111.
doi: 10.1093/nar/gkae552.

Assessing the impact of transcriptomics data analysis pipelines on downstream functional enrichment results

Affiliations

Assessing the impact of transcriptomics data analysis pipelines on downstream functional enrichment results

Victor Paton et al. Nucleic Acids Res. .

Abstract

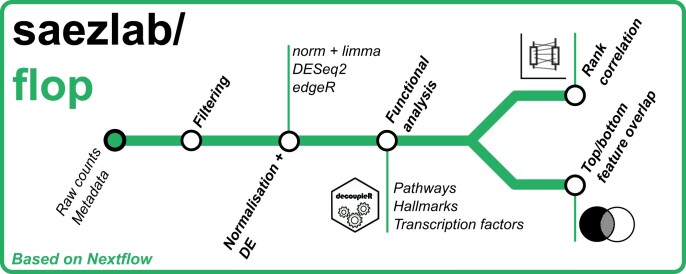
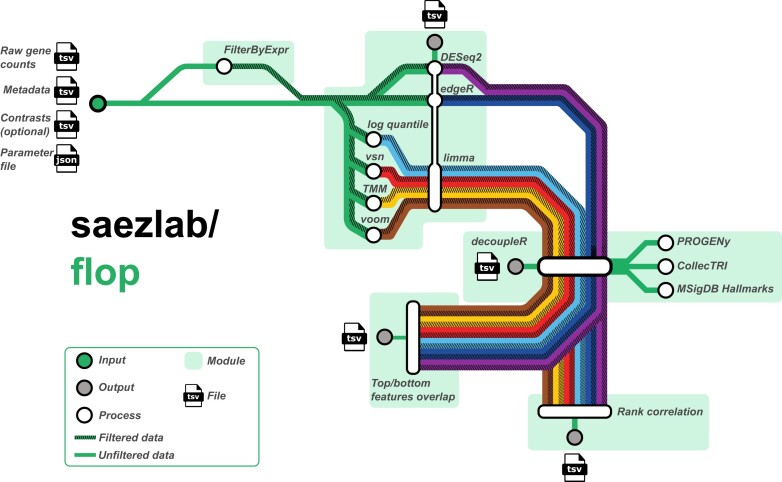
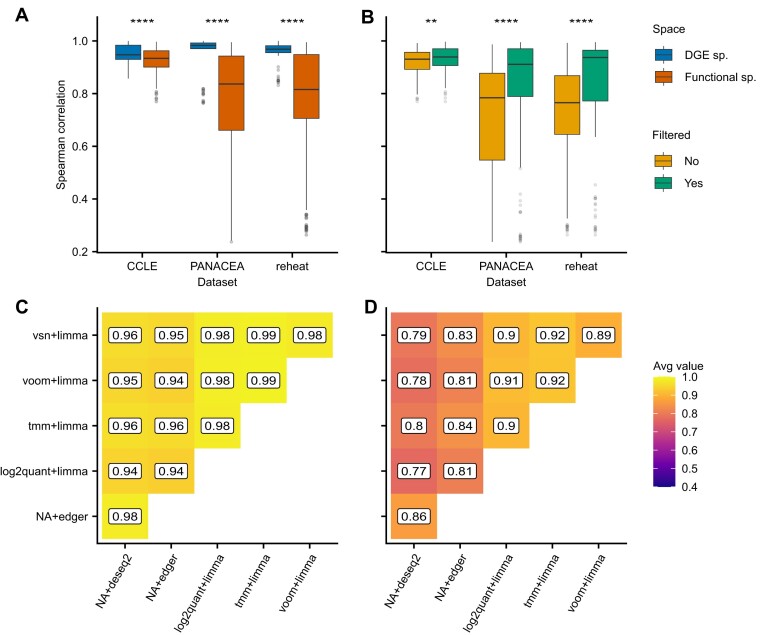
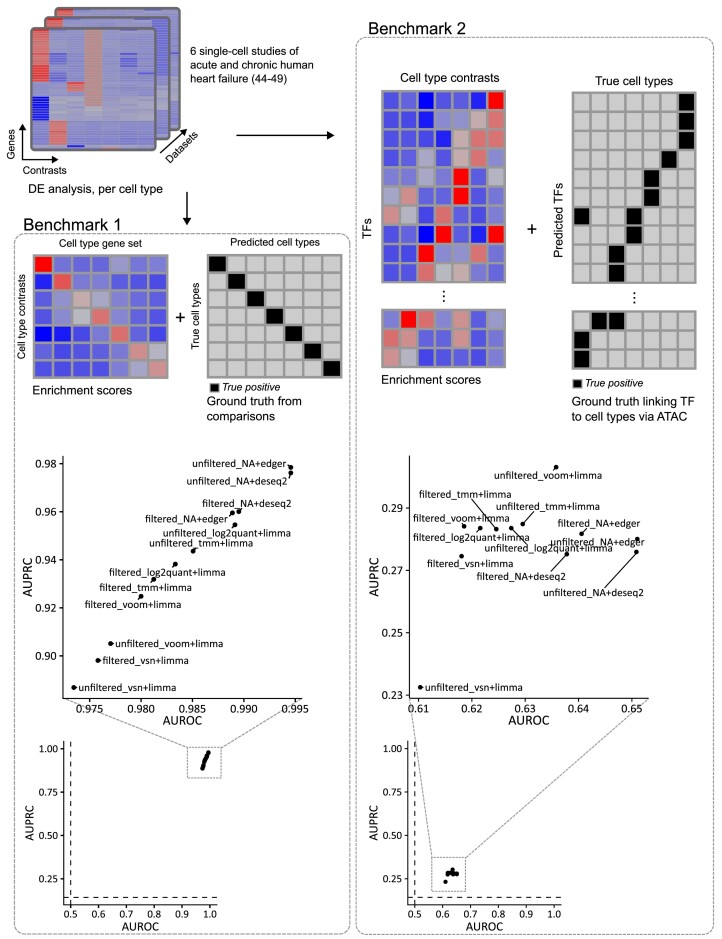
Transcriptomics is widely used to assess the state of biological systems. There are many tools for the different steps, such as normalization, differential expression, and enrichment. While numerous studies have examined the impact of method choices on differential expression results, little attention has been paid to their effects on further downstream functional analysis, which typically provides the basis for interpretation and follow-up experiments. To address this, we introduce FLOP, a comprehensive nextflow-based workflow combining methods to perform end-to-end analyses of transcriptomics data. We illustrate FLOP on datasets ranging from end-stage heart failure patients to cancer cell lines. We discovered effects not noticeable at the gene-level, and observed that not filtering the data had the highest impact on the correlation between pipelines in the gene set space. Moreover, we performed three benchmarks to evaluate the 12 pipelines included in FLOP, and confirmed that filtering is essential in scenarios of expected moderate-to-low biological signal. Overall, our results underscore the impact of carefully evaluating the consequences of the choice of preprocessing methods on downstream enrichment analyses. We envision FLOP as a valuable tool to measure the robustness of functional analyses, ultimately leading to more reliable and conclusive biological findings.


Figures

Graphical Abstract
Graphical Abstract
Figure 1.
Figure 1.
Schematic representation of FLOP methods and modules. From transcript counts and metadata, it uses several differential expression analysis frameworks, performs enrichment analysis and then evaluates the differences in the results via two different metrics.
Figure 2.
Figure 2.
(A) Average Spearman rank correlation values across pipeline pairs, per dataset, for both DE and Functional spaces. (B) Average Spearman rank correlation values between filtered or unfiltered pipelines versus the rest, per dataset. (C) Average Spearman correlation values between filtered pipelines. (D) Average similarity scores between filtered pipelines. Statistical analysis was performed via one-tailed Wilcoxon tests for the indicated pairs in panels A and B. P-value equivalence: ns: P > 0.05, *P ⇐ 0.05, **P ⇐ 0.01, ***P ⇐ 0.001, ****P ⇐ 0.0001. Sd stands for standard deviation in correlation values, sp. stands for space.
Figure 3.
Figure 3.
Evaluation strategies using end-stage heart failure transcriptomic studies (44–49). In the first benchmark (left), DGE data from 7 cell types were enriched in cell-type-specific gene sets and compared against the true cell type used to generate the DGE data. In the second benchmark (right), the cell types were linked to TFs via chromatin accessibility data, and then used as ground truth against TF enrichment scores from DGE data. Below, the scatter plots show AUROC/AUPRC values per pipeline, showing the results of the benchmarks based on end-stage heart failure transcriptomic studies. The left plot shows results using cell-type specific gene sets (Benchmark 1), while the right plot shows results using TF enrichment scores linked to cell types (Benchmark 2). Dashed lines show baseline values for AUROC (0.5) and AUPRC (0.143).
Figure 4.
Figure 4.
Evaluation strategy using cytokine-perturbed transcriptomic data for different immune cell types (50). DGE data from 86 cytokine treatments and 17 cell types were enriched in MSigDB hallmarks gene sets. The ground truth was generated by linking cytokines to MSigDB hallmarks and compared against the enrichment scores for the different hallmarks. AUROC and AUPRC scores per pipeline were computed. Dashed lines show baseline values for AUROC (0.5) and AUPRC (0.167).

References

    1. Schuster S.C. Next-generation sequencing transforms today's biology. Nat. Methods. 2008; 5:16–18. - PubMed
    1. Stark R., Grzelak M., Hadfield J.. RNA sequencing: the teenage years. Nat. Rev. Genet. 2019; 20:631–656. - PubMed
    1. Kim D., Paggi J.M., Park C., Bennett C., Salzberg S.L.. Graph-based genome alignment and genotyping with HISAT2 and HISAT-genotype. Nat. Biotechnol. 2019; 37:907–915. - PMC - PubMed
    1. Patro R., Duggal G., Love M.I., Irizarry R.A., Kingsford C.. Salmon provides fast and bias-aware quantification of transcript expression. Nat. Methods. 2017; 14:417–419. - PMC - PubMed
    1. Dobin A., Davis C.A., Schlesinger F., Drenkow J., Zaleski C., Jha S., Batut P., Chaisson M., Gingeras T.R.. STAR: ultrafast universal RNA-seq aligner. Bioinformatics. 2013; 29:15–21. - PMC - PubMed

LinkOut - more resources