. 2024 Aug 27;52(15):9247-9266.
doi: 10.1093/nar/gkae550.

Taxonomy of introns and the evolution of minor introns

Affiliations

Taxonomy of introns and the evolution of minor introns

Anouk M Olthof et al. Nucleic Acids Res. .

Abstract

Classification of introns, which is crucial to understanding their evolution and splicing, has historically been binary and has resulted in the naming of major and minor introns that are spliced by their namesake spliceosome. However, a broad range of intron consensus sequences exist, leading us to here reclassify introns as minor, minor-like, hybrid, major-like, major and non-canonical introns in 263 species across six eukaryotic supergroups. Through intron orthology analysis, we discovered that minor-like introns are a transitory node for intron conversion across evolution. Despite close resemblance of their consensus sequences to minor introns, these introns possess an AG dinucleotide at the -1 and -2 position of the 5' splice site, a salient feature of major introns. Through combined analysis of CoLa-seq, CLIP-seq for major and minor spliceosome components, and RNAseq from samples in which the minor spliceosome is inhibited we found that minor-like introns are also an intermediate class from a splicing mechanism perspective. Importantly, this analysis has provided insight into the sequence elements that have evolved to make minor-like introns amenable to recognition by both minor and major spliceosome components. We hope that this revised intron classification provides a new framework to study intron evolution and splicing.


Figures

Graphical Abstract
Graphical Abstract
Figure 1.
Figure 1.
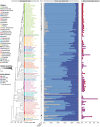
Intron classification in diverse eukaryotic organisms. Phylogenetic tree (left) and bar graphs showing the distribution of the six intron classes (middle) in the genomes of a select set of eukaryotic organisms. A zoomed inset with the percentage of minor introns and minor-like introns can be seen on the right. Intron classes were defined using the criteria described in methods and Supplementary Figure S4. Species are color-coded by phylum. For a full list of intron numbers in all 263 eukaryotic organisms considered, see also Supplementary Table S4. See also Supplementary Figures S6–S10.
Figure 2.
Figure 2.
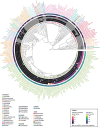
Detection of minor spliceosome-specific snRNAs in a diverse set of eukaryotic organisms. Circos plot with heatmap of the number of detected gene copies for U11, U12, U4atac and U6atac snRNA in a select set of eukaryotic organisms. High confidence snRNAs were identified using a combination of blastn and cmsearch, according to inclusion thresholds described in the methods. The outer ring is a heatmap for the number of minor introns detected in each organism, as shown in Figure 1. Species are color-coded by phylum, as in Figure 1. For a full list of intron numbers in all 263 eukaryotic organisms considered, see also Supplementary Table S4. For a full list of both high and low-confidence snRNA gene copy counts, see also Supplementary Table S7. See also Supplementary Figures S24-S25.
Figure 3.
Figure 3.
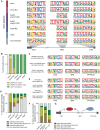
Orthology of human minor introns in a diverse set of eukaryotic organisms. (A) Color-coded heatmap representing the identity of introns orthologous to human minor introns across all 263 eukaryotic organisms considered. Organisms are ordered by phylogeny as in Figures 1 and 2, such that primates are found on the left and TSAR/Haptista on the right. Introns were sorted for visualization purposes using hierarchical clustering of the intron classes. Ten clusters were identified using average linkage, using the nomclust package in R. (B) Conservation of human intron classes across mammalian genomes. (C) Conservation of intron classes in Arabidopsis thaliana across Magnoliopsidae genomes. Underlying data can be found in Supplementary Table S8. See also Supplementary Figure S5.
Figure 4.
Figure 4.
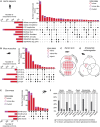
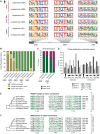
Sequence elements informing recruitment of the major and minor spliceosome. (A) Frequency logos of consensus sequences for 5′ splice site, branch point sequence and 3′ splice site of the different intron classes in mammalian genomes. Dashed lines denote the exon-intron and intron-exon boundaries. (B) CLIP-seq analysis for U2AF1 and ZRSR2 across all human intron classes. (C) Frequency logos of consensus sequences for 5′ splice site, branch point sequence and 3′ splice site of human minor-like introns bound by either U2AF1, ZRSR2 or both. (D) CoLa-seq analysis for all human intron classes. The experimentally validated branch point coordinates were compared with the highest scoring branch points predicted by position weight matrices. (E) Frequency logos of consensus sequences for 5′ splice site, branch point sequence and 3′ splice site of human minor-like introns, separated by utilization of the branch point as determined by CoLa-seq. (F) Integration of the CoLa-seq data with the CLIP-seq data in human minor-like introns. (G) Simplified model with the sequence elements that inform recruitment of the major and minor spliceosome.
Figure 5.
Figure 5.
Identification of introns responsive to minor spliceosome inhibition. (A, B) Upset plot for mis-spliced introns in different (A) human and (B) mouse datasets in which the minor spliceosome is inhibited. Intersections with fewer than five introns have been omitted. (C, D) Venn diagram for mis-spliced introns in different (C) zebrafish and (D) fruit fly datasets in which the minor spliceosome is inhibited. (E) Upset plot for mis-spliced introns in different maize datasets in which the minor spliceosome is inhibited. Intersections with fewer than five introns have been omitted. Color-coding for intron classes in Figure 5 is the same as in Figure 1. Significant retention and/or alternative splicing of introns was identified using a one-tailed Welch's t-test. Responsive introns were defined as those found in genes expressed above 1 TPM, with a significantly increased mis-splicing index (P< 0.05) in minor spliceosome loss-of-function conditions. (F) Bar graphs with total number of responsive minor, minor-like and hybrid introns in the different model organisms. For more information on the analyzed RNAseq datasets (including experimental conditions and N-value), see also Supplementary Table S3. See also Supplementary Figure S12-S18 and Supplementary Table S6. Deg = degron; syn = syndrome; FL = forelimb; HL = hindlimb; DT = dorsal telencephalon.
Figure 6.
Figure 6.
Features of responsive minor-like introns resemble that of minor introns. (A) Frequency logos of consensus sequences for 5′ splice site, branch point sequence and 3′ splice site of human minor, minor-like and hybrid introns whose splicing is either responsive (affected) or unresponsive (unaffected) to minor spliceosome inhibition. Introns found in genes that were expressed below 1 TPM were excluded from all analyses. The number in parentheses denotes the number of introns in each group used to create frequency logos. Dashed lines denote the exon-intron and intron-exon boundaries. (B) Bargraph showing the distribution of human introns bound by ZRSR2 and/or U2AF1. (C) Ancestral status of minor and minor-like introns at vertebrate origin. Ancestral status was determined by a joint call between protostomes and non-bilaterians. (D) Phase distribution for responsive (left) and unresponsive (right) minor-like introns in Homo sapiens (Hsap), Mus musculus (Mmus), Danio rerio (Drer), Drosophila melanogaster (Dmel), Zea mays (Zmay). An example of the different intron phases is shown below. (EF) Gene schematics and splice site sequences for an orthologous intron cluster in TM9SF1 and MIOS, containing an unresponsive (E) and responsive (F) minor-like intron in Homo sapiens, respectively. Nucleotides in dark green are 100% conserved between orthologous introns of the cluster, while nucleotides in light green are 75% conserved. See also Supplementary Figures S19–S23.

Similar articles

Cited by

References

    1. Rogozin I.B., Carmel L., Csuros M., Koonin E.V.. Origin and evolution of spliceosomal introns. Biol. Direct. 2012; 7:11. - PMC - PubMed
    1. Csuros M., Rogozin I.B., Koonin E.V.. A detailed history of intron-rich eukaryotic ancestors inferred from a global survey of 100 complete genomes. PLoS Comput. Biol. 2011; 7:e1002150. - PMC - PubMed
    1. Frumkin I., Yofe I., Bar-Ziv R., Gurvich Y., Lu Y.-Y., Voichek Y., Towers R., Schirman D., Krebber H., Pilpel Y.. Evolution of intron splicing towards optimized gene expression is based on various Cis- and trans-molecular mechanisms. PLoS Biol. 2019; 17:e3000423. - PMC - PubMed
    1. Parenteau J., Durand M., Véronneau S., Lacombe A.-A., Morin G., Guérin V., Cecez B., Gervais-Bird J., Koh C.-S., Brunelle D.et al. .. Deletion of many yeast introns reveals a minority of genes that require splicing for function. Mol. Biol. Cell. 2008; 19:1932–1941. - PMC - PubMed
    1. Rogozin I.B., Wolf Y.I., Sorokin A.V., Mirkin B.G., Koonin E.V.. Remarkable interkingdom conservation of intron positions and massive, lineage-specific intron loss and gain in eukaryotic evolution. Curr. Biol. 2003; 13:1512–1517. - PubMed

Substances

LinkOut - more resources