

Classifying Alzheimer's Disease Neuropathology Using Clinical and MRI Measurements
- PMID: 38943387
- PMCID: PMC11307063
- DOI: 10.3233/JAD-231321
Classifying Alzheimer's Disease Neuropathology Using Clinical and MRI Measurements
Abstract
Background: Computer-aided machine learning models are being actively developed with clinically available biomarkers to diagnose Alzheimer's disease (AD) in living persons. Despite considerable work with cross-sectional in vivo data, many models lack validation against postmortem AD neuropathological data.
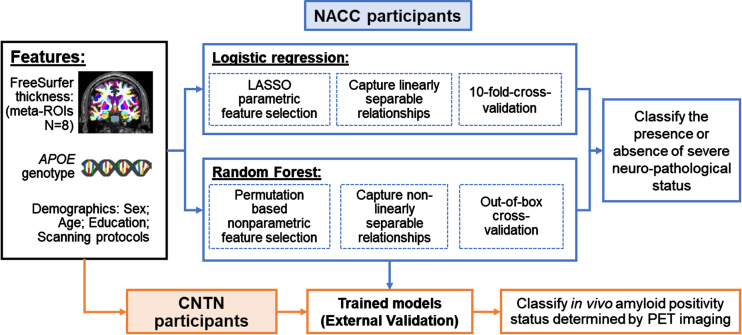
Objective: Train machine learning models to classify the presence or absence of autopsy-confirmed severe AD neuropathology using clinically available features.
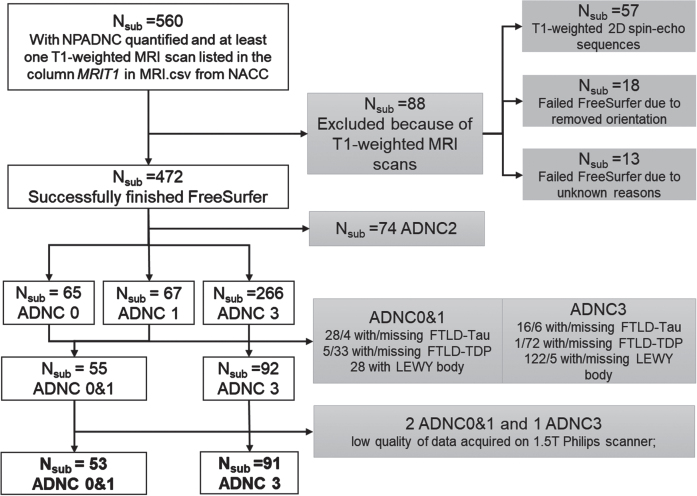
Methods: AD neuropathological status are assessed at postmortem for participants from the National Alzheimer's Coordinating Center (NACC). Clinically available features are utilized, including demographics, Apolipoprotein E(APOE) genotype, and cortical thicknesses derived from ante-mortem MRI scans encompassing AD meta regions of interest (meta-ROI). Both logistic regression and random forest models are trained to identify linearly and nonlinearly separable features between participants with the presence (N = 91, age-at-MRI = 73.6±9.24, 38 women) or absence (N = 53, age-at-MRI = 68.93±19.69, 24 women) of severe AD neuropathology. The trained models are further validated in an external data set against in vivo amyloid biomarkers derived from PET imaging (amyloid-positive: N = 71, age-at-MRI = 74.17±6.37, 26 women; amyloid-negative: N = 73, age-at-MRI = 71.59±6.80, 41 women).
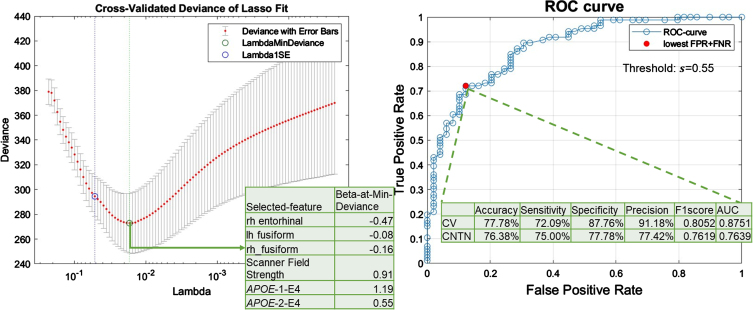
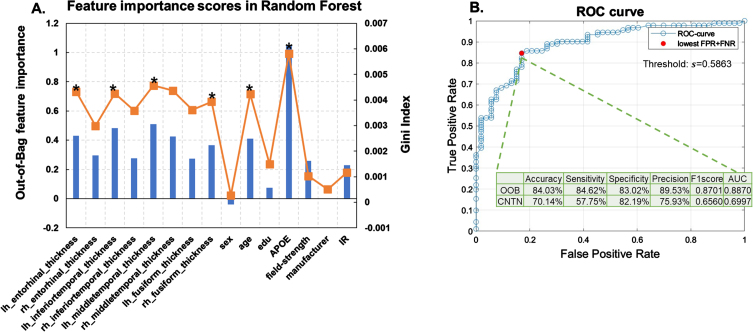
Results: Our models achieve a cross-validation accuracy of 84.03% in classifying the presence or absence of severe AD neuropathology, and an external-validation accuracy of 70.14% in classifying in vivo amyloid positivity status.
Conclusions: Our models show that clinically accessible features, including APOE genotype and cortical thinning encompassing AD meta-ROIs, are able to classify both postmortem confirmed AD neuropathological status and in vivo amyloid status with reasonable accuracies. These results suggest the potential utility of AD meta-ROIs in determining AD neuropathological status in living persons.
Keywords: APOE genotype; Alzheimer’s disease-meta-ROIs; in vivo amyloid status; machine learning; severe AD neuropathology.
Conflict of interest statement
Dr. Cummings has provided consultation to Acadia, Actinogen, Acumen, AlphaCognition, Aprinoia, AriBio, Artery, Biogen, BioVie, Cassava, Cerecin, Diadem, EIP Pharma, Eisai, GemVax, Genentech, GAP Innovations, Janssen, Jocasta, Karuna, Lilly, Lundbeck, LSP, Merck, NervGen, Novo Nordisk, Oligomerix, Optoceutics, Ono, Otsuka, PRODEO, Prothena, ReMYND, Roche, Sage Therapeutics, Signant Health, Simcere, Sunbird Bio, Suven, SynapseBio, TrueBinding, Vaxxinity, and Wren pharmaceutical, assessment, and investment companies.
All other authors have no conflict of interest to report.
Figures
References
-
- 2022 Alzheimer’s disease facts and figures. Alzheimers Dement 18, 700–789. - PubMed
-
- Gauthier S, Rosa-Neto P, Morais JA, Webster C (2021) World Alzheimer Report 2021. Journey through the diagnosis of dementia. Alzheimer’s Disease International, London, UK.
-
- van Dyck CH, Swanson CJ, Aisen P, Bateman RJ, Chen C, Gee M, Kanekiyo M, Li D, Reyderman L, Cohen S, Froelich L, Katayama S, Sabbagh M, Vellas B, Watson D, Dhadda S, Irizarry M, Kramer LD, Iwatsubo T (2023) Lecanemab in early Alzheimer’s disease. N Engl J Med 388, 9–21. - PubMed
-
- Budd Haeberlein S, Aisen PS, Barkhof F, Chalkias S, Chen T, Cohen S, Dent G, Hansson O, Harrison K, von Hehn C, Iwatsubo T, Mallinckrodt C, Mummery CJ, Muralidharan KK, Nestorov I, Nisenbaum L, Rajagovindan R, Skordos L, Tian Y, van Dyck CH, Vellas B, Wu S, Zhu Y, Sandrock A (2022) Two randomized phase 3 studies of aducanumab in early Alzheimer’s disease. J Prev Alzheimers Dis 9, 197–210. - PubMed
MeSH terms
Substances
Grants and funding
- P20 AG068053/AG/NIA NIH HHS/United States
- P30 AG066515/AG/NIA NIH HHS/United States
- P30 AG062421/AG/NIA NIH HHS/United States
- P30 AG066508/AG/NIA NIH HHS/United States
- P30 AG066519/AG/NIA NIH HHS/United States
- P30 AG072973/AG/NIA NIH HHS/United States
- P30 AG066462/AG/NIA NIH HHS/United States
- P30 AG066530/AG/NIA NIH HHS/United States
- P30 AG066509/AG/NIA NIH HHS/United States
- P20 AG068077/AG/NIA NIH HHS/United States
- P30 AG066546/AG/NIA NIH HHS/United States
- P30 AG072972/AG/NIA NIH HHS/United States
- P30 AG072979/AG/NIA NIH HHS/United States
- P20 AG068082/AG/NIA NIH HHS/United States
- P30 AG072975/AG/NIA NIH HHS/United States
- P30 AG066444/AG/NIA NIH HHS/United States
- P30 AG066507/AG/NIA NIH HHS/United States
- P30 AG072946/AG/NIA NIH HHS/United States
- P30 AG066518/AG/NIA NIH HHS/United States
- P30 AG066511/AG/NIA NIH HHS/United States
- U24 AG072122/AG/NIA NIH HHS/United States
- P30 AG066512/AG/NIA NIH HHS/United States
- P30 AG072978/AG/NIA NIH HHS/United States
- P30 AG062429/AG/NIA NIH HHS/United States
- P30 AG062422/AG/NIA NIH HHS/United States
- R01 AG079280/AG/NIA NIH HHS/United States
- P30 AG072977/AG/NIA NIH HHS/United States
- P30 AG062677/AG/NIA NIH HHS/United States
- P20 AG068024/AG/NIA NIH HHS/United States
- P30 AG072958/AG/NIA NIH HHS/United States
- P30 AG062715/AG/NIA NIH HHS/United States
- P30 AG066506/AG/NIA NIH HHS/United States
- P30 AG066468/AG/NIA NIH HHS/United States
- P30 AG072976/AG/NIA NIH HHS/United States
- P30 AG072947/AG/NIA NIH HHS/United States
- P30 AG072931/AG/NIA NIH HHS/United States
- P30 AG066514/AG/NIA NIH HHS/United States
- P30 AG072959/AG/NIA NIH HHS/United States
LinkOut - more resources
Full Text Sources
Medical
Miscellaneous
