. 2024 Nov;57(11):e13697.
doi: 10.1111/cpr.13697. Epub 2024 Jun 29.

Single-cell RNA sequencing elucidated the landscape of breast cancer brain metastases and identified ILF2 as a potential therapeutic target

Affiliations

Single-cell RNA sequencing elucidated the landscape of breast cancer brain metastases and identified ILF2 as a potential therapeutic target

Jindong Xie et al. Cell Prolif. 2024 Nov.

Abstract

Distant metastasis remains the primary cause of morbidity in patients with breast cancer. Hence, the development of more efficacious strategies and the exploration of potential targets for patients with metastatic breast cancer are urgently needed. The data of six patients with breast cancer brain metastases (BCBrM) from two centres were collected, and a comprehensive landscape of the entire tumour ecosystem was generated through the utilisation of single-cell RNA sequencing. We utilised the Monocle2 and CellChat algorithms to investigate the interrelationships among each subcluster. In addition, multiple signatures were collected to evaluate key components of the subclusters through multi-omics methodologies. Finally, we elucidated common expression programs of malignant cells, and experiments were conducted in vitro and in vivo to determine the functions of interleukin enhancer-binding factor 2 (ILF2), which is a key gene in the metastasis module, in BCBrM progression. We found that subclusters in each major cell type exhibited diverse characteristics. Besides, our study indicated that ILF2 was specifically associated with BCBrM, and experimental validations further demonstrated that ILF2 deficiency hindered BCBrM progression. Our study offers novel perspectives on the heterogeneity of BCBrM and suggests that ILF2 could serve as a promising biomarker or therapeutic target for BCBrM.


Conflict of interest statement

The authors declare no conflicts of interest.

Figures

FIGURE 1
FIGURE 1
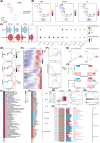
Single‐cell atlas encompassing the cellular composition of BCBrM. (A) Overview of the study design and workflow. Single‐cell suspensions were collected from BCBrM followed by scRNA‐seq on the 10× Genomics platform. (B) The radiomics information (CT and MRI) of each BCBrM patient confirm the occurrence of BrM. (C) t‐SNE plot of single cells profiled in the present study coloured by major cell type. (D) Bar plots showing the relative proportions of each major cell subtype in each sample. (E) Feature plots for the canonical marker genes of B/Plasma cells (CD79A), CAFs (COL1A2), endothelial cells (VWF), malignant cells (EPCAM), microglial cells (CX3CR1), mural cells (RGS5), myeloid cells (LYZ), oligodendrocytes (OLIG1), and T cells (CD3D). (F) Dot plot showing the expression levels of classic marker genes across all major cell types. (G) Representative images of multiplex immunofluorescent staining of BCBrM tissue. The cyan, red, yellow, and green colours indicate positive cells with the expression of PanCK (malignant cells), CD3 (T cells), CD68 (myeloid cells), and α‐SMA (fibroblasts and endothelial cells), respectively, in BCBrM tissue.
FIGURE 2
FIGURE 2
Transcriptional profiling of CAFs in the tumour microenvironment of BCBrM tissues. (A) tSNE plot showing CAFs subtypes, including myCAFs and pvCAFs. myCAFs, myofibroblastic CAFs; pvCAFs, perivascular CAFs. (B) Feature plots showing the expression of selected cluster‐specific genes. (C) Violin plots (left) displaying the representative expression pattern across different subtypes of CAFs. Dot plot (right) showing the expression of the differential gene markers in each subtype. (D) Pseudotime trajectory of CAFs subtypes by Monocle2. Trajectory is coloured by pseudotime (top), CytoTRACE (middle), and cell clusters (bottom). (E) Heatmap showing the scaled expression of differentially expressed genes across pseudotime. (F) The expression of the variable genes involved in the cell state transition. (G) Cellchat analyses showing number of interactions (left) and interaction weights/strength (right) between CAFs subtypes and malignant cells. (H) Heatmap showing the communication probabilities between CAFs subtypes and malignant cells. (I) Heatmap showing the scaled activities of 50 hallmark pathways between CAFs subtypes. (J) Heatmap showing the scaled surface protein genes expression between CAFs subtypes. (K) Box plot showing the expression levels of NDUFA4L2 between primary and paired BCBrM tissues. **** means p < 0.0001. (L) Kaplan–Meier survival analysis of NDUFA4L2 in GSE22219. (M) Enrichment analyses using gene set enrichment analysis algorithm. NES, normalized enrichment score; FDR, false discovery rate. (N) Enrichment analyses using Gene Ontology database.
FIGURE 3
FIGURE 3
Immunosuppressive characterisation of myeloid cells in BCBrM. (A) tSNE plot showing myeloid cells subtypes, including mast cells, monocytes, macrophages, neutrophils, DCs, and proliferation cells. DCs, dendritic cells. (B) Dot plot showing the expression of the differential gene markers in each subtype. (C) Feature plots showing the normalized expression of highly expressed genes in each myeloid cells subcluster. (D) Cellchat analyses showing number of interactions between myeloid cells subtypes and malignant cells. (E) Violin plots showing the scores of M1‐like and M2‐like signatures among macrophage subtypes. (F) Pseudotime trajectory of macrophage subtypes by Monocle2. Trajectory is coloured by pseudotime (top), CytoTRACE (middle), and cell clusters (bottom). (G) Heatmap showing the scaled expression of differentially expressed genes across pseudotime. (H) Heatmap showing the scaled activities of 50 hallmark pathways between CAFs subtypes. (I) Dot plots showing the metabolic pathways activities among macrophage subtypes. (J) Violin plots showing the scaled immune‐related genes expression among macrophage subtypes.
FIGURE 4
FIGURE 4
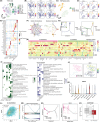
T/NK and B/Plasma cells were distinguished in BCBrM. (A) t‐SNE plot of the T/NK cell landscape. Tn, naïve T cells; Tm, memory T cells; Tex, exhausted T cells. Tregs, regulatory T cells. (B) Feature plots showing the normalized expression of highly expressed genes in each T/NK cell subcluster. (C) t‐SNE plot of the B/Plasma cell landscape. Bn, naïve B cells; Bm, memory B cells. (D) Feature plots showing the normalized expression of highly expressed genes in each B/Plasma cell subcluster. (E) Dot plot showing the expression of the differential gene markers in each T/NK cell subcluster. (F) Cellchat analyses showing number of interactions between T/NK cells (left), B/Plasma cells (right), and malignant cells. (G) Pseudotime trajectory of CD8+ T (left) and B/Plasma (right) cells subclusters by Monocle2. (H) Heatmap showing the scaled expression levels of co‐stimulators, co‐inhibitors, and T‐function markers among T/NK and B/Plasma cells subclusters. (I) Enrichment analyses using KEGG pathways. (J) t‐SNE plot of the Tregs subcluster (left) and feature plots showing the normalized expression of ISG15 in Tregs subclusters (right). (K) Violin plot showing the expression level of ISG15. (L) Correlation analysis between ISG15 and FOXP3 using bc‐GenExMiner database. (M) Enrichment analyses using gene set enrichment analysis algorithm. NES, normalized enrichment score; FDR, false discovery rate. (N) The expression of ISG15 involved in the cell state transition. (O) Box plot showing the differences of ISG15+ Tregs activity between primary and paired BCBrM tissues. ** means p < 0.01.
FIGURE 5
FIGURE 5
Diversity of mural cells, endothelial cells, and organ‐resident cells in BCBrM. (A) t‐SNE plot of the mural cells (top), endothelial cells (middle), and organ‐resident cells (bottom) landscape. SMCs, smooth muscle cells; ECs, endothelial cells; hMicroglials, homeostatic microglias; iMicroglials, inflammatory microglias; MFOLs, myelin‐forming oligodendrocytes; OPCs, oligodendrocyte progenitor cells. (B) Feature plots showing the normalized expression of highly expressed genes in mural cells (left), endothelial cells (middle), and organ‐resident cells (right) subclusters. (C) Dot plot showing the expression of the differential gene markers in mural cells, endothelial cells, and organ‐resident cells subclusters. (D) Cellchat analyses showing number of interactions between mural cells (left), endothelial cells (middle), organ‐resident cells (right) subclusters, and malignant cells. (E) Heatmap showing the scaled activities of 50 hallmark pathways among mural cells, endothelial cells, and organ‐resident cells subclusters. (F) Enrichment analyses to explore the different biological pathways using KEGG database. (G) Dot plot showing the scaled immune checkpoints expression among mural cells, endothelial cells, and organ‐resident cells subclusters.
FIGURE 6
FIGURE 6
Identification of common modules of malignant cells in BCBrM lesions and found ILF2 might be a biomarker in BCBrM. (A) t‐SNE plot of the malignant cell landscape. (B) Feature plots showing the normalized expression of highly expressed genes in each malignant cells subcluster. (C) Heatmap of the expression levels of the top differentially expressed genes among subclusters of malignant cells. (D) Heatmap showing five common modules of malignant cells in BCBrM lesion. (E) Heatmap revealing the pairwise interactions among the expression modules. (F) Feature plots showing the distributions of each expression module. (G) Violin plot of the proportions among five expression modules. (H) Heatmap showing the scaled activities of 50 hallmark pathways between malignant cell subclusters. (I) Venn plot showing the intersection gene between BCBrM‐related datasets and the metastasis module. (J) Violin plot showing the expression level of ILF2. (K) Box plot showing the expression of ILF2 between normal and tumour tissues in TCGA‐BRCA dataset. **** means p < 0.0001. (L) Violin and box plots showing the expression of ILF2 among BCBrM, brain tumour in situ, and breast tumour in situ. ** means p < 0.01. (M) Violin and box plots showing the expression of ILF2 among preinjected and metastatic sites. **** means p < 0.0001. (N) Violin and box plots showing the expression of ILF2 between primary and paired BCBrM tissues. ** means p < 0.01. (O) Kaplan–Meier survival analyses showing the specific role of ILF2 in relapse‐free survival and progress‐free survival outcomes in TCGA‐BRCA cohort. (P) Kaplan–Meier survival analysis showing the specific role of ILF2 in relapse‐free survival outcomes in GSE22219 cohort.
FIGURE 7
FIGURE 7
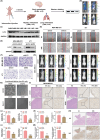
ILF2 depletion inhibits BCBrM formation in vitro and in vivo. (A) Flow chart indicated that establishment of metastatic mice model and multi‐organ metastases were analysed by western blotting. (B) Bioluminescence imaging showing the multi‐organ metastases of each mouse. (C) The expression ILF2 in different metastatic sites were determined by western blotting. BrM, brain metastases; HM, hepatic metastases; LM, lung metastases. (D) MDA‐MB‐231 and 4T1 cells were stably transduced with lentivirus encoding short hairpin RNAs targeting ILF2 (shILF2) or negative control RNA (shCtrl). Then, the cells were assayed for ILF2 expression. (E) Wound healing assays detected the ability of breast cancer cells to migrate and invade. (F) Transwell assays detected the ability of breast cancer cells to migrate. (G) Angiogenesis assays using HUVEC and Bend.3 cells treated with conditioned media from 4T1 and MDA‐MB‐231 cells treated with shCtrl and shILF2. (H) Bioluminescence imaging showing the BCBrM of each mouse. (I) Haematoxylin Eosin (HE) and immunohistochemistry (IHC) staining of the mice BCBrM tissues. (J, K) Box plots showing differences of number of cells migrated per filed and relative healing area. *** means p < 0.001 and ** means p < 0.01. (L) Box plots showing differences of number of junctions per field. *** means p < 0.001 and ** means p < 0.01. (M) Box plots showing differences of number of brain metastatic nodules per mouse. ** means p < 0.01. (N) Haematoxylin Eosin (HE) and immunohistochemistry (IHC) staining of the human BCBrM tissue.

References

    1. Sung H, Ferlay J, Siegel RL, et al. Global cancer statistics 2020: GLOBOCAN estimates of incidence and mortality worldwide for 36 cancers in 185 countries. CA Cancer J Clin. 2021;71(3):209‐249. - PubMed
    1. Lin NU, Bellon JR, Winer EP. CNS metastases in breast cancer. J Clin Oncol. 2004;22(17):3608‐3617. - PubMed
    1. Corti C, Antonarelli G, Criscitiello C, et al. Targeting brain metastases in breast cancer. Cancer Treat Rev. 2022;103:102324. - PubMed
    1. Soffietti R, Pellerino A. Brain metastasis from HER2‐positive breast cancer: an evolving landscape. Clin Cancer Res. 2023;29(1):8‐10. - PubMed
    1. Wu S, Lu J, Zhu H, et al. A novel axis of circKIF4A‐miR‐637‐STAT3 promotes brain metastasis in triple‐negative breast cancer. Cancer Lett. 2024;581:216508. - PubMed

Substances