. 2024 Sep 3;36(9):3751-3769.
doi: 10.1093/plcell/koae195.

CELLULOSE SYNTHASE-LIKE C proteins modulate cell wall establishment during ethylene-mediated root growth inhibition in rice

Affiliations

CELLULOSE SYNTHASE-LIKE C proteins modulate cell wall establishment during ethylene-mediated root growth inhibition in rice

Yang Zhou et al. Plant Cell. .

Abstract

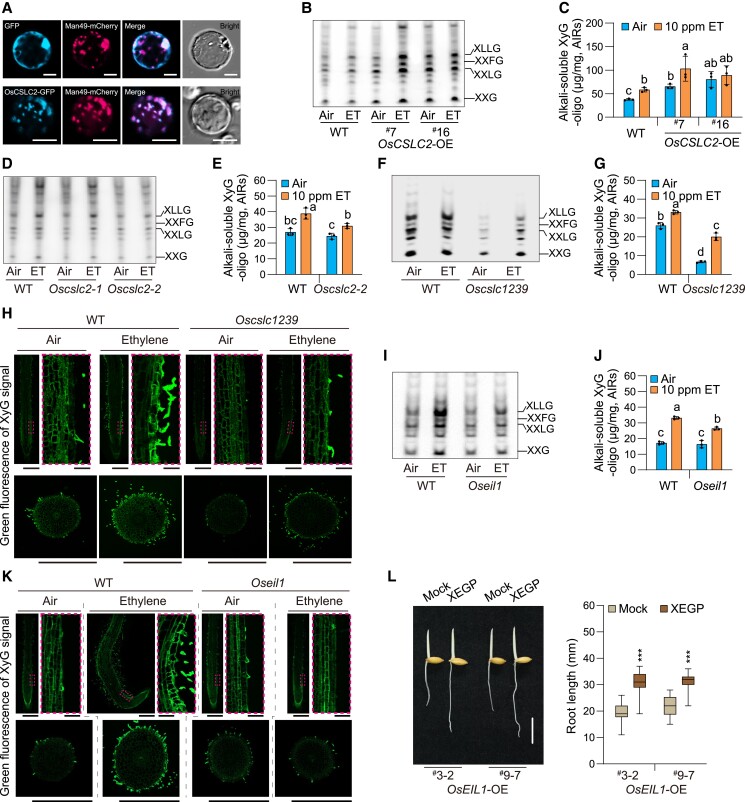
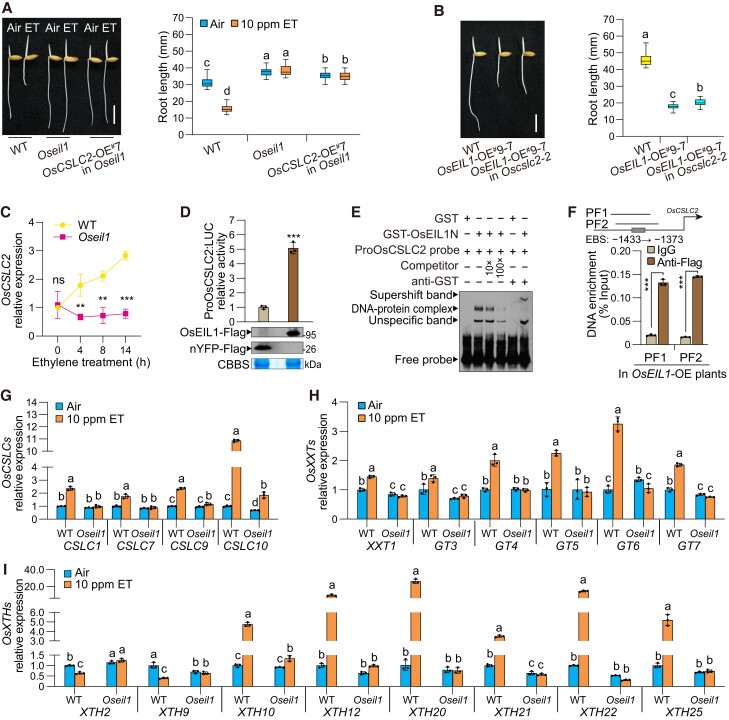
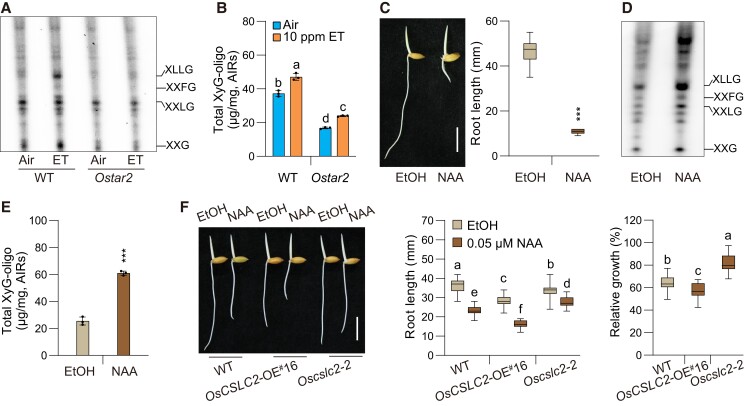
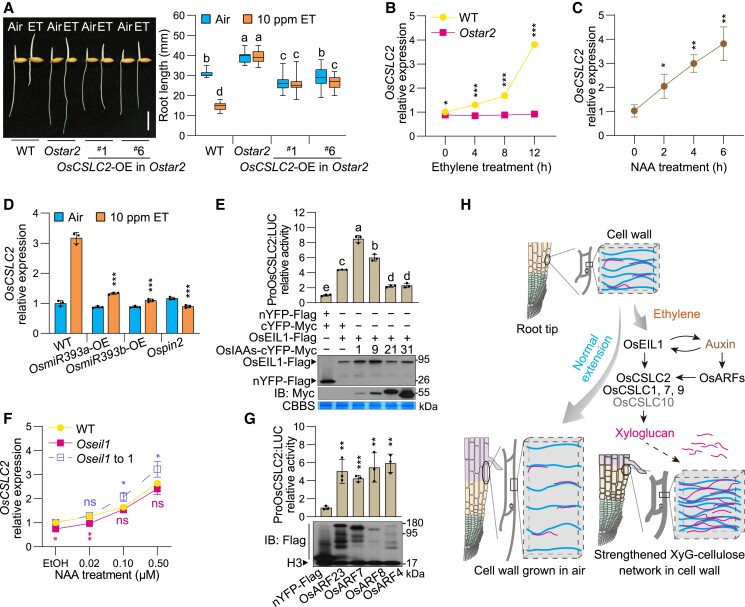
The cell wall shapes plant cell morphogenesis and affects the plasticity of organ growth. However, the way in which cell wall establishment is regulated by ethylene remains largely elusive. Here, by analyzing cell wall patterns, cell wall composition and gene expression in rice (Oryza sativa, L.) roots, we found that ethylene induces cell wall thickening and the expression of cell wall synthesis-related genes, including CELLULOSE SYNTHASE-LIKE C1, 2, 7, 9, 10 (OsCSLC1, 2, 7, 9, 10) and CELLULOSE SYNTHASE A3, 4, 7, 9 (OsCESA3, 4, 7, 9). Overexpression and mutant analyses revealed that OsCSLC2 and its homologs function in ethylene-mediated induction of xyloglucan biosynthesis mainly in the cell wall of root epidermal cells. Moreover, OsCESA-catalyzed cellulose deposition in the cell wall was enhanced by ethylene. OsCSLC-mediated xyloglucan biosynthesis likely plays an important role in restricting cell wall extension and cell elongation during the ethylene response in rice roots. Genetically, OsCSLC2 acts downstream of ETHYLENE-INSENSITIVE3-LIKE1 (OsEIL1)-mediated ethylene signaling, and OsCSLC1, 2, 7, 9 are directly activated by OsEIL1. Furthermore, the auxin signaling pathway is synergistically involved in these regulatory processes. These findings link plant hormone signaling with cell wall establishment, broadening our understanding of root growth plasticity in rice and other crops.


Conflict of interest statement

Conflict of interest statement. Authors declare no competing interests.

Figures

Figure 1.
Figure 1.
Ethylene regulates cell elongation in rice roots. A) Root length of Oseil1 seedlings in response to ethylene. Etiolated seedlings were grown with ambient air (air) or 10 ppm ethylene (ET) for 1.5 days after germination (DAG). WT, wild type. n ≥ 26 seedlings. Scale bar, 10 mm. B) Paraffin-embedded longitudinal sections of roots. Etiolated seedlings were grown with ambient air or 10 ppm ethylene for 1 DAG. Scale bar, 250 μm. The dashed boxes in the root growth terminating zone mark the magnified view on the right. Scale bar, 100 μm. C) Cell length of the epidermis and cortex in response to ethylene. n ≥ 52 cells were collected from more than 3 roots in each treatment group. D) Paraffin-embedded cross-sections of roots. Scale bar, 100 μm. E) Lateral expansion of the roots in response to ethylene. n ≥ 23 images, taken from more than 4 roots in each treatment. F, G) Number of cell layers F) and cells G) in the cortex. n ≥ 7 roots. In CG), the features of the root growth terminating zone are shown and were measured. H) The root meristem was analyzed by EdU staining. Scale bar, 250 μm. I) The distribution of active meristematic cells is indicated by the total area of Azide 488 fluorescence. n ≥ 22 roots. J) The number of meristematic cells estimated by total azide 488 fluorescence intensity. n ≥ 22 roots. K) Cell division activity of meristematic cells estimated by the mean azide 488 fluorescence intensity. n ≥ 22 roots. L) The effect of ethylene on the thickness of root cell wall. Cell walls in junction regions in the cortex and sclerenchyma layer were measured and are shown. Scale bar for the epidermis, 1 μm; scale bar for the sclerenchyma layer, 5 μm; scale bar for the cortex, 1 μm. n ≥ 130 positions, taken from more than 10 images of 3 roots in each treatment. In the boxplots, the middle line is plotted at the median, the box extends from the 25th to 75th percentiles, and the whiskers represent down to the minimum and up to the maximum value. Statistical significance was analyzed by one-way analysis of variance (ANOVA) followed by a post hoc (LSD) analysis at a significance level of 0.05. Different lowercase letters above the bars indicate a significant difference, and “ns” indicates no significant difference. The source data are provided in Supplementary Data Set 3.
Figure 2.
Figure 2.
CSLC family members are involved in the ethylene response of rice and Arabidopsis. A) Gene Ontology enrichment of ethylene-responsive genes in root tips analyzed by RNA-Seq. The source data are provided in Supplementary Data Set 1. B) Expression of eight cell wall synthesis-related genes in response to ethylene, as determined by RT‒qPCR. The values represent the means ± SDs. The relative expression levels are based on transcript levels. C) Root length of OsCSLC2 overexpression seedlings (OsCSLC2-OE) in response to ethylene. Etiolated seedlings were grown with ambient air (air) or 1 ppm ethylene (ET) for 2 days after germination (DAG). OsCSLC2-OE#7 and OsCSLC2-OE#16 are independent transgenic lines. WT, wild type. Relative root growth was calculated as the percentage of the length in ethylene to the length with ambient air. Scale bar, 10 mm. n ≥ 28 seedlings. D) Root length of Oscslc2 mutants in response to ethylene. Etiolated seedlings were grown with ambient air or 5 ppm ethylene for 2.5 DAG. Oscslc2-1 and Oscslc2-2 are independent mutant lines. Scale bar, 10 mm. n ≥ 30 seedlings. E) Root length of the Oscslc1239 higher-order mutant in response to ethylene. Etiolated seedlings were grown with ambient air with 2 or 5 ppm ethylene for 2 DAG. Scale bar, 10 mm. n ≥ 21 seedlings. F) Root thickness of Oscslc1239 in response to ethylene. Scale bar, 1 mm. n ≥ 4 seedlings. G) Root ethylene response of segregating higher-order Oscslc seedlings. Etiolated seedlings were grown in 5 ppm ethylene for 3 DAG. Scale bar, 10 mm. The seedlings are numbered. +/+, WT genotype of OsCSLCs; +/−, heterozygous genotype; −/−, homozygous mutant genotype. H) Ethylene response of apical hooks in higher-order Atcslc mutants. Col-0, wild-type Arabidopsis of Columbia ecotype. Bending angles were measured with the hypocotyl toward the top at 0 degrees. Scale bar, 500 μm. n ≥ 26 seedlings. I) Hypocotyl length in higher-order Arabidopsis Atcslc mutants in response to ethylene. The relative hypocotyl growth is relative to the length with ambient air. Scale bar, 10 mm. n ≥ 28 seedlings. In the boxplots, the middle line is plotted at the median, the box extends from the 25th to 75th percentiles, and the whiskers represent down to the minimum and up to the maximum value. In B and I), ns, not significantly different; *P < 0.05; **P < 0.01; ***P < 0.001, as determined by a two-tailed Student's t test compared to the 0-time point or the Col-0 control. In C–F and H), statistical significance was analyzed by one-way ANOVA followed by a post hoc (LSD) analysis at a significance level of 0.05. Different lowercase letters above the bars indicate a significant difference.
Figure 3.
Figure 3.
XyG in the cell wall synthesized by OsCSLCs restricts cell elongation in the root ethylene response. A) Subcellular localization of OsCSLC2. GFP served as the control, and the Man49-mCherry protein indicates the Golgi apparatus. In randomly chosen regions, 14 protoplasts for OsCSLC2-GFP and Man49-mCherry localization were imaged, and 6 protoplasts for GFP and Man49-mCherry localization (the control) were imaged. The fluorescence signals of OsCSLC2-GFP and Man49-mCherry highly overlapped in all observed protoplasts. The representative protoplasts are exhibited. Scale bar, 10 μm. B, D, F, and I) Xyloglucan-derived oligosaccharides (XyG-oligo) in the root cell walls of OsCSLC2 overexpression (OsCSLC2-OE, B), Oscslc2 (D), Oscslc1239 (F), and Oseil1 (I) seedlings in response to ethylene (ET) analyzed by PACE. C, E, G, and J) Levels of XyG-oligo in the root cell walls of OsCSLC2-OE (C), Oscslc2 (E), Oscslc1239 (G), and Oseil1 (J) seedlings, as determined by UPLC-MS. The total XyG-oligo content reflects the XyG level. AIRs, alcohol insoluble residues. Three biological replicates were performed. The data are the means ± SDs. Statistical significance was analyzed by one-way ANOVA followed by a post hoc (LSD) analysis at a significance level of 0.05. Different lowercase letters above the bars indicate a significant. H, K) Immunodetection of ethylene-induced cell wall XyG in the roots of Oscslc1239 (H) and Oseil1 (K). One-DAG etiolated seedlings were treated with 10 ppm ethylene for 8 h, and the root tips were collected for resin-embedded sectioning. Green fluorescence shows the distribution of XyG. The upper pictures are longitudinal sections. Scale bar, 500 μm. The magnified view on the right is the region marked by the dashed box. Scale bar, 50 μm. The lower pictures are cross-sections. Scale bar, 500 μm. The images of more than 12 sections with similar green immunofluorescence of XyG prepared using 6 roots in each treatment group were taken, and the representative images are shown. L) Effect of xyloglucanase (XEGP) on the root growth of OsEIL1 overexpression seedlings (OsEIL1-OE). n ≥ 31 seedlings. Scale bar, 10 mm. In the boxplots, the middle line is plotted at the median, the box extends from the 25th to 75th percentiles, and the whiskers represent down to the minimum and up to the maximum value. ns, not significantly different; ***P < 0.001, as determined by a two-tailed Student's t test compared to the mock control.
Figure 4.
Figure 4.
OsEIL1 regulates the expression of OsCSLCs and other XyG metabolism-related genes in the ethylene response of roots. A) Root length of the OsCSLC2 overexpression seedlings (OsCSLC2-OE) in the Oseil1 background in response to ethylene. Etiolated seedlings were grown with ambient air (Air) or 10 ppm ethylene (ET) for 2 DAG. n ≥ 29 seedlings. Scale bar, 10 mm. B) Root length of OsEIL1-OE seedlings in the Oscslc2 background. Etiolated seedlings were grown with ambient air for 2.5 DAG. n ≥ 24 seedlings. Scale bar, 10 mm. C) The expression of OsCSLC2 in the Oseil1 in response to ethylene. The relative expression levels are based on transcript levels. The values represent the means ± SDs, n = 3. D) Regulatory effect of OsEIL1 on the activity of OsCSLC2 promoter in rice protoplasts. nYFP-Flag served as the control. The relative LUC activity indicates OsCSLC2 promoter activity. The immunoblotting shows the Flag-tagged proteins, and Coomassie Brilliant Blue Staining (CBBS) indicates the equivalent loading. The values represent the means ± SDs, n = 3. E) EMSA and supershift-EMSA for OsEIL1 binding to OsCSLC2 promoter. OsEIL1N indicates 1-350 aa of OsEIL1. A GST antibody for supershifting demonstrated the binding. F) ChIP‒qPCR assay for OsEIL1 binding to OsCSLC2 promoter. The upper diagram shows the region of the OsEIL1 binding site (EBS) and two ChIP‒qPCR fragments (PF1 and PF2) in OsCSLC2 promoter. IgG served as the negative control. The values represent the means ± SDs, n = 3. G–I) The expression of OsCSLC1, 7, 9, 10 (G), OsXXT1, OsGT3OsGT7 (H), and OsXTHs (I) in response to ethylene in roots. The values represent the means ± SDs, n = 3. In the boxplots, the middle line is plotted at the median, the box extends from the 25th to 75th percentiles, and the whiskers represent down to the minimum and up to the maximum valu. In A, B and G–I), statistical significance was analyzed by one-way ANOVA followed by a post hoc (LSD) analysis at a significance level of 0.05. Different lowercase letters above the bars indicate a significant difference. In C, D, and F), ns, not significantly different; *P < 0.05; **P < 0.01; ***P < 0.001, as determined by a two-tailed Student's t test compared to the corresponding control.
Figure 5.
Figure 5.
Auxin inhibition of root growth is also dependent on XyG synthesis in the cell wall. A, B) Xyloglucan-derived oligosaccharides (XyG-oligo) in the root cell walls of the Ostar2 in the ethylene response, as analyzed by PACE (A) and UPLC-MS (B). Etiolated seedlings were grown with ambient air (air) or 10 ppm ethylene (ET) for 1.5 days after germination (DAG). WT, wild type. Three biological replicates were analyzed via UPLC‒MS, and the values are presented as the means ± SDs. C) Root length in response to auxin. Seedlings were grown in 0.1 μM NAA for 2 DAG. An equal amount of EtOH solvent served as the control. n ≥ 46 seedlings. Scale bar, 10 mm. D, E) XyG-oligo in the root cell wall in the auxin response was analyzed by PACE (D) and UPLC-MS (E). The entire roots of rice plants grown in 0.1 μM NAA or an equal amount of EtOH solvent for 1.5 DAG were used for the analyses. Three biological replicates were analyzed via UPLC‒MS, and the values are presented as the means ± SDs. F) Root length of the OsCSLC2 overexpression (OsCSLC2-OE) and Oscslc2 seedlings in response to auxin. Etiolated plants were grown in water supplemented with 0.05 μM NAA for 1.5 DAG, and an equal amount of EtOH served as the control. The relative root length refers to the length of the roots after treatment with 0.05 μM NAA relative to the length of the roots after treatment with EtOH. n ≥ 30 seedlings. In the boxplots, the middle line is plotted at the median, the box extends from the 25th to 75th percentiles, and the whiskers represent down to the minimum and up to the maximum value. In B and F), statistical significance was analyzed by one-way ANOVA followed by a post hoc (LSD) analysis at a significance level of 0.05. Different lowercase letters above the bars indicate a significant difference. In C and E), ns, not significantly different; *P < 0.05; **P < 0.01; ***P < 0.001, as determined by a two-tailed Student's t test compared to the EtOH control.
Figure 6.
Figure 6.
The ethylene pathway and auxin pathway synergistically regulate the expression of OsCSLC2. A) Root length of the OsCSLC2 overexpression seedlings (OsCSLC2-OE) in the Ostar2 background in response to ethylene. Etiolated seedlings were grown with ambient air (air) or 10 ppm ethylene (ET) for 1.5 DAG. WT, wild type. Scale bar, 10 mm. n ≥ 29 seedlings. B)OsCSLC2 expression in the Ostar2 root tips in response to ethylene. The relative expression levels are based on transcript levels. The values represent the means ± SDs, n = 3. C)OsCSLC2 expression in response to auxin. One-DAG etiolated seedlings were treated with 0.5 μM NAA, and the resulting root tips were used for the analyses. The data are the means ± SDs (n = 3). D) Effect of disrupting the auxin pathway on the ethylene induction of OsCSLC2 expression. One-DAG etiolated seedlings were treated with or without 10 ppm ethylene for 8 h, and the resulting root tips were used for the analyses. The data are the means ± SDs (n = 3). E) Effects of OsIAA1, 9, 21, 31 on OsEIL1-activated OsCSLC2 promoter activity. The data are the means ± SDs, n = 3. The immunoblotting shows the expression of Flag-tagged and Myc-tagged proteins. CBBS was used as the loading control. F) Auxin-induced OsCSLC2 expression in the Oseil1. One-DAG Oseil1 etiolated seedlings were treated with EtOH or NAA for 4 h, and the resulting root tips were used for the analysis of OsCSLC2 expression. The “Oseil1 to 1” indicate OsCSLC2 expression in the Oseil1 under the NAA treatment relative to that in the EtOH control. Three biological replicates were performed, and the values represent the means ± SDs. G) Regulatory effect of OsARFs on OsCSLC2 promoter activity. The values represent the means ± SDs, n = 3. H3 indicates the loading control. In the boxplots, the middle line is plotted at the median, the box extends from the 25th to 75th percentiles, and the whiskers represent down to the minimum and up to the maximum value. In A and E), statistical significance was analyzed by one-way ANOVA followed by a post hoc (LSD) analysis at a significance level of 0.05. Different lowercase letters above the bars indicate a significant difference. In B–D, F, and G), ns, not significantly different; *P < 0.05; **P < 0.01; ***P < 0.001, as determined by a two-tailed Student's t test compared to the corresponding control. H) A working model showing that the ethylene pathway and auxin pathway work together to promote the expression of OsCSLC2 and its homologs for xyloglucan (XyG) synthesis and accumulation in the cell wall to inhibit cell elongation and hence root growth during the root ethylene response of rice seedlings. The regions of the root tip including the growth terminating zone, elongation zone, and meristematic zone are shaded. In the cell wall, the thicker lines and thinner lines represent cellulose microfibrils and XyG, respectively. The dashed arrow represents a speculation.

Similar articles

Cited by

References

    1. Alarcón MV, Lloret PG, Salguero J. Synergistic action of auxin and ethylene on root elongation inhibition is caused by a reduction of epidermal cell length. Plant Signal Behav. 2014:9(3):e28361. 10.4161/psb.28361 - DOI - PMC - PubMed
    1. Bart R, Chern M, Park C-J, Bartley L, Ronald PC. A novel system for gene silencing using siRNAs in rice leaf and stem-derived protoplasts. Plant Methods. 2006:2(1):13. 10.1186/1746-4811-2-13 - DOI - PMC - PubMed
    1. Baskin TI, Jensen OE. On the role of stress anisotropy in the growth of stems. J Exp Bot. 2013:64(15):4697–4707. 10.1093/jxb/ert176 - DOI - PubMed
    1. Bian H, Xie Y, Guo F, Han N, Ma S, Zeng Z, Wang J, Yang Y, Zhu M. Distinctive expression patterns and roles of the miRNA393/TIR1 homolog module in regulating flag leaf inclination and primary and crown root growth in rice (Oryza sativa). New Phytol. 2012:196(1):149–161. 10.1111/j.1469-8137.2012.04248.x - DOI - PubMed
    1. Binder BM. Ethylene signaling in plants. J Biol Chem. 2020:295(22):7710–7725. 10.1074/jbc.REV120.010854 - DOI - PMC - PubMed

LinkOut - more resources