. 2024 Jul 19;135(3):416-433.
doi: 10.1161/CIRCRESAHA.123.323158. Epub 2024 Jul 1.

Systemic Deletion of ARRDC4 Improves Cardiac Reserve and Exercise Capacity in Diabetes

Affiliations

Systemic Deletion of ARRDC4 Improves Cardiac Reserve and Exercise Capacity in Diabetes

Yoshinobu Nakayama et al. Circ Res. .

Abstract

Background: Exercise intolerance is an independent predictor of poor prognosis in diabetes. The underlying mechanism of the association between hyperglycemia and exercise intolerance remains undefined. We recently demonstrated that the interaction between ARRDC4 (arrestin domain-containing protein 4) and GLUT1 (glucose transporter 1) regulates cardiac metabolism.

Methods: To determine whether this mechanism broadly impacts diabetic complications, we investigated the role of ARRDC4 in the pathogenesis of diabetic cardiac/skeletal myopathy using cellular and animal models.

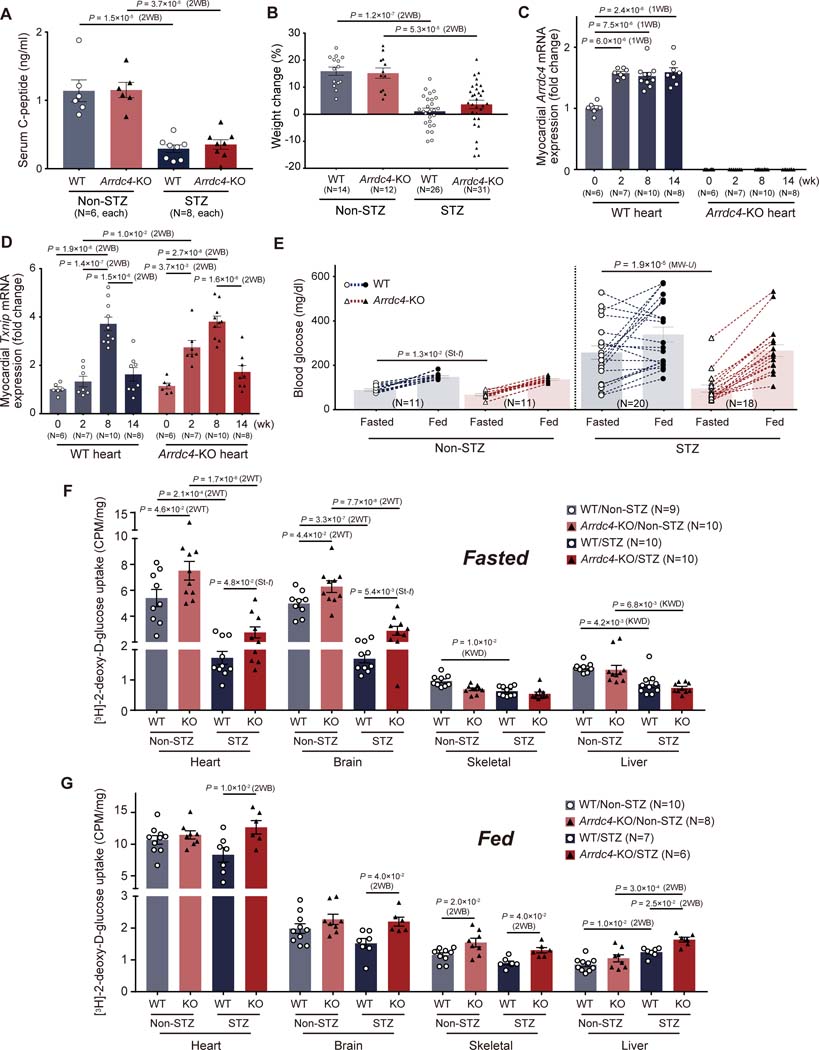
Results: High glucose promoted translocation of MondoA into the nucleus, which upregulated Arrdc4 transcriptional expression, increased lysosomal GLUT1 trafficking, and blocked glucose transport in cardiomyocytes, forming a feedback mechanism. This role of ARRDC4 was confirmed in human muscular cells from type 2 diabetic patients. Prolonged hyperglycemia upregulated myocardial Arrdc4 expression in multiple types of mouse models of diabetes. We analyzed hyperglycemia-induced cardiac and skeletal muscle abnormalities in insulin-deficient mice. Hyperglycemia increased advanced glycation end-products and elicited oxidative and endoplasmic reticulum stress leading to apoptosis in the heart and peripheral muscle. Deletion of Arrdc4 augmented tissue glucose transport and mitochondrial respiration, protecting the heart and muscle from tissue damage. Stress hemodynamic analysis and treadmill exhaustion test uncovered that Arrdc4-knockout mice had greater cardiac inotropic/chronotropic reserve with higher exercise endurance than wild-type animals under diabetes. While multiple organs were involved in the mechanism, cardiac-specific overexpression using an adenoassociated virus suggests that high levels of myocardial ARRDC4 have the potential to contribute to exercise intolerance by interfering with cardiac metabolism through its interaction with GLUT1 in diabetes. Importantly, the ARRDC4 mutation mouse line exhibited greater exercise tolerance, showing the potential therapeutic impact on diabetic cardiomyopathy by disrupting the interaction between ARRDC4 and GLUT1.

Conclusions: ARRDC4 regulates hyperglycemia-induced toxicities toward cardiac and skeletal muscle, revealing a new molecular framework that connects hyperglycemia to cardiac/skeletal myopathy to exercise intolerance.

Keywords: adaptor protein; diabetic cardiomyopathy; energy metabolism; exercise endurance; health.


Conflict of interest statement

None.

Figures

Figure 1.
Figure 1.. Glucose up-regulates Arrdc4 expression in cardiomyocytes.
A-E. Mouse neonatal cardiomyocytes from wild-type animals (A and B) or human skeletal muscle myoblasts donated from healthy individuals (C-E) were incubated with each type of monosaccharide sugar. Gene expression was quantified by quantitative PCR (A-C) and normalized to the level of β−Actin (1WB, one-way ANOVA post-hoc Bonferroni test). Protein expression (D and E) was analyzed by Western blot analysis and quantified by densitometry (MW-U, Mann-Whitney U test). F and G. The mRNA expression levels were measured by quantitative PCR in the heart tissues from streptozotocin (STZ) induced-, a combination of high-fat diet (HFD) and low dose STZ induced- or db/db diabetic mice. Values are normalized to the level of Actb and expressed as fold change concerning non-diabetic controls (St-t, t-test; MW-U, Mann-Whitney U test). H-J. Nuclear/cytoplasmic localization of MONDOA was analyzed in mouse neonatal cardiomyocytes by Western blot (H and I) and immunocytochemistry (J). Protein level was normalized by a subcellular marker and expressed as a relative ratio to osmolality control (St-t, t-test). Endogenous MONDOA was detected by an anti-MLXIP primary antibody followed by the secondary antibody conjugated with Texas Red (J). Blue, DAPI. Confocal images. Scale bars, 10 μm. K and L. Gene expression was quantified by quantitative PCR in mouse neonatal cardiomyocytes incubated in culture medium with the indicated pH level or in the presence of a MONDOA deactivator SBI-477 (10 μM) and expressed as fold change (1WB, one-way ANOVA post-hoc Bonferroni test; St-t, t-test). M. Cellular 2-[3H]deoxy-D-glucose uptake was measured by liquid scintillation counting in mouse neonatal cardiomyocytes in the presence of SBI-477 with or without adenoviral gene transfer of Arrdc4 or empty vector (EV). Uptake was normalized by total protein content (1WB, one-way ANOVA post-hoc Bonferroni test).
Figure 2.
Figure 2.. Hyperglycemia up-regulates Arrdc4 expression to inhibit tissue glucose uptake in mice.
A and B. Serum C-peptide levels and body weight change from baseline were assessed at eight weeks following induction of hyperglycemia by streptozotocin (STZ) in wild type (WT) and Arrdc4-knockout (KO) mice (2WB, two-way ANOVA post-hoc Bonferroni test). C and D. Gene expression was quantified throughout the course of diabetes by quantitative PCR in whole heart homogenates and expressed as fold change of baseline (1WB, one-way ANOVA post-hoc Bonferroni test; 2WB, two-way ANOVA post-hoc Bonferroni test). E. Blood glucose levels were measured in fasted and fed states in the same animals (St-t, t-test; MW-U, Mann-Whitney U test). F and G. 2-[3H]deoxy-D-glucose was injected intravenously (2 μCi/mL) into mice. After an equilibration period (2 hours), the radioactivity was measured in tissue homogenates by liquid scintillation counting and normalized to total protein content (2WT, two-way ANOVA post-hoc Tukey test; St-t, t-test; KWD, Kruskal-Wallis post-hoc Dunn’s test; 2WB, two-way ANOVA post-hoc Bonferroni test).
Figure 3.
Figure 3.. Arrdc4-knockout (KO) mice have greater cardiac reserve and exercise capacity under the diabetic condition.
A-E. Human AC16 cardiomyocytes were treated with adenoviral Arrdc4 or empty vector (EV) and cultured for 16 or 48 hours. Oxygen consumption rate (OCR) and extracellular acidification rate (ECAR) were measured by the Seahorse XFe24 analyzer (St-t, t-test). F. Adult mouse cardiomyocytes were isolated from wild-type (WT) or Arrdc4 knockout (KO) animals with or without streptozotocin (STZ)-induced diabetes (eight weeks post-STZ injections). Mitochondrial and glycolytic ATP production rates were measured by the Seahorse Extracellular Flux Analyzer (2WB, two-way ANOVA post-hoc Bonferroni test). G-I. Stress hemodynamic analysis uncovers the evidence of masked mechanical cardiac dysfunction by STZ-induced hyperglycemia. Hearts were perfused in a Langendorff mode, and left ventricular (LV) parameters were recorded during and after isoproterenol (0.05 μM) infusion (the P-values indicate the comparison between Arrdc4-KO/STZ vs. WT/STZ by two-way ANOVA with repeated measures followed by Bonferroni test). J-M. The treadmill exhaustion test evaluates exercise capacity and endurance in diabetic mice. Number of stimuli, distance to fatigue, and workload were measured during modified Bruce protocol with a speed of 15–36 cm/sec (KWD, Kruskal-Wallis post-hoc Dunn’s test; MW-U, Mann-Whitney U test; St-t, t-test). Blood lactate was measured from the tail vein blood before and after exercise (MW-U, Mann-Whitney U test). N. Muscular glycogen storage was quantified in quadricep homogenates and normalized by tissue weight (St-t, t-test).
Figure 4.
Figure 4.. Arrdc4-knockout (KO) mice are protected from diabetic stress.
A and B. The levels of advanced glycation end products or malondialdehyde were quantified in heart homogenates and normalized to total protein content at eight weeks following induction of hyperglycemia by streptozotocin (STZ) in wild-type (WT) and Arrdc4-KO mice (St-t, t-test). C-E. The mRNA expression levels were measured by quantitative PCR, normalized by the level of gapdh and expressed as fold change of WT non-STZ samples (2WB, two-way ANOVA post-hoc Bonferroni test; St-t, t-test). F and G. A marker for autophagosomes was detected immunocytochemically in permeabilized HT1080 cells incubated with or without 10% FBS, following adenoviral transduction of Arrdc4 (Ad-Arrdc4) or empty vector (Ad-EV). LC3 positive puncta were quantified by Alexa Fluor 488 against anti-LC3 antibody and normalized the number of nuclei (DAPI), and expressed as fold change from Ad-EV control incubated with 10% FBS (2WB, two-way ANOVA post-hoc Bonferroni test). Scale bars, 100 μm. H-I. Western blot analysis confirmed the increased proportion of LC3-II upon induction of autophagy in the mouse heart. The blots were quantified by densitometry (2WB, two-way ANOVA post-hoc Bonferroni test). J-M. TUNEL or cleaved caspase-3 positive apoptosis was quantified in paraffin-embedded heart sections by triple staining with TUNEL (green), anti-sarcomeric α actin (red), and DAPI (blue), or double staining with anti-cleaved caspase3 (green) and DAPI (blue), respectively. The data were quantified with ImageJ (2WB, two-way ANOVA post-hoc Bonferroni test). Scale bars, 100 μm.
Figure 5.
Figure 5.. Role of ARRDC4 in type 2 diabetic muscle and GLUT1 endocytosis.
A. The mRNA expression was quantified by quantitative PCR and normalized to the level of β-actin in quadriceps femoris from db/db and their heterozygous control mice (St-t, t-test). B-E. Gene expression was measured by the same method in human skeletal muscle myoblasts isolated from type 2 diabetic (T2D) donors or healthy donors. Values are expressed as fold change of each control (St-t, t-test; 2WB, two-way ANOVA post-hoc Bonferroni test). Cells were treated with metformin prior to incubating with high glucose (C and D). To detect the maximal effects of metformin on ARRDC4/TXNIP expression, 0.5 mM glucose control was used as a low expression standard. F and G. Small interfering RNA (siRNA)-mediated knockdown only achieved a mild reduction of ARRDC4 mRNA expression compared with nontargeting siRNA (CTRL, 100 nM), enough to augment 2-[3H]deoxy-D-glucose uptake in human myoblasts from T2D donors. Uptake was measured by liquid scintillation counting and normalized to total protein content (St-t, t-test). H. Upon triple transfection, confocal images demonstrate the co-localization between ARRDC4 and GLUT1 in HEK293 cells. Scale bars, 10 μm. I. GLUT1-mCherry fusion was co-expressed with ARRDC4 or empty vector (EV) in HEK293T cells. Lysosome was stained with green 488 fluorescent dye. Confocal live images show that ARRDC4 triggers endocytic trafficking of GLUT1 into lysosomes. Scale bars, 10 μm. J and K. Dual-fluorescence reporter for GLUT1 trafficking. In a normal condition, mCherry-pHluorin2-GLUT1 was localized at the plasma membrane in EV-expressed HEK293 cells; ARRDC4 stored GLUT1 into endosome. Further trafficking of GLUT1 underwent acidic degradation in lysosome, which emitted mCherry fluorescence signal alone, while pHluorin2 was quenched by the acidic pH (dash line area). Chloroquine (25 μM, 8 hr) inhibited lysosomal acidification and recovered the green fluorescence of pHluorin2. Scale bars, 10 μm.
Figure 6.
Figure 6.. Artificial Intelligence predicts structural flexibility of ARRDC4-GLUT1 interface.
A. Computational molecular dynamics (MD) simulation was applied to verify the binding pattern and structural flexibility between ARRDC4 and GLUT1. Representative snapshot images of the dynamic model in molecular docking. B-E. MD allows identifying the new binding interface, serine (Ser) 241 or arginine (Arg) 288 in ARRDC4 forming hydrogen bonds (yellow dash line) with glutamic acid (Glu) 393 or Glu 246 in GLUT1: OE1/OE2 as hydrogen acceptor atoms in Glu, while OG or NH1/NH2 as hydrogen donor atoms in Ser or Arg, respectively. The distance between donor and acceptor atoms is expressed as interatomic spacing. F-H. Interaction-defective (Int-def) ARRDC4 was created by mutating six amino acids to alanine. Wild-type (WT) mouse neonatal cardiomyocytes were infected with adeno-associated virus 9 (AAV9) to overexpress either empty vector (EV), WT or Int-def ARRDC4. Gene expression was measured by quantitative PCR, normalized to the level of β-actin, and expressed as fold change of endogenous Arrdc4 level (P=NS between WT and Int-def ARRDC4 by Mann-Whitney U test). 2-[3H]deoxy-D-glucose uptake was measured after a six-hour starvation period and normalized by total protein content (1WB, one-way ANOVA post-hoc Bonferroni test).
Figure 7.
Figure 7.. Cardiac-specific gene transfer of ARRDC4-GLUT1 interaction defective mutant reverses exercise intolerance by diabetes.
A. Experimental design of the reconstitution study with empty vector (EV), wild type (WT) ARRDC4 and interaction-defective (Int-def) ARRDC4 in Arrdc4-knockout mice using chicken cardiac troponin T (cTNT) promotor driven adeno-associated virus serotype 9. B and E. Gene expression was measured by quantitative PCR, normalized to the level of β-actin, and expressed as fold change of WT mouse heart (CTRL in B) or EV heart (in E) control (1WB, one-way ANOVA post-hoc Bonferroni test). C. Blood glucose was measured from the tail vein blood. P=N.S. among AAV9 vector types (two-way ANOVA post hoc Bonferroni test). D. Before sacrifice, 2-[3H]deoxy-D-glucose was injected intravenously (2 μCi/mL) into mice. After an equilibration period (2 hours), the radioactivity was measured in heart homogenates by liquid scintillation counting and normalized to total protein content (St-t, t-test). F-H. Exercise capacity was evaluated by the treadmill exhaustion test in AAV9-injected mice. Number of stimuli, distance to fatigue, and workload were measured during modified Bruce protocol with the speed 20–33 cm/sec (KWD, Kruskal-Wallis post-hoc Dunn’s test; 2WB, two-way ANOVA post-hoc Bonferroni test).

Similar articles

References

    1. Koch LG, Kemi OJ, Qi N, Leng SX, Bijma P, Gilligan LJ, Wilkinson JE, Wisloff H, Hoydal MA, Rolim N, Abadir PM, van Grevenhof EM, Smith GL, Burant CF, Ellingsen O, Britton SL and Wisloff U. Intrinsic aerobic capacity sets a divide for aging and longevity. Circ Res. 2011;109:1162–72. - PMC - PubMed
    1. Blair SN, Kohl HW 3rd, Paffenbarger RS Jr., Clark DG, Cooper KH and Gibbons LW. Physical fitness and all-cause mortality. A prospective study of healthy men and women. JAMA. 1989;262:2395–401. - PubMed
    1. Bertoni AG, Tsai A, Kasper EK and Brancati FL. Diabetes and idiopathic cardiomyopathy: a nationwide case-control study. Diabetes Care. 2003;26:2791–5. - PubMed
    1. MacDonald TL, Pattamaprapanont P, Pathak P, Fernandez N, Freitas EC, Hafida S, Mitri J, Britton SL, Koch LG and Lessard SJ. Hyperglycaemia is associated with impaired muscle signalling and aerobic adaptation to exercise. Nat Metab. 2020;2:902–917. - PMC - PubMed
    1. Gusso S, Pinto TE, Baldi JC, Robinson E, Cutfield WS and Hofman PL. Diastolic function is reduced in adolescents with type 1 diabetes in response to exercise. Diabetes Care. 2012;35:2089–94. - PMC - PubMed

MeSH terms

Substances