. 2024 Sep;11(33):e2402152.
doi: 10.1002/advs.202402152. Epub 2024 Jul 1.

Unraveling the Pathogenesis of Post-Stroke Depression in a Hemorrhagic Mouse Model through Frontal Lobe Circuitry and JAK-STAT Signaling

Affiliations

Unraveling the Pathogenesis of Post-Stroke Depression in a Hemorrhagic Mouse Model through Frontal Lobe Circuitry and JAK-STAT Signaling

Yingqing Wu et al. Adv Sci (Weinh). 2024 Sep.

Abstract

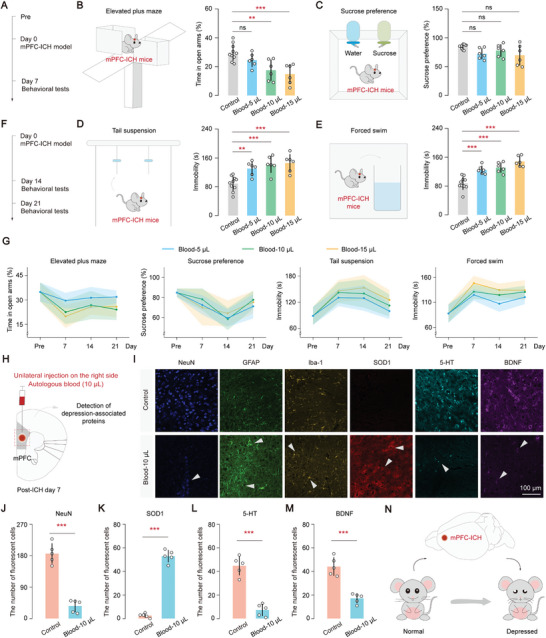
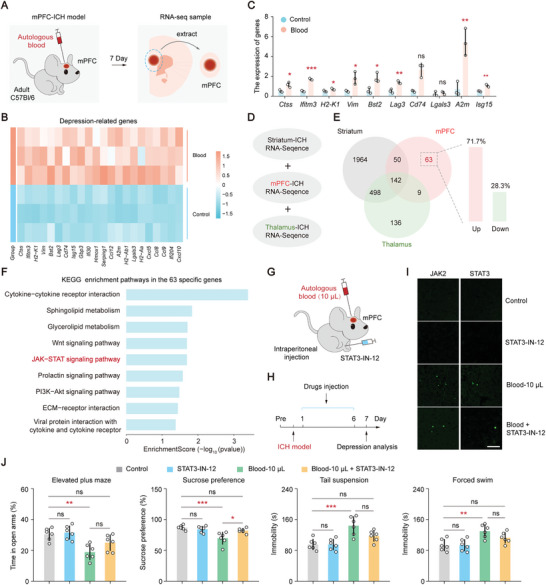
Post-stroke depression is a common complication that imposes significant burdens and challenges on patients. The occurrence of depression is often associated with frontal lobe hemorrhage, however, current understanding of the underlying mechanisms remains limited. Here, the pathogenic mechanisms associated with the circuitry connectivity, electrophysiological alterations, and molecular characteristics are investigated related to the frontal lobe in adult male mice following unilateral injection of blood in the medial prefrontal cortex (mPFC). It is demonstrated that depression is a specific neurological complication in the unilateral hematoma model of the mPFC, and the ventral tegmental area (VTA) shows a higher percentage of connectivity disruption compared to the lateral habenula (LHb) and striatum (STR). Additionally, long-range projections originating from the frontal lobe demonstrate higher damage percentages within the connections between each region and the mPFC. mPFC neurons reveal reduced neuronal excitability and altered synaptic communication. Furthermore, transcriptomic analysis identifies the involvement of the Janus Kinase-Signal Transducer and Activator of Transcription (JAK-STAT) signaling pathway, and targeting the JAK-STAT pathway significantly alleviates the severity of depressive symptoms. These findings improve the understanding of post-hemorrhagic depression and may guide the development of efficient treatments.

Keywords: circuitry connectivity; electrophysiological alterations; frontal lobe hemorrhage; hematoma volumes; post‐stroke depression.


Conflict of interest statement

The authors declare no conflict of interest.

Figures

Figure 1
Figure 1
Hematoma in the mPFC region leads to depressive complications in mice. A) Diagram illustrating the measurements of depression‐related behaviors on day 7 following hematoma in the mPFC of mice. B–E) Effect of different hematoma volumes on the elevated plus maze (B), sucrose preference (C), tail suspension (D), and forced swim (E) on post‐ICH day 7. Statistical analysis (one‐way ANOVA and Tukey's multiple comparison test): (B) elevated plus maze, P = 0.0003, P (Control, Blood 5 µL) = 0.3666, P (Control, Blood 10 µL) = 0.0041, P (Control, Blood 15 µL) = 0.0005; (C) Sucrose preference, P = 0.0555, P (Control, Blood 5 µL) = 0.1518, P (Control, Blood 10 µL) = 0.6392, P (Control, Blood 15 µL) = 0.0637; (D) Tail suspension, P < 0.0001, P (Control, Blood 5 µL) = 0.0061, P (Control, Blood 10 µL) = 0.0005, P (Control, Blood 15 µL) = 0.0002; (E) Forced swim, P < 0.0001, P (Control, Blood 5 µL) = 0.0005, P (Control, Blood 10 µL) < 0.0001, P (Control, Blood 15 µL) < 0.0001; F) Diagram illustrating the measurements of depression‐related behaviors on day 14 and day 21 following hematoma. G) Trend plot illustrating the impact of various hematoma volumes over time on the elevated plus maze, sucrose preference, tail suspension, and forced swim tests in these groups following hematoma in the mPFC. The periods studied included ICH‐pre, day 7, day 14, and day 21. H) Diagram illustrating the detection of depression‐associated proteins on day 7 following hematoma in the mPFC of mice. I) Changes in protein levels of depression markers, including neuron (NeuN), astrocytes (GFP), microglia (Iba‐1), superoxide dismutase1 (SOD1), 5‐hydroxytryptamine (5‐HT), and brain derived neurotrophic factor (BDNF). Scale bar, 100 µm. J–M) Number of fluorescent cells in different groups. Number of fluorescent cells was analyzed through Image J. Statistical analysis (unpaired t‐tests (parametric tests)): (J) Neuron (NeuN): “Control group”: 186.40, “Blood‐10 µL group”: 36.40. P (Control, Blood‐10 µL) < 0.0001; (K) Superoxide dismutase1 (SOD1): “Control group”: 2.60, “Blood‐10 µL group”: 53.00. P (Control, Blood‐10 µL) < 0.0001; (L) 5‐hydroxytryptamine (5‐HT): “Control group”: 44.80, “Blood‐10 µL group”: 7.40. P (Control, Blood‐10 µL) < 0.0001; (M) Brain derived neurotrophic factor (BDNF): “Control group”: 44.20, “Blood‐10 µL group”: 17.20. P (Control, Blood‐10 µL) = 0.0001. N) Hematoma in the mPFC region may lead to the development of neurological complications associated with depression in mice. Data are mean ± sd. In (A–G), control group, n = 10 mice; blood group, n = 6 mice. In (H‐M), each group, n = 5 mice. Not significant (ns), P < 0.01(**), and P < 0.001(***).
Figure 2
Figure 2
Depression emerges as a specific neurological complication resulting from hematoma in the mPFC region. A–D) Behavioral analysis of hemiplegia on different days with varying volumes of hematoma in the mPFC region. Hemiplegia analysis includes the basso mouse scale (A), beam walking test (B), modified pole test (C), and corner turn test (D). The baseline represents the mean of the control group. Statistical analysis: comparison of different blood groups with the control group on the same day was performed using one‐way ANOVA and Tukey's multiple comparison test. P > 0.05 indicates not significant. E,F) Behavioral analysis of sensory dysfunction on different days with varying volumes of hematoma in the mPFC. Sensory dysfunction contains thermal hyperalgesia (E) and cold hyperalgesia (F). The baseline represents the mean of the control group. Statistical analysis: Comparison of different blood groups with the control group on the same day was performed using one‐way ANOVA and Tukey's multiple comparison test. P > 0.05 indicates not significant. G) Diagram showing autologous blood injections in three different regions, namely mPFC, striatum, and thalamus, with the same hematoma volume. H–K) Scattered distribution of depression‐related behaviors observed after hematoma at various locations within the Blood 10 µL group (H and J). (I) Area of scatter distribution: “Striatum group” = 0.262, “Thalamus group” = 0.426, “mPFC group” = 1.75. One‐way ANOVA, P < 0.0001, Tukey's multiple comparisons test: P (Striatum, mPFC) < 0.0001, P (Thalamus, mPFC) < 0.0001; (K) Area of scatter distribution: “Striatum group” = 1.301, “Thalamus group” = 1.245, “mPFC group” = 2.711. One‐way ANOVA, P < 0.0001, Tukey's multiple comparisons test: P (Striatum, mPFC) < 0.0001, P (Thalamus, mPFC) < 0.0001. L–O) Scattered distribution of depression‐related behaviors observed after hematoma at various locations within the Blood 5 µL group (L and M) and the Blood 15 µL group (N and O). Data are mean ± sd. In (A‐O), each group, n = 6 mice. Not significant (ns) and P < 0.001(***).
Figure 3
Figure 3
VTA exhibits a higher percentage of connectivity disruption compared to the LHb and STR. A) Schematic diagram illustrating anterograde and retrograde virus injections following hematoma in the mPFC. B) Experimental timeline. C) Expression of anterograde and retrograde virus in injection sites following hematoma in the mPFC. Scale bar, 200 µm. Abbreviation. CG1: Cingulate cortex, area 1; PrL: anterior marginal cortex; IL: marginal hypocortex. D,E) Changes in fluorescence observed in corresponding brain regions along the ventral tegmental area (VTA) – mPFC depression circuit at varying volumes of hematoma. Scale bar, 100 µm. F) Relative fluorescence density (arbitrary units) of VTA near the hematoma in the four different groups. Statistical analysis: one‐way ANOVA, P < 0.0001, Tukey's multiple comparisons test: P (Control, Blood 5 µL) < 0.0001, P (Control, Blood 10 µL) < 0.0001, P (Control, Blood 15 µL) < 0.0001. G‐H) Changes in fluorescence observed in corresponding brain regions along the mPFC – lateral habenular nucleus (LHb) depression circuit at varying volumes of hematoma. Scale bar, 100 µm. I) Relative fluorescence density (arbitrary units) of LHb near the hematoma in the four different groups. Statistical analysis: one‐way ANOVA, P = 0.1731, Tukey's multiple comparisons test: P (Control, Blood 5 µL) = 0.5338, P (Control, Blood 10 µL) = 0.4480, P (Control, Blood 15 µL) = 0.1328. J,K) Changes in fluorescence observed in corresponding brain regions along the mPFC – striatum (STR) depression circuit at varying volumes of hematoma. Scale bar, 100 µm. L) Relative fluorescence density (arbitrary units) of STR near the hematoma in the different four groups. Statistical analysis: one‐way ANOVA, P = 0.0008, Tukey's multiple comparisons test: P (Control, Blood 5 µL) = 0.9699, P (Control, Blood 10 µL) = 0.9988, P (Control, Blood 15 µL) = 0.0015. M–O) Correlation analysis was conducted on the decline percentages of fluorescence density in three brain regions at different distances from the mPFC. A line with linear regression was fitted. (M) Blood 5 µL: R2 = 0.81, P = 0.0010, Y = 0.12*X – 0.14; (N) Blood 10 µL: R2 = 0.77, P = 0.0018, Y = 0.19*X – 0.25; (O) Blood 15 µL: R2 = 0.63, P = 0.0011, Y = 0.12*X + 0.11. In (D‐L), fluorescence density (% area) was analyzed using Default through Image J. Data are mean ± sd. In (D‐O), each group, n = 3 mice. Not significant (ns), P < 0.01(**), and P < 0.001(***).
Figure 4
Figure 4
Higher percentages of loss in long‐range projections following hematoma in the mPFC. A) Schematic diagram illustrating the mPFC whole‐brain circuit connection. The distance from the mPFC is classified into three parts: short, medium, and long. Abbreviation. CLA: claustrum; BLA: basal lateral amygdala; THAL: thalamus; PAG: Gray matter around the aqueduct. B) Changes in fluorescence observed in corresponding brain regions in the Ctx, CLA, BLA, and mPFC at varying volumes of hematoma. Scale bar, 100 µm. C) Heat map of the injury percentage for the mPFC whole‐brain circuit connection with varying distances from anterior‐posterior (AP) under different hematoma volumes. D–F) Linear fitted trend of the injury percentage for the mPFC whole‐brain circuit connection at varying distances from AP under different hematoma volumes. A line with linear regression was fitted. (D) Blood 5 µL: R2 = 0.74, P < 0.0001, Y = 0.11*X – 0.080; (E) Blood 10 µL: R2 = 0.76, P < 0.0001, Y = 0.17*X – 0.21; (F) Blood 15 µL: R2 = 0.69, P < 0.0001, Y = 0.14*X – 0.06. In (A–C), each group, n = 3 mice.
Figure 5
Figure 5
mPFC‐hematoma neurons exhibit a shorter duration and faster decay of action potentials. A) Diagram depicting the location of neurofilament light chain (NFL) within axons. B) Immunohistochemistry images showing the morphological changes of NFL near the hematoma in different groups. Scale bar, 20 µm. C) Relative fluorescence density (arbitrary units) of NFL near the hematoma in the four different groups. Statistical analysis: one‐way ANOVA, P < 0.0001, Tukey's multiple comparisons test: P (Control, Blood 5 µL) = 0.0032, P (Control, Blood 10 µL) = 0.0002, P (Control, Blood 15 µL) < 0.0001. Fluorescence density (% area) was analyzed using Default through Image J. D) A scheme depicting the whole‐cell patch‐clamp recording in vitro. E) Acute slice used for whole‐cell patch‐clamp recording in vitro. Scale bar: 30 µm. Responses of these cells to injected current pulses (−150, −100, −50, 0, 50, 100, 150 pA) were recorded. F) Typical traces of spontaneous action potentials (sAPs) in mPFC neurons from control and blood groups on post‐ICH day 3. G) Comparison of the resting membrane potential showed no significant difference between the control group (−71.5 mV) and the Blood‐10 µL group (−70.3 mV) (P = 0.64, unpaired t‐tests). H) Comparison of the input resistance revealed no significant difference between the control group (225.5 MΩ) and the Blood‐10 µL group (225.33 MΩ) (P = 0.99, unpaired t‐tests). I) Comparison of the AP peak amplitude showed no significant difference between the control group (86.65 mV) and the Blood‐10 µL group (91.29 mV) (P = 0.06, unpaired t‐tests). G) Comparison of the AP rising time showed no significant difference between the control group (2.39 ms) and the Blood‐10 µL group (2.32 ms) (P = 0.57, unpaired t‐tests). K) Comparison of the AP half‐width. “Control group”: 1.71, “Blood‐10 µL group”: 1.17. P (Control, Blood‐10 µL) = 0.0085, unpaired t‐tests (parametric tests). L) Comparison of the AP decay time. “Control group”: 1.74, “Blood‐10 µL group”: 1.21. P (Control, Blood‐10 µL) = 0.024, unpaired t‐tests (parametric tests). M) Comparison of the spike frequency. 100 pA: “Control group”: 22.5, “Blood‐10 µL group”: 18.33; 140 pA: “Control group”: 30, “Blood‐10 µL group”: 26.67; 180 pA: “Control group”: 36.25, “Blood‐10 µL group”: 32.22. 100 pA: P (Control, Blood‐10 µL) = 0.4746, unpaired t‐tests (parametric tests); 140 pA: P (Control, Blood‐10 µL) = 0.7102, unpaired t‐tests (nonparametric tests); 180 pA: P (Control, Blood‐10 µL) = 0.5128, unpaired t‐tests (parametric tests). N) I–V curves of two group data. Data are mean ± sd. In (A–C), each group, n = 6 mice. In (D‐N), the control group consisted of eight neurons recorded from three mice, blood group consisted of nine neurons recorded from three mice. Not significant (ns), P < 0.05(*), P < 0.01(**), and P < 0.001(***).
Figure 6
Figure 6
Targeting the JAK‐STAT pathway as a potential intervention for depressive symptoms resulting from hematoma in the mPFC. A) A diagram of RNA transcriptional sequencing analysis of hematoma in the mPFC on day 7. B) Heatmaps of depression‐related DEG expressed in control and blood groups. C) RT‐PCR analysis of depression‐related genes in control and blood groups showed the following results: P (Ctss) = 0.0160, P (Ifitm3) < 0.001, P (H2‐K1) = 0.0486, P (Vim) = 0.0225, P (Bst2) = 0.0160, P (Lag3) = 0.0035, P (Lgals3) = 0.4993, P (A2m) = 0.0059, P (Isg12) = 0.0023 (unpaired t‐tests, parametric tests); P (Cd74) = 0.1000 (unpaired t‐tests, nonparametric tests). D) Schematic diagram illustrating the screening of specific genes using three different ICH transcriptome datasets. E) Venn diagram comparing the differential expression of genes. The right panel shows the proportion of upregulated and downregulated genes among the 63 specific genes in the mPFC. F) KEGG enrichment pathways in the 63 specific genes after hematoma in the mPFC. G) Behavioral evaluation diagram of drug injection. H) Experimental timeline. I) Immunofluorescence images showing the expression of JAK2 and STAT3 proteins in various groups after the injection of JAK‐STAT pathway inhibitors. Bar, 100 µm. J) Behavioral analysis of depression conducted on day 7 showed the following results (one‐way ANOVA and Tukey's multiple comparison test): For elevated plus maze, P = 0.0006, P (Control, STAT3‐IN‐12) = 0.9806, P (Control, Blood 10 µL) = 0.0024, P (Control, Blood + STAT3) = 0.2256, P (Blood 10 µL, Blood + STAT3) = 0.1606; for sucrose preference, P = 0.0008, P (Control, STAT3‐IN‐12) = 0.8873, P (Control, Blood 10 µL) = 0.0009, P (Control, Blood + STAT3) = 0.5683, P (Blood 10 µL, Blood + STAT3) = 0.0166; for tail suspension, P = 0.0003, P (Control, STAT3‐IN‐12) > 0.9999, P (Control, Blood 10 µL) = 0.0006, P (Control, Blood + STAT3) = 0.1734, P (Blood 10 µL, Blood + STAT3) = 0.1737; for forced swim, P = 0.0017, P (Control, STAT3‐IN‐12) > 0.9999, P (Control, Blood 10 µL) = 0.0039, P (Control, Blood + STAT3) = 0.1991, P (Blood 10 µL, Blood + STAT3) = 0.2599. Data are mean ± sd. In (C) and (I), each group, n = 3 mice. In (J), each group, n = 6 mice. Not significant (ns), P < 0.05(*), P < 0.01(**), and P < 0.001(***).

Similar articles

Cited by

References

    1. Burvill P. W., Johnson G. A., Jamrozik K. D., Anderson C. S., Stewart‐Wynne E. G., Chakera T. M., Br J. Psychiatry 1995, 166, 328. - PubMed
    1. Balami J. S., Buchan A. M., Lancet Neurol. 2012, 11, 101. - PubMed
    1. a) Keins S., Abramson J. R., Mallick A., Castello J. P., Rodriguez‐Torres A., Popescu D., Hoffman D., Kourkoulis C., Gurol M. E., Greenberg S. M., Anderson C. D., Viswanathan A., Rosand J., Biffi A., Stroke 2023, 54, 105; - PMC - PubMed
    2. b) Kubiszewski P., Sugita L., Kourkoulis C., DiPucchio Z., Schwab K., Anderson C. D., Gurol M. E., Greenberg S. M., Viswanathan A., Rosand J., Biffi A., JAMA Neurol. 2020, 78, 61; - PMC - PubMed
    3. c) Stern‐Nezer S., Eyngorn I., Mlynash M., Snider R. W., Venkatsubramanian C., Wijman C. A. C., Buckwalter M. S., NeuroRehabilitation 2017, 41, 179. - PubMed
    1. Oestreich L. K., Lo J. W., Di Biase M. A., Sachdev P. S., Mok A. H., Wright P., Crawford J. D., Lam B., Traykov L., Kohler S., Staals J. E., van Oostenbrugge R., Chen C., Desmond D. W., Yu K. H., Lee M., Klimkowicz‐Mrowiec A., Bordet R., O'Sullivan M. J., Zalesky A., Psychiatry Clin. Neurosci. 2023, 78, 229. - PMC - PubMed
    1. a) Colita D., Burdusel D., Glavan D., Hermann D. M., Colita C. I., Colita E., Udristoiu I., Popa‐Wagner A., J. Affect Disord. 2024, 344, 149; - PubMed
    2. b) Wen L., Yan C., Si T., Huang L., Nie Y., Shen H., Qu M., Zhang X., J. Affect Disord. 2024, 347, 469. - PubMed

LinkOut - more resources