. 2024 Jun 6;6(1):vdae091.
doi: 10.1093/noajnl/vdae091. eCollection 2024 Jan-Dec.

In vivo modeling recapitulates radiotherapy delivery and late-effect profile for childhood medulloblastoma

Affiliations

In vivo modeling recapitulates radiotherapy delivery and late-effect profile for childhood medulloblastoma

Jemma Castle et al. Neurooncol Adv. .

Abstract

Background: Medulloblastoma (MB) is the most common malignant pediatric brain tumor, with 5-year survival rates > 70%. Cranial radiotherapy (CRT) to the whole brain, with posterior fossa boost (PFB), underpins treatment for non-infants; however, radiotherapeutic insult to the normal brain has deleterious consequences to neurocognitive and physical functioning, and causes accelerated aging/frailty. Approaches to ameliorate radiotherapy-induced late-effects are lacking and a paucity of appropriate model systems hinders their development.

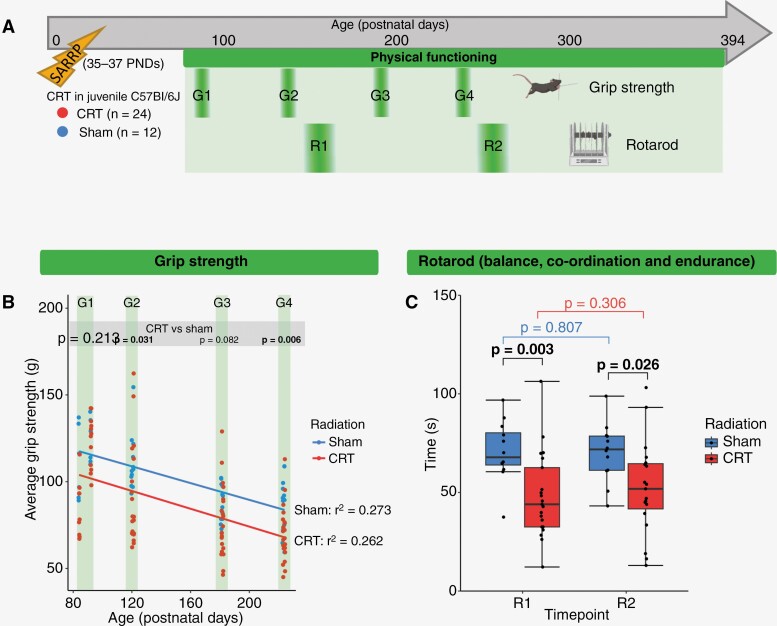
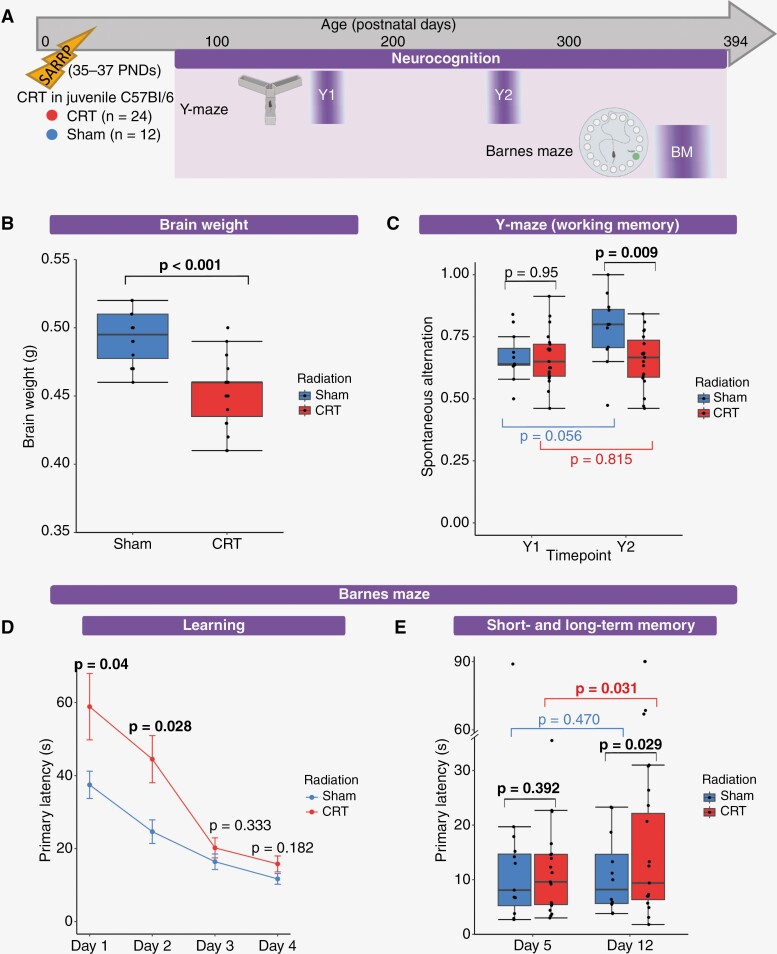
Methods: We have developed a clinically relevant in vivo model system that recapitulates the radiotherapy dose, targeting, and developmental stage of childhood medulloblastoma. Consistent with human regimens, age-equivalent (postnatal days 35-37) male C57Bl/6J mice received computerized tomography image-guided CRT (human-equivalent 37.5 Gy EQD2, n = 12) ± PFB (human-equivalent 48.7 Gy EQD2, n = 12), via the small animal radiation research platform and were longitudinally assessed for > 12 months.

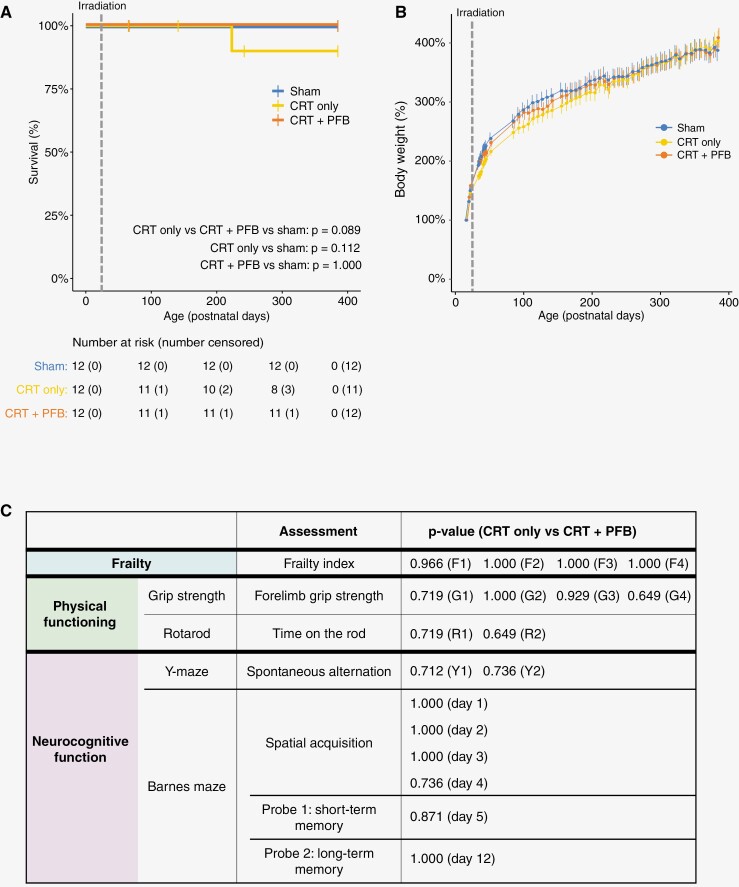
Results: CRT was well tolerated, independent of PFB receipt. Compared to a sham-irradiated group (n = 12), irradiated mice were significantly frailer following irradiation (frailty index; P = .0002) and had reduced physical functioning; time to fall from a rotating rod (rotarod; P = .026) and grip strength (P = .006) were significantly lower. Neurocognitive deficits were consistent with childhood MB survivors; irradiated mice displayed significantly worse working memory (Y-maze; P = .009) and exhibited spatial memory deficits (Barnes maze; P = .029). Receipt of PFB did not induce a more severe late-effect profile.

Conclusions: Our in vivo model mirrored childhood MB radiotherapy and recapitulated features observed in the late-effect profile of MB survivors. Our clinically relevant model will facilitate both the elucidation of novel/target mechanisms underpinning MB late effects and the development of novel interventions for their amelioration.

Keywords: late-effects; medulloblastoma; modelling; radiotherapy; survivorship.


Conflict of interest statement

The authors have no conflicts of interest to declare.

Figures

Figure 1.
Figure 1.
Schematic overview of the development of a clinically relevant, high-dose, targeted cranial-irradiation model. An overview of the study design. Juvenile C57Bl/6J mice (age 35–37 PNDs) received either CRT only (37.5 Gy human equivalent EQD2, n = 12), CRT + PFB (total dose of 48.75 Gy EQD2 to the posterior fossa, human-equivalent), or sham-irradiation (n = 12) via the small animal radiation research platform. Following irradiation, mice were subjected to longitudinal functional assessments. Assessments of frailty (frailty assessment at 4 timepoints [F1: ~PND 97, F2: ~PND 130, F3:~PND 191 and F4: ~PND 233]), neurocognition (Y-maze at 2 timepoints [Y1: ~PND 179 and Y2: ~PND 266] and Barnes maze [BM: ~PND 369]) and physical functioning (grip strength test at 4 timepoints [G1: ~PND 97, G2: ~PND 130, G3:~PND 191, and G4: ~PND 233] and RotaRod at 2 timepoints 1-2 [R1: ~PND 172 and R2: ~PND 249]) were carried out up to ~PND 394.
Figure 2.
Figure 2.
Clinically relevant, high-dose, targeted cranial irradiation is well tolerated and mice thrive independent of posterior fossa boost. (A) Kaplan–Meier plot of survival by cranial-radiation group. Deaths not related to radiation were right-censored (details are provided in Supplementary Table 4) Receipt of cranial irradiation is depicted by the dotted line. (B) Mean body weight (+ SEM) was measured at least weekly over the course of the study, pre- and post-irradiation (P-values given in Supplementary Table 5). The receipt of cranial irradiation is depicted by the dotted line. (C) Summary of the performance of CRT only versus CRT + PFB groups. Adjusted P-values following independent t-tests between CRT only and CRT + PFB for all assessments of frailty, physical functioning (grip strength and Rotarod), and neurocognition (Y-maze and Barnes maze). A full comparison of all measures tested is provided in Supplementary Tables 6A–C).
Figure 3.
Figure 3.
CRT drives accelerated development of frailty. (A) Timeline of longitudinal frailty assessment (F1: ~PND 97, F2: ~PND 130, F3: ~PND 191 and F4: ~PND 233). (B) Increased frailty scores following CRT. Heatmap showing frailty scores for all 30 frailty parameters following CRT or sham-irradiation. Individual frailty criteria were scored from 0 (no impairment, green) to 1 (severe frailty, red). Gray shading depicts missing data. Criterion are ordered from most commonly impaired to least commonly impaired (top to bottom). (C) CRT drives accelerated frailty. Mean frailty index (FI) following longitudinal frailty assessment at F1-4. Each point represents individual mice scores for CRT (red) and sham (blue) groups. Rate of frailty increase is higher in CRT-treated mice. Goodness of fit is denoted by r2, P-value represents linear regression. Significant P-values (P < .05) are in bold text. Examples of commonly impaired features following CRT or sham-irradiation: Are grimace and loss of fur color following CRT (D) and piloerection following CRT (E).
Figure 4.
Figure 4.
Physical functioning is impaired following cranial irradiation. (A) Timeline of longitudinal physical functioning assessment via the Grip Strength test (G1: ~PND 97, G2: ~PND 130, G3: ~PND 191 and G4: ~PND 233), and the RotaRod (R1: ~PND 172 and R2: ~PND 249). (B) Grip strength was poorer following CRT than sham-irradiation. Scatterplot showing longitudinal grip strength (mean of 3 attempts) at G1-4, where each point represents individual mice for CRT (red) and sham (blue) groups with linear regression fit lines. Significance was assessed via independent t-tests. Grip strength declines over time. Goodness of fit is denoted by r2. (C) Balance, coordination, and endurance are worse following CRT than sham-irradiation. Average time on the Rotarod (mean time across 6 trials) at R1 and R2. Each point represents individual mice. Significance was assessed via independent t-tests (black [at both R1 and R2]) and paired t-tests (red [R1 vs. R2 in the CRT group] and blue [R1 vs. R2 in the sham-irradiation group]). Significant P-values (P < .05) are in bold text.
Figure 5.
Figure 5.
CRT induces deficits in memory and learning. (A) Timeline of longitudinal neurocognitive assessment using the Y-maze (working memory [spontaneous alternation] at Y1: ~PND 179 and Y2: ~PND 266) and the Barnes maze (learning, short- and long-term memory [BM: ~PND 369]). (B) Brain weight is lower following CRT than sham-irradiation. Brain weight (g) at ~PND 394, where each point represents individual mice. Significance was assessed via independent t-test. (C) Working memory is poorer following CRT than sham-irradiation. Spontaneous alternation at Y1 and Y2, where each point represents individual mice. Significance was assessed via independent t-test (black [at both Y1 and Y2]) and paired t-tests (red [Y1 vs. Y2 in CRT group] and blue [Y1 vs. Y2 in sham-irradiation group]). (D) Mice receiving CRT showed initial learning deficits but overcame this by day 3. Mean time is taken to find the target hole (primary latency, s) during spatial acquisition (days 1–4, 4 trials per day). Significance was assessed via independent t-tests. (E) Following CRT mice had deficits in long-term memory but not short-term memory. Primary latency on day 5 (short-term memory, STM) and day 12 (long-term memory, LTM), where each point represents individual mice. Significance was assessed via independent t-tests (black [at both days 5 and 12]) and paired t-tests (red [day 5 vs. 12 in CRT group] and blue [days 5 vs. 12 in sham-irradiation group]). Significant P-values (P < .05) are in bold text.

Similar articles

References

    1. Childhood Cancer Statistics. England Annual report 2018. UK: Public Health England.
    1. Oeffinger KC, Mertens AC, Sklar CA, et al.; Childhood Cancer Survivor Study. Chronic health conditions in adult survivors of childhood cancer. N Engl J Med. 2006;355(15):1572–1582. - PubMed
    1. MacDonald C, Theurer JA, Doyle PC.. “Cured” but not “healed”: The application of principles of palliative care to cancer survivorship. Soc Sci Med. 2021;275(1):113802. - PubMed
    1. Khalil J, Chaabi S, Oberlin O, et al.. Medulloblastoma in childhood: What effects on neurocognitive functions? Cancer Radiother. 2019;23(5):370–377. - PubMed
    1. Limond JA, Bull KS, Calaminus G, et al.; Brain Tumour Quality of Survival Group, International Society of Paediatric Oncology (Europe; SIOP-E). Quality of survival assessment in European childhood brain tumour trials, for children aged 5 years and over. Eur J Paediatr Neurol. 2015;19(2):202–210. - PubMed

LinkOut - more resources