. 2024 Jun 24:19:6337-6358.
doi: 10.2147/IJN.S456545. eCollection 2024.

pH-Responsive Mesoporous Silica Nanoparticles Loaded with Naringin for Targeted Osteoclast Inhibition and Bone Regeneration

Affiliations

pH-Responsive Mesoporous Silica Nanoparticles Loaded with Naringin for Targeted Osteoclast Inhibition and Bone Regeneration

Shuwei Gong et al. Int J Nanomedicine. .

Abstract

Background: It is well-established that osteoclast activity is significantly influenced by fluctuations in intracellular pH. Consequently, a pH-sensitive gated nano-drug delivery system represents a promising therapeutic approach to mitigate osteoclast overactivity. Our prior research indicated that naringin, a natural flavonoid, effectively mitigates osteoclast activity. However, naringin showed low oral availability and short half-life, which hinders its clinical application. We developed a drug delivery system wherein chitosan, as gatekeepers, coats mesoporous silica nanoparticles loaded with naringin (CS@MSNs-Naringin). However, the inhibitory effects of CS@MSNs-Naringin on osteoclasts and the underlying mechanisms remain unclear, warranting further research.

Methods: First, we synthesized CS@MSNs-Naringin and conducted a comprehensive characterization. We also measured drug release rates in a pH gradient solution and verified its biosafety. Subsequently, we investigated the impact of CS@MSNs-Naringin on osteoclasts induced by bone marrow-derived macrophages, focusing on differentiation and bone resorption activity while exploring potential mechanisms. Finally, we established a rat model of bilateral critical-sized calvarial bone defects, in which CS@MSNs-Naringin was dispersed in GelMA hydrogel to achieve in situ drug delivery. We observed the ability of CS@MSNs-Naringin to promote bone regeneration and inhibit osteoclast activity in vivo.

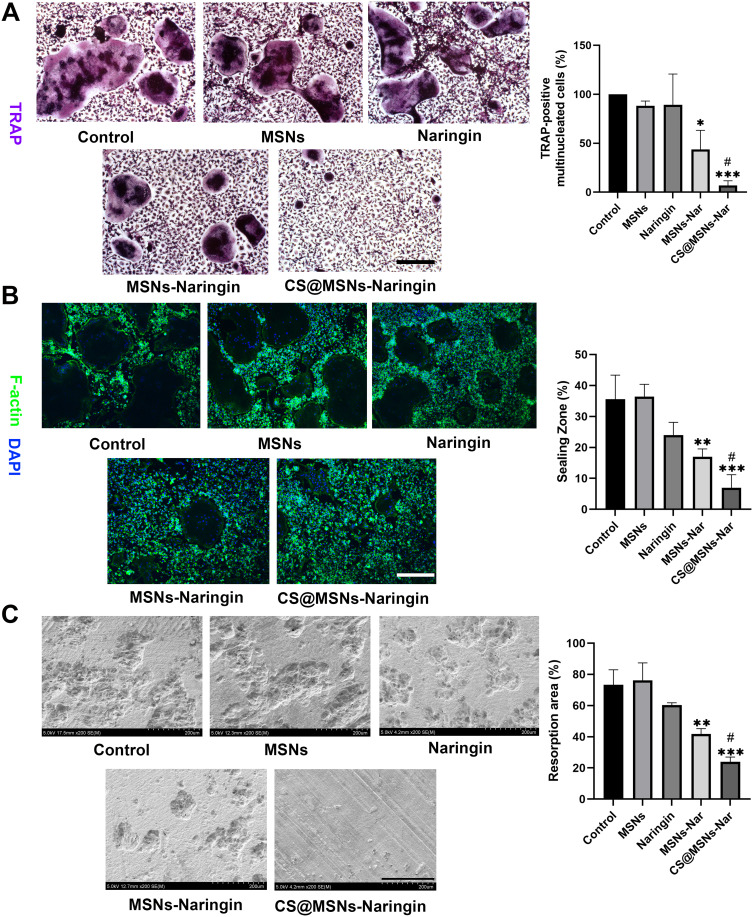
Results: CS@MSNs-Naringin exhibited high uniformity and dispersity, low cytotoxicity (concentration≤120 μg/mL), and significant pH sensitivity. In vitro, compared to Naringin and MSNs-Naringin, CS@MSNs-Naringin more effectively inhibited the formation and bone resorption activity of osteoclasts. This effect was accompanied by decreased phosphorylation of key factors in the NF-κB and MAPK signaling pathways, increased apoptosis levels, and a subsequent reduction in the production of osteoclast-specific genes and proteins. In vivo, CS@MSNs-Naringin outperformed Naringin and MSNs-Naringin, promoting new bone formation while inhibiting osteoclast activity to a greater extent.

Conclusion: Our research suggested that CS@MSNs-Naringin exhibited the strikingly ability to anti-osteoclasts in vitro and in vivo, moreover promoted bone regeneration in the calvarial bone defect.

Keywords: chitosan; mesoporous silica nanoparticles; naringin; osteoclast; pH-sensitive gated nano-drug delivery system.


Conflict of interest statement

The authors report no conflicts of interest in this work.

Figures

None
Graphical abstract
Figure 1
Figure 1
Characterization of MSNs, CS@MSNs, MSNs-Naringin, and CS@MSNs-Naringin. (A) The TEM images of MSNs and CS@MSNs-Naringin, (a) MSNs, 100nm Scale bar, (b) MSNs, 50nm Scale bar, (c) CS@MSNs-Naringin, 100nm Scale bar, (d) CS@MSNs-Naringin, 50nm Scale bar. (B) The BET images of MSNs, MSNs-Naringin, and CS@MSNs-Naringin. (C) The Zeta potential of MSNs, MSNs-Naringin(MSNs-Nar) and CS@MSNs-Naringin(CS@MSNs-Nar) (n=3). (D) The FTIR spectra of Naringin, MSNs, Chitosan, MSNs-Naringin, and CS@MSNs-Naringin. (E) The TGA thermograms of Naringin, MSNs, Chitosan, CS@MSNs, MSNs-Naringin, and CS@MSNs-Naringin. (F) The cumulative percentage release of naringin from CS@MSNs-Naringin at different pH (n=3). (G) The XPS of MSNs, CS@MSNs, MSNs-Naringin, CS@MSNs-Naringin.
Figure 2
Figure 2
Cytotoxicity of nanoparticles and the endocytosis ability of CS@MSNs-RhB. (A) Cytotoxicity of CS@MSNs-Naringin, MSNs-Naringin, and MSNs to BMMs at 24, 48, 72h. The data were expressed as mean±standard deviation and calculated by One Way AONVA. *: p<0.05; **: p<0.01; ***: p<0.001 compared to the control group. (B) Effect of CS@MSNs-RhB intervention 24h at 6 days of BMMs differentiation: (a) The concentration of CS@MSNs-RhB was 15μg/mL, (b) The concentration of CS@MSNs-RhB was 30μg/mL. Scale bar = 100 μm.
Figure 3
Figure 3
CS@MSNs-Naringin suppressed RANKL-stimulated osteoclastogenesis and the bone resorption activity of mature osteoclasts. (A) Drugs or different nanoparticles continued to interfere BMMs differentiation induced by RANKL (100ng/mL) for 7 days, mature osteoclasts were labeled purplish red, and cells with nuclei greater than or equal to 3 were counted to calculate the proportion of TRAP positive multinucleated cells. Scale bar = 100μm. (B) BMMs were incubated with RANKL (100ng/mL) plus drugs or different nanoparticles for 7 days. F-actin rings were observed by phalloidin staining, and the percentage of the total area was calculated. Scale bar = 100μm. (C) BMMs were incubated with RANKL (100ng/mL) plus drugs or different nanoparticles on the slice of bovine cortex bone for 7 days. The slice appearance was recorded by SEM, and the percentage of resorbed area was calculated. Scale bar = 200μm. *p<0.05; **p<0.01; ***p<0.001 compared to the control group. #p<0.05 compared to the MSNs-Naringin group.
Figure 4
Figure 4
CS@MSNs-Naringin suppressed the mRNA and protein expression levels of osteoclast-related genes and signal channels. (A) BMMs were incubated with RANKL (100ng/mL) plus drugs or different nanoparticles for 7 days. Expression levels of osteoclast-related mRNA compared with GAPDH. (B) Expression levels of key proteins in MAPK and NFκB signaling pathways by Western blotting. *p<0.05; **p<0.01; ***p<0.001 compared to the control group. #p<0.05, ##p<0.01, ###p<0.001 compared to the MSNs-Naringin group.
Figure 5
Figure 5
CS@MSNs-Naringin inhibited the nuclear translocation of NFATc1. BMMs were incubated with RANKL (100ng/mL) plus drugs or different nanoparticles for 7 days. NFATc1 is labeled green, F-actin red, and the nucleus blue. The fluorescence intensity of NFATc1 in the nucleus was quantified in terms of mean and standard deviation (n=3). **p<0.01; ***p<0.001 compared to the control group. ###p<0.001 compared to the MSNs-Naringin group. Scale bar=100μm.
Figure 6
Figure 6
CS@MSNs-Naringin promoted the apoptosis of osteoclasts and progenitors. (A) The expression of apoptosis-related proteins (Bcl-2, Bax, Cleaved-caspase 3) compared with β-actin by Western blotting. (B) BMMs were incubated with RANKL (100ng/mL) plus drugs or different nanoparticles for 7 days. TUNEL positive cells are marked red, and the percentage of positive cells was calculated. *p<0.05; **p<0.01, ***p<0.001 compared to the control group. #p<0.05, ###p<0.001 compared to the MSNs-Naringin group. Scale bar=100μm.
Figure 7
Figure 7
The characteristics of the GelMA hydrogel. (A) Photograph of different GelMA hydrogels. Scale bar=500mm. (B) The degradation rate of different GelMA hydrogels at 7, 14, and 21 days. (C) The stress-strain curve of different GelMA hydrogel. (D) The swelling rate of different GelMA hydrogels (n=3). *: p<0.05; **: p<0.01; ***: p<0.001 compared to the GelMA group. (E) The shape plasticity of GelMA and GelMA+CS@MSNs-Naringin hydrogel. (a) GelMA, (b) GelMA with CS@MSNs-Naringin. Scale bar=1cm. (F) SEM scanning of hydrogel section of GelMA and GelMA+CS@MSNs-Naringin. Scale bar=50μm.
Figure 8
Figure 8
Imaging and histomorphological analysis of calvarial bone in rats with bone defect. (A) 3D reconstruction images of Micro-CT, and the bone volume/total volume (BV/TV), bone surface area/bone volume (BSA/BV), trabecular separation (Tb.Sp), trabecular number (Tb.N), and trabecular thickness (Tb.Th) were analyzed (n=3). *p<0.05; **p<0.01, ***p<0.001 compared to the control group. #p<0.05 compared to the MSNs-Naringin group. (B and C) HE and Goldner staining of calvarial bone in rats with bone defect. Scale bar=500μm.
Figure 9
Figure 9
CS@MSNs-Naringin inhibits osteoclasts in vivo. (A) TRAP staining of calvarial bone in rats with bone defect. TRAP-positive cells are labeled purple and indicated by a black arrow. (B) Representative immunohistochemical images of NFATc1 and c-Fos expression. Positive cells are labeled brownish-yellow and indicated by a black arrow. *p<0.05; **p<0.01; ***p<0.001 compared to the Naringin group. ##p<0.01 compared to the MSN-Naringin group. (C) The TUNEL staining images of Naringin, MSNs-Naringin, CS@ MSNs-Naringin. *p<0.05; ***p<0.001 compared to the Naringin group. ##p<0.01 compared to the MSN-Naringin group.

References

    1. Kim JM, Lin C, Stavre Z, Greenblatt MB, Shim JH. Osteoblast-osteoclast communication and bone homeostasis. Cells. 2020;9(9):2073. doi:10.3390/cells9092073 - DOI - PMC - PubMed
    1. Udagawa N, Koide M, Nakamura M, et al. Osteoclast differentiation by RANKL and OPG signaling pathways. J Bone Miner Metab. 2021;39(1):19–26. doi:10.1007/s00774-020-01162-6 - DOI - PubMed
    1. Jacome-Galarza CE, Percin GI, Muller JT, et al. Developmental origin, functional maintenance and genetic rescue of osteoclasts. Nature. 2019;568(7753):541–545. doi:10.1038/s41586-019-1105-7 - DOI - PMC - PubMed
    1. Guo YF, Su T, Yang M, et al. The role of autophagy in bone homeostasis. J Cell Physiol. 2021;236(6):4152–4173. doi:10.1002/jcp.30111 - DOI - PubMed
    1. Da W, Tao L, Zhu Y. The Role of osteoclast energy metabolism in the occurrence and development of osteoporosis. Front Endocr. 2021;12:675385. doi:10.3389/fendo.2021.675385 - DOI - PMC - PubMed

MeSH terms