[Preprint]. 2024 Oct 16:2024.06.13.24308783.
doi: 10.1101/2024.06.13.24308783.

JAK inhibition decreases the autoimmune burden in Down syndrome

Affiliations

JAK inhibition decreases the autoimmune burden in Down syndrome

Angela L Rachubinski et al. medRxiv. .

Update in

  • JAK inhibition decreases the autoimmune burden in Down syndrome.
    Rachubinski AL, Wallace E, Gurnee E, Enriquez-Estrada BA, Worek KR, Smith KP, Araya P, Waugh KA, Granrath RE, Britton E, Lyford HR, Donovan MG, Eduthan NP, Hill AA, Martin B, Sullivan KD, Patel L, Fidler DJ, Galbraith MD, Dunnick CA, Norris DA, Espinosa JM. Rachubinski AL, et al. Elife. 2024 Dec 31;13:RP99323. doi: 10.7554/eLife.99323. Elife. 2024. PMID: 39737640 Free PMC article. Clinical Trial.

Abstract

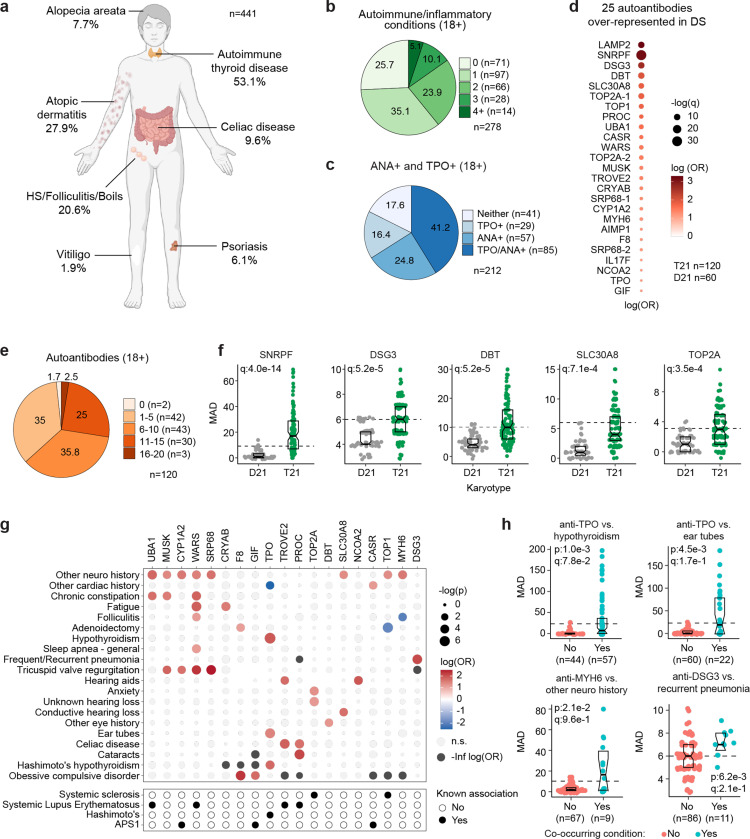
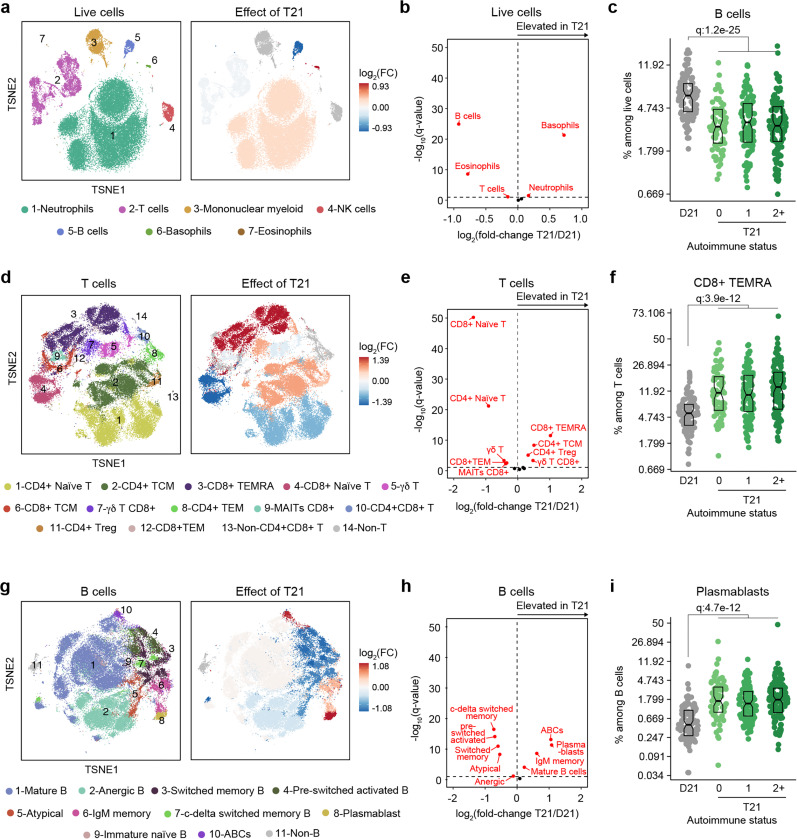
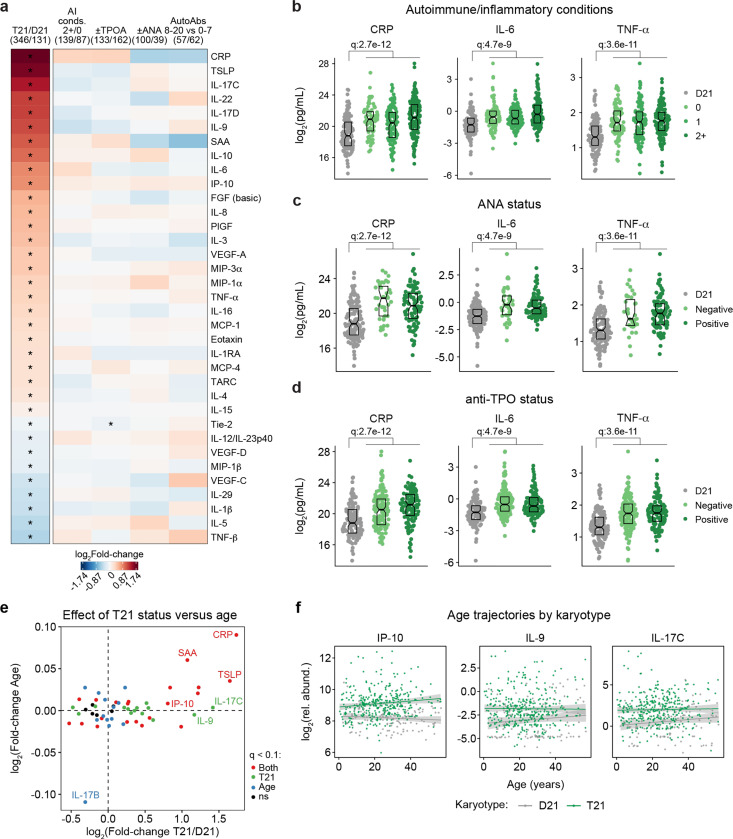
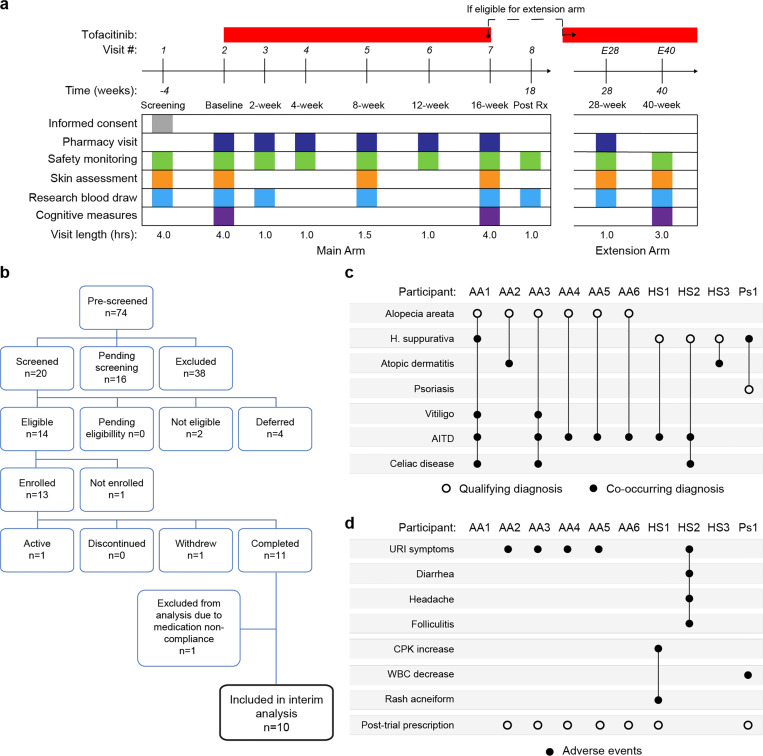
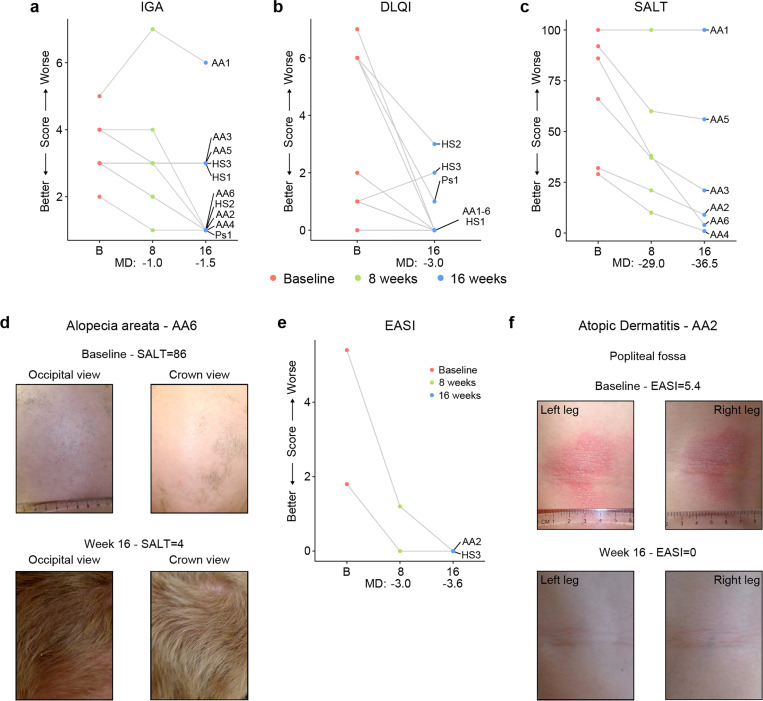
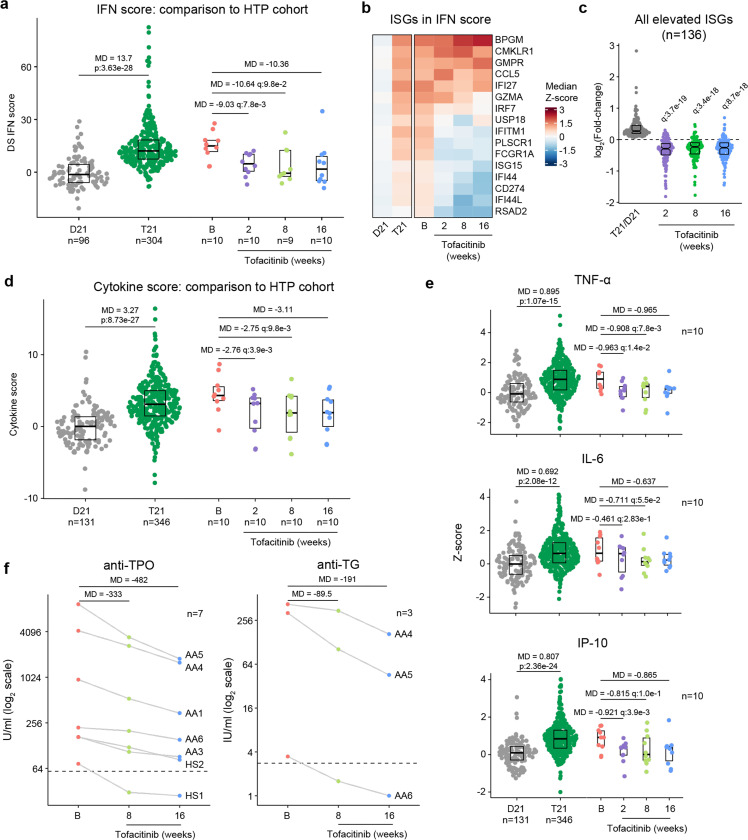
Individuals with Down syndrome (DS), the genetic condition caused by trisomy 21 (T21), display clear signs of immune dysregulation, including high rates of autoimmune disorders and severe complications from infections. Although it is well established that T21 causes increased interferon responses and JAK/STAT signaling, elevated autoantibodies, global immune remodeling, and hypercytokinemia, the interplay between these processes, the clinical manifestations of DS, and potential therapeutic interventions remain ill defined. Here, we report a comprehensive analysis of immune dysregulation at the clinical, cellular, and molecular level in hundreds of individuals with DS. We demonstrate multi-organ autoimmunity of pediatric onset concurrent with unexpected autoantibody-phenotype associations. Importantly, constitutive immune remodeling and hypercytokinemia occur from an early age prior to autoimmune diagnoses or autoantibody production. We then report the interim analysis of a Phase II clinical trial investigating the safety and efficacy of the JAK inhibitor tofacitinib through multiple clinical and molecular endpoints. Analysis of the first 10 participants to complete the 16-week study shows a good safety profile and no serious adverse events. Treatment reduced skin pathology in alopecia areata, psoriasis, and atopic dermatitis, while decreasing interferon scores, cytokine scores, and levels of pathogenic autoantibodies without overt immune suppression. Additional research is needed to define the effects of JAK inhibition on the broader developmental and clinical hallmarks of DS. ClinicalTrials.gov identifier: NCT04246372.


Conflict of interest statement

Competing Interests Statement: J.M.E. has provided consulting services for Eli Lilly Co., Gilead Sciences Inc., and Biohaven Pharmaceuticals and serves on the advisory board of Perha Pharmaceuticals. The remaining authors declare no competing interests.

Figures

Figure 1.
Figure 1.. Multi-organ autoimmunity and widespread autoantibody production in Down syndrome.
a, Overview of autoimmune and inflammatory conditions prevalent in persons with Down syndrome (DS) enrolled in the Human Trisome Project (HTP) cohort study. Percentages indicate the fraction of participants (n=441, all ages) with history of the indicated conditions. b, Pie chart showing autoimmune/inflammatory condition burden in adults (n=278, 18+ years old) with DS. c, Pie chart showing rates of positivity for anti-TPO and/or anti-nuclear antibodies (ANA) in adults (n=212, 18+ years old) with DS. d, Bubble plot displaying odds-ratios and significance for 25 autoantibodies with elevated rates of positivity in individuals with DS (n=120) versus 60 euploid controls (D21). q values calculated by Benjamini-Hochberg adjustment of p-values from Fisher’s exact test. e, Pie chart showing fractions of adults with DS (n=120, 18+ years old) testing positive for various numbers of the autoantibodies identified in d. f, Representative examples of autoantibodies more frequent in individuals with T21 (n=120) versus euploid controls (D21, n=60). MAD: median absolute deviation. Dashed lines indicate the positivity threshold of 90th percentile for D21. Data are presented as modified sina plots with boxes indicating quartiles. g, Bubble plots showing the relationship between autoantibody positivity and history of various clinical diagnoses in DS (n=120). Size of bubbles is proportional to -log-transformed p values from Fisher’s exact test. h, Sina plots displaying the levels of selected autoantibodies in individuals with DS with or without the indicated co-occurring conditions. MAD: median absolute deviation. Dashed lines indicate the positivity threshold of 90th percentile for D21. Sample sizes are indicated under each plot. q values calculated by Benjamini-Hochberg adjustment of p-values from Fisher’s exact tests.
Figure 2.
Figure 2.. Trisomy 21 causes global immune remodeling regardless of clinically evident autoimmunity.
a, t-distributed Stochastic Neighbor Embedding (t-SNE) plot displaying major immune populations identified by FlowSOM analysis of mass cytometry data for all live cells (left) and color coded by significant impact of T21 (beta regression q<0.1) on their relative frequency (right). Red indicates increased frequency and blue indicates decreased frequency among research participants with T21 (n=292) versus euploid controls (D21, n=96). b, Volcano plot showing the results of beta regression analysis of major immune cell populations among all live cells in research participants with T21 (n=292) versus euploid controls (D21, n=96). The dashed horizontal line indicates a significance threshold of 10% FDR (q<0.1) after Benjamini-Hochberg correction for multiple testing. c, Frequencies of B cells among all live cells in euploid controls (D21, n=96) versus individuals with T21 and history of 0 (n=69),1 (n=102) or 2+ (n=121) autoimmune/inflammatory conditions. Data is displayed as modified sina plotswith boxes indicating quartiles. d-f, Description as in a-c, but for subsets of T cells. g-i, Description asin a-c, but for subsets of B cells.
Figure 3.
Figure 3.. Trisomy 21 causes constitutive hypercytokinemia independent of autoimmunity status from an early age.
a, Heatmap displaying log2-transformed fold-changes for plasma immune markers with significant differences in trisomy 21 (T21, n=346) versus euploid (D21, n=131), and between different subgroups within the T21 cohort: history of 2+ (n=139) versus 0 (n=87) autoimmune/inflammatory conditions (AI conds.); TPO+ (n=133) versus TPO- (n=162); ANA+ (n=100) versus ANA- (n=39); or positivity for 8–20 (n=57) versus 0–7 (n=62) autoantibodies (AutoAbs) elevated in DS. Asterisks indicate linear regression significance after Benjamini-Hochberg correction for multiple testing (q<0.1, 10% FDR). b-d, Comparison of CRP, IL-6 and TNF-α levels in euploid controls (D21,n=131) versus subsets of individuals with T21 based on number of autoimmune/inflammatory conditions (b), ANA positivity (c) or TPO positivity (d). Data are presented as modified sina plots with boxes indicating quartiles. Samples sizes as in a. q-values indicate linear regression significance after Benjamini-Hochberg correction for multiple testing. e, Scatter plot comparing the effect of T21 karyotype versus the effect of age in individuals with T21 (n=54 immune markers in 346 individuals with T21), highlighting immune markers that are significantly different by T21 status, age, or both. ns: not significantly different by T21 status or age. f, Scatter plots for example immune markers that are significantly elevated in T21, but which are either not elevated with age in the euploid (D21) cohort (i.e.,IP-10), or in either the T21 (n=346) or D21 (n=131) cohorts. Lines represent least-squares linear fits with 95% confidence intervals in grey.
Figure 4.
Figure 4.. Clinical trial for JAK inhibition in Down syndrome.
a, Schedule of activities for clinical trial of JAK inhibition in Down syndrome (NCT04246372). b, Consort chart for first 13 participants enrolled in the clinical trial. c, Upset plot displaying the qualifying and co-occurring autoimmune/inflammatory conditions for the 10 participants included in the interim analysis. d, Upset plots summarizing the adverse events annotated for the first 10 participants over a 16-week treatment period.
Figure 5.
Figure 5.. Tofacitinib improves diverse immune skin pathologies in Down syndrome.
a-b, Investigator global assessment (IGA) scores (a) and Dermatological Life Quality Index (DLQI) scores (b) for the first 10 participants at baseline visit (B), mid-point (8 weeks) and endpoint (16 weeks) visits. MD: median difference. c, Severity of Alopecia Tool (SALT) scores for the first seven participants with alopecia areata in the trial. d, Images of participant AA6 at baseline versus week 16. e, Eczema Area and Severity Index (EASI) scores for two participants with mild atopic dermatitis. f, Images of participant AA2 showing improvement in atopic dermatitis upon tofacitinib treatment. p values not shown as per interim analysis plan.
Figure 6.
Figure 6.. Tofacitinib reduces IFN scores, hypercytokinemia, and pathogenic autoantibodies in Down syndrome.
a, Comparison of interferon (IFN) transcriptional scores derived from whole blood transcriptome data for research participants in the Human Trisome Project (HTP) cohort study by karyotype status (D21, grey; T21, green) and the clinical trial cohort at baseline (B), and weeks 2, 8 and 16 of tofacitinib treatment. Data are represented as modified sina plots with boxes indicating quartiles. Sample sizes are indicated below the x-axis. Horizontal bars indicate comparisons between groups with median differences (MD) with p-values from Mann-Whitney U-tests (HTP cohort) or q-values from paired Wilcox tests (clinical trial). q value for the 16-week endpoint is not shown as per interim analysis plan. b, Heatmap displaying median z-scores for the indicated groups (as in a) for the 16 interferon-stimulated genes (ISGs) used to calculate IFN scores. c, Analysis of fold changes for 136 ISGs not encoded on chr21 that are significantly elevated in Down syndrome (T21 versus D21) at 2, 8 and 16 weeks of tofacitinib treatment relative to baseline. Sample sizes as in a. q-values above each group indicate significance of Mann-Whitney U-tests against log2-transformed fold-change of 0 (no-chance), after Benjamini-Hochberg correction for multiple testing. d, Comparison of cytokine score distributions for the HTP cohort by karyotype status (D21, T21) versus the clinical trial cohort at baseline (B) and 2, 8 and 16 weeks of tofacitinib treatment. Data are represented as modified sina plots with boxes indicating quartiles. Sample sizes are indicated below the x-axis. Horizontal bars indicate comparisons between groups with median differences (MD) with p-values from Mann-Whitney U-tests (HTP cohort) and q-values from paired Wilcox tests (clinical trial). q value for the 16-week endpoint is not shown as per interim analysis plan. e, Comparison of plasma levels of cytokines in the HTP cohort by karyotype status (D21, T21) and the clinical trial cohort at baseline (B) versus 2, 8 and 16 weeks of tofacitinib treatment. Data are represented as modified sina plots with boxes indicating quartiles. Sample sizes are indicated below x-axis. Horizontal bars indicate comparisons between groups with median differences (MD) with p-values from Mann-Whitney U-tests (HTP cohort) and q values from paired Wilcox tests (clinical trial). q value for the 16-week endpoint is not shown as per interim analysis plan. f, Plots showing levels of autoantibodies against thyroid peroxidase (TPO) and thyroglobulin (TG) at baseline versus 8 and 16 weeks of tofacitinib treatment. Sample sizes are indicated in each plot.

References

    1. Lejeune J., Turpin R. & Gautier M. [Mongolism; a chromosomal disease (trisomy)]. Bull Acad Natl Med 143, 256–265 (1959). - PubMed
    1. Antonarakis S. E. et al. Down syndrome. Nature reviews. Disease primers 6, 9 (2020). 10.1038/s41572-019-0143-7 - DOI - PMC - PubMed
    1. Chicoine B. et al. Prevalence of Common Disease Conditions in a Large Cohort of Individuals With Down Syndrome in the United States. J Patient Cent Res Rev 8, 86–97 (2021). 10.17294/2330-0698.1824 - DOI - PMC - PubMed
    1. Amr N. H. Thyroid Disorders in Subjects with Down Syndrome: An Update. Acta Biomed 89, 132–139 (2018). 10.23750/abm.v89i1.7120 - DOI - PMC - PubMed
    1. Pierce M. J., LaFranchi S. H. & Pinter J. D. Characterization of Thyroid Abnormalities in a Large Cohort of Children with Down Syndrome. Hormone research in paediatrics 87, 170–178 (2017). 10.1159/000457952 - DOI - PMC - PubMed

Publication types

Associated data