This is a preprint.
Association of Childhood Exposure to School Racial Segregation with Late-Life Cognitive Outcomes among Older Americans
- PMID: 38947046
- PMCID: PMC11213034
- DOI: 10.1101/2024.06.21.24309186
Association of Childhood Exposure to School Racial Segregation with Late-Life Cognitive Outcomes among Older Americans
Abstract
Importance: Disparities in cognition, including dementia occurrence, persist between White and Black older adults, and are possibly influenced by early educational differences stemming from structural racism. However, the relationship between school racial segregation and later-life cognition remains underexplored.
Objective: To investigate the association between childhood contextual exposure to school racial segregation and cognitive outcomes in later life.
Design setting and participants: Data from 16,625 non-Hispanic White (hereafter, White) and 3,335 non-Hispanic Black (hereafter, Black) Americans aged 65 or older were analyzed from the Health and Retirement Study.
Exposures: State-level White-Black dissimilarity index for public elementary schools in the late 1960s (range: 0-100) was used to measure school segregation. States were categorized into high segregation (383.6) and low segregation (<83.6) based on the top quintile.
Main outcomes and measures: Cognitive scores, cognitive impairment (with or without dementia), and dementia were assessed using the Telephone Interview for Cognitive Status (TICS) and proxy assessment. Multilevel regression analyses were conducted, adjusting for demographic covariates, socioeconomic status, and health factors. Stratified analyses by race were performed.
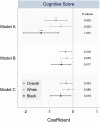
Results: The mean (SD) age of participants was 78.5 (5.7) years, and 11,208 (56.2%) were female. Participants exposed to high segregation exhibited lower cognitive scores (12.6 vs. 13.6; P<0.001) and higher prevalence of cognitive impairment (50.8% vs 41.4%; P<0.001) and dementia (26.0% vs. 19.5%; P<0.001), compared to those with low segregation exposure. Multilevel analyses revealed a significant negative association between school segregation and later-life cognitive even after adjusting sequentially for potential confounders, and these associations were stronger among Black than White participants. Notably, in the fully adjusted model, Black participants exposed to high segregation displayed significantly lower cognitive scores (-0.51; 95% CI: -0.94, -0.09) and higher likelihood of cognitive impairment (adjusted Odds Ratio [aOR]: 1.45, 95% CI: 1.22, 1.72) and dementia (aOR: 1.31, 95% CI: 1.06, 1.63).
Conclusions and relevance: Our study underscores that childhood exposure to state-level school segregation is associated with late-life cognition, especially for Black Americans. Given the rising trend of school segregation in the US, educational policies aimed at reducing segregation are crucial to address health inequities. Clinicians can leverage patients' early-life educational circumstances to promote screening, prevention, and management of cognitive disorders.
Keywords: School racial segregation; cognition; cognitive impairment; dementia; early life.
Figures


Similar articles
-
Exposure to School Racial Segregation and Late-Life Cognitive Outcomes.JAMA Netw Open. 2025 Jan 2;8(1):e2452713. doi: 10.1001/jamanetworkopen.2024.52713. JAMA Netw Open. 2025. PMID: 39752159 Free PMC article.
-
Racial and Ethnic Differences in Hospice Use and Hospitalizations at End-of-Life Among Medicare Beneficiaries With Dementia.JAMA Netw Open. 2022 Jun 1;5(6):e2216260. doi: 10.1001/jamanetworkopen.2022.16260. JAMA Netw Open. 2022. PMID: 35679046 Free PMC article.
-
Analysis of Residential Segregation and Racial and Ethnic Disparities in Severe Maternal Morbidity Before and During the COVID-19 Pandemic.JAMA Netw Open. 2022 Oct 3;5(10):e2237711. doi: 10.1001/jamanetworkopen.2022.37711. JAMA Netw Open. 2022. PMID: 36264572 Free PMC article.
-
Association of Race and Ethnicity With Late-Life Depression Severity, Symptom Burden, and Care.JAMA Netw Open. 2020 Mar 2;3(3):e201606. doi: 10.1001/jamanetworkopen.2020.1606. JAMA Netw Open. 2020. PMID: 32215634 Free PMC article.
-
State-Level Indicators of Childhood Educational Quality and Incident Dementia in Older Black and White Adults.JAMA Neurol. 2023 Apr 1;80(4):352-359. doi: 10.1001/jamaneurol.2022.5337. JAMA Neurol. 2023. PMID: 36780143 Free PMC article.
References
Publication types
Grants and funding
LinkOut - more resources
Full Text Sources
