

This is a preprint.
Multi-analyte proteomic analysis identifies blood-based neuroinflammation, cerebrovascular and synaptic biomarkers in preclinical Alzheimer's disease
- PMID: 38947065
- PMCID: PMC11213097
- DOI: 10.1101/2024.06.15.24308975
Multi-analyte proteomic analysis identifies blood-based neuroinflammation, cerebrovascular and synaptic biomarkers in preclinical Alzheimer's disease
Update in
-
Multi-analyte proteomic analysis identifies blood-based neuroinflammation, cerebrovascular and synaptic biomarkers in preclinical Alzheimer's disease.Mol Neurodegener. 2024 Oct 10;19(1):68. doi: 10.1186/s13024-024-00753-5. Mol Neurodegener. 2024. PMID: 39385222 Free PMC article.
Abstract
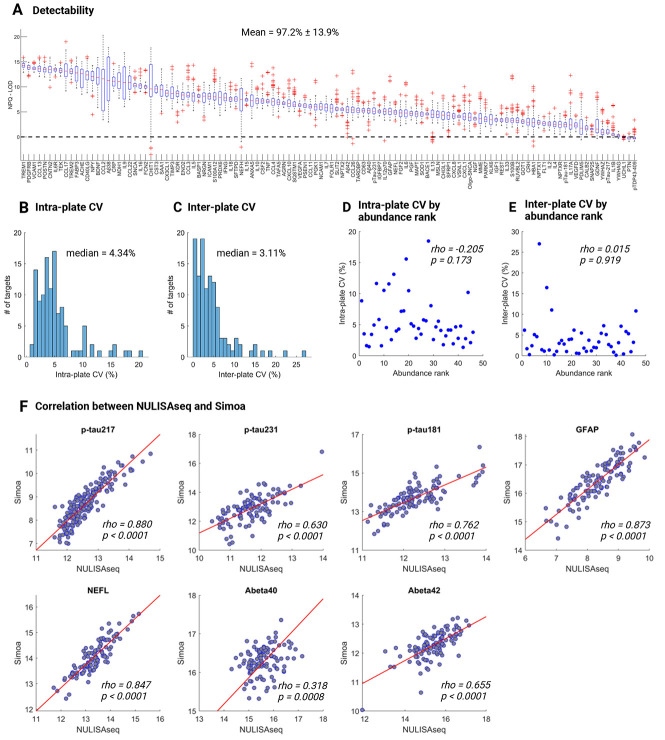
Background: Blood-based biomarkers are gaining grounds for Alzheimer's disease (AD) detection. However, two key obstacles need to be addressed: the lack of methods for multi-analyte assessments and the need for markers of neuroinflammation, vascular, and synaptic dysfunction. Here, we evaluated a novel multi-analyte biomarker platform, NULISAseq CNS disease panel, a multiplex NUcleic acid-linked Immuno-Sandwich Assay (NULISA) targeting ~120 analytes, including classical AD biomarkers and key proteins defining various disease hallmarks.
Methods: The NULISAseq panel was applied to 176 plasma samples from the MYHAT-NI cohort of cognitively normal participants from an economically underserved region in Western Pennsylvania. Classical AD biomarkers, including p-tau181 p-tau217, p-tau231, GFAP, NEFL, Aβ40, and Aβ42, were also measured using Single Molecule Array (Simoa). Amyloid pathology, tau pathology, and neurodegeneration were evaluated with [11C] PiB PET, [18F]AV-1451 PET, and MRI, respectively. Linear mixed models were used to examine cross-sectional and Wilcoxon rank sum tests for longitudinal associations between NULISA biomarkers and AD pathologies. Spearman correlations were used to compare NULISA and Simoa.
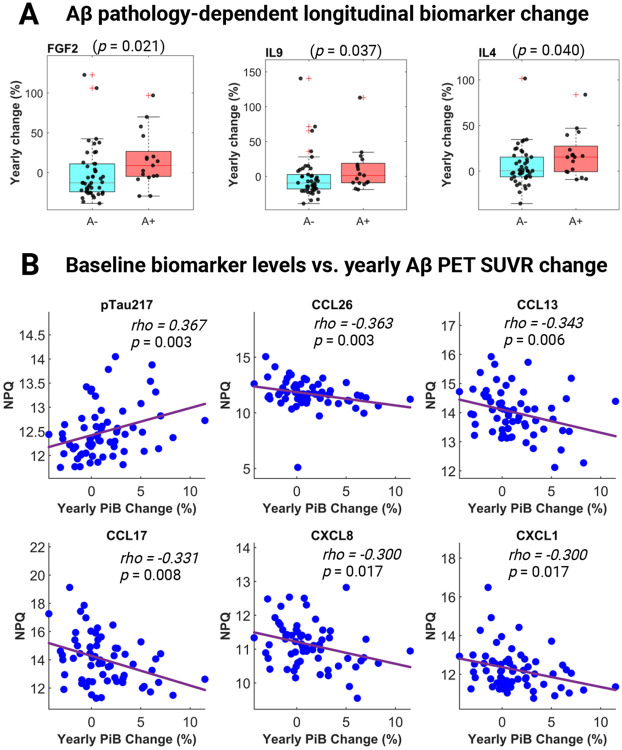
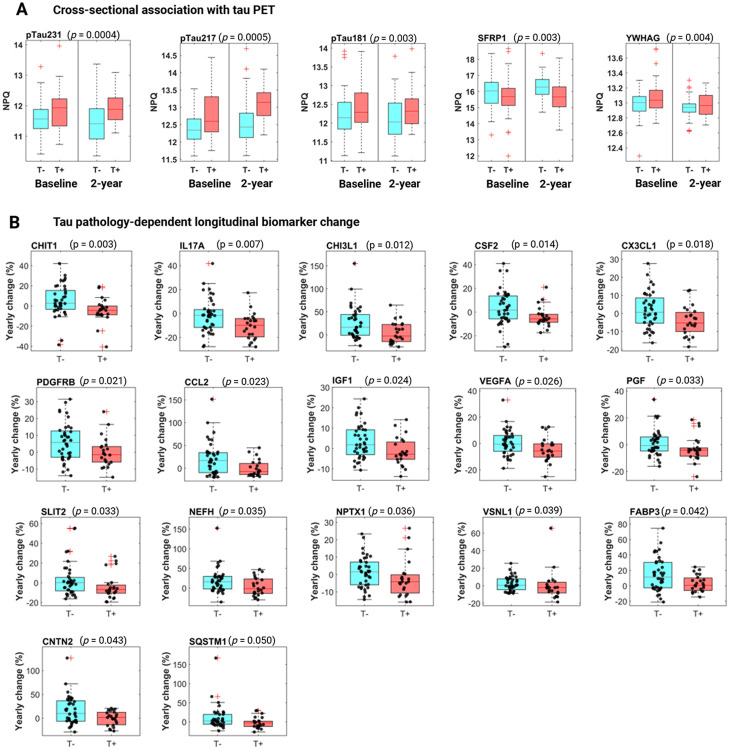
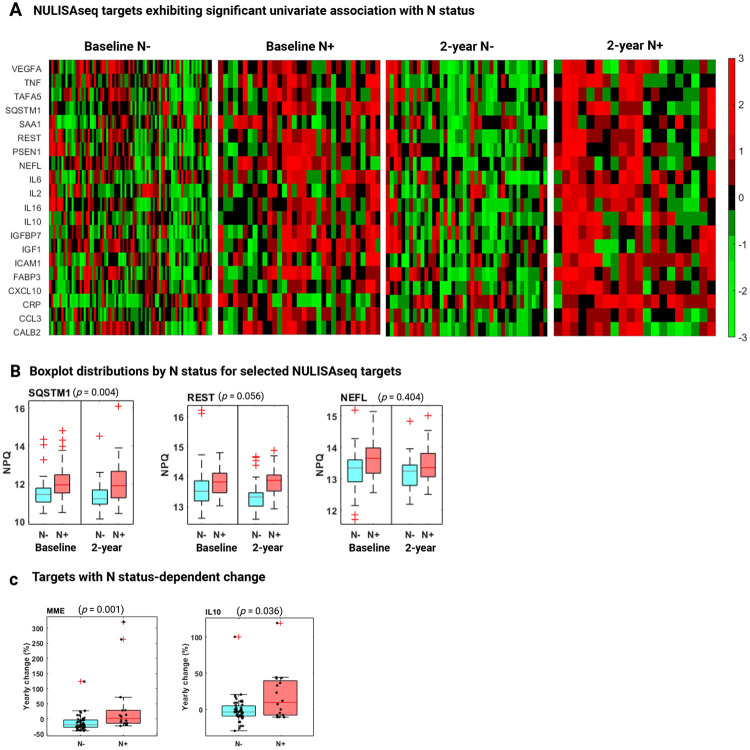
Results: NULISA concurrently measured 116 plasma biomarkers with good technical performance, and good correlation with Simoa measures. Cross-sectionally, p-tau217 was the top hit to identify Aβ pathology, with age, sex, and APOE genotype-adjusted AUC of 0.930 (95%CI: 0.878-0.983). Fourteen markers were significantly decreased in Aβ-PET+ participants, including TIMP3, which regulates brain Aβ production, the neurotrophic factor BDNF, the energy metabolism marker MDH1, and several cytokines. Longitudinally, FGF2, IL4, and IL9 exhibited Aβ PET-dependent yearly increases in Aβ-PET+ participants. Markers with tau PET-dependent longitudinal changes included the microglial activation marker CHIT1, the reactive astrogliosis marker CHI3L1, the synaptic protein NPTX1, and the cerebrovascular markers PGF, PDGFRB, and VEFGA; all previously linked to AD but only reliably measured in cerebrospinal fluid. SQSTM1, the autophagosome cargo protein, exhibited a significant association with neurodegeneration status after adjusting age, sex, and APOE ε4 genotype.
Conclusions: Together, our results demonstrate the feasibility and potential of immunoassay-based multiplexing to provide a comprehensive view of AD-associated proteomic changes. Further validation of the identified inflammation, synaptic, and vascular markers will be important for establishing disease state markers in asymptomatic AD.
Keywords: NULISA with next-generation sequencing readout (NULISAseq); NUcleic acid-Linked Immuno-Sandwich Assay (NULISA); Preclinical Alzheimer’s disease; amyloid pathology; neurodegeneration; plasma biomarkers; proteomics; tau pathology.
Figures

References
-
- Revised Criteria for Diagnosis and Staging of Alzheimer's Disease: Alzheimer’s Association Workgroup; [https://aaic.alz.org/diagnostic-criteria.asp] - PMC - PubMed
-
- Selkoe DJ: Alzheimer's disease is a synaptic failure. Science 2002, 298:789–791. - PubMed
-
- Masliah E: Mechanisms of synaptic dysfunction in Alzheimer's disease. Histol Histopathol 1995, 10:509–519 - PubMed
-
- Lleó A, Núñez-Llaves R, Alcolea D, Chiva C, Balateu-Paños D, Colom-Cadena M, Gomez-Giro G, Muñoz L, Querol-Vilaseca M, Pegueroles J, et al. : Changes in Synaptic Proteins Precede Neurodegeneration Markers in Preclinical Alzheimer's Disease Cerebrospinal Fluid. Mol Cell Proteomics 2019, 18:546–560. - PMC - PubMed
Publication types
Grants and funding
- R01 AG075336/AG/NIA NIH HHS/United States
- R01 AG052521/AG/NIA NIH HHS/United States
- R01 AG083874/AG/NIA NIH HHS/United States
- R01 AG072641/AG/NIA NIH HHS/United States
- P01 AG014449/AG/NIA NIH HHS/United States
- RF1 AG025516/AG/NIA NIH HHS/United States
- P30 AG066468/AG/NIA NIH HHS/United States
- R01 AG073267/AG/NIA NIH HHS/United States
- P01 AG025204/AG/NIA NIH HHS/United States
- R37 AG023651/AG/NIA NIH HHS/United States
- U24 AG082930/AG/NIA NIH HHS/United States
- R01 AG025516/AG/NIA NIH HHS/United States
- RF1 AG052525/AG/NIA NIH HHS/United States
- R01 AG053952/AG/NIA NIH HHS/United States
LinkOut - more resources
Full Text Sources
Research Materials
Miscellaneous