[Preprint]. 2024 Jun 11:rs.3.rs-4491589.
doi: 10.21203/rs.3.rs-4491589/v1.

Characterization of the family-level Borreliaceae pan-genome and development of an episomal typing protocol

Affiliations

Characterization of the family-level Borreliaceae pan-genome and development of an episomal typing protocol

Kayla M Socarras et al. Res Sq. .

Update in

Abstract

Background: The Borreliaceae family includes many obligate parasitic bacterial species which are etiologically associated with a myriad of zoonotic borrelioses including Lyme disease and vector-borne relapsing fevers. Infections by the Borreliaceae are difficult to detect by both direct and indirect methods, often leading to delayed and missed diagnoses. Efforts to improve diagnoses center around the development of molecular diagnostics (MDx), but due to deep tissue sequestration of the causative spirochaetes and the lack of persistent bacteremias, even MDx assays suffer from a lack of sensitivity. Additionally, the highly extensive genomic heterogeneity among isolates, even within the same species, contributes to the lack of assay sensitivity as single target assays cannot provide universal coverage. This within-species heterogeneity is partly due to differences in replicon repertoires and genomic structures that have likely arisen to support the complex Borreliaceae lifecycle in which these parasites have to survive in multiple hosts each with unique immune responses.

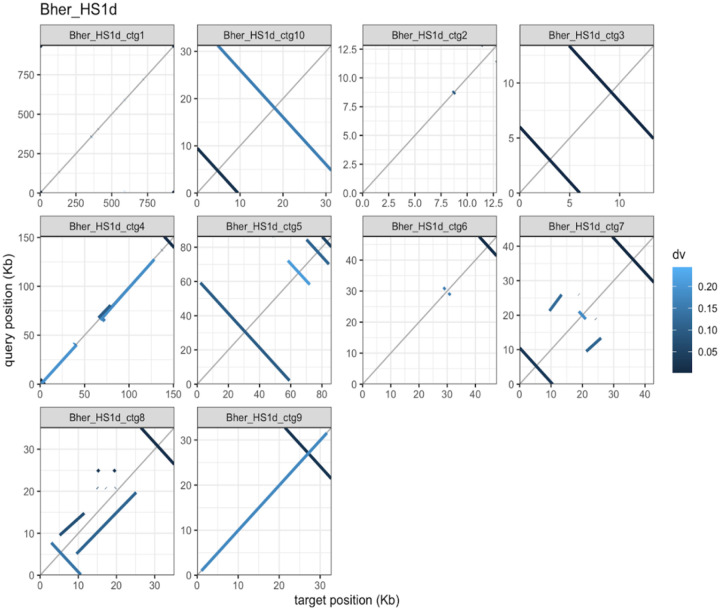
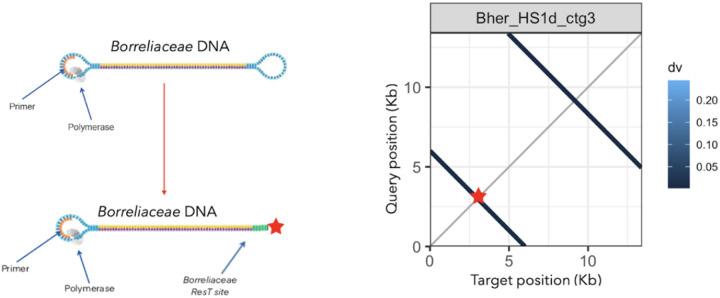
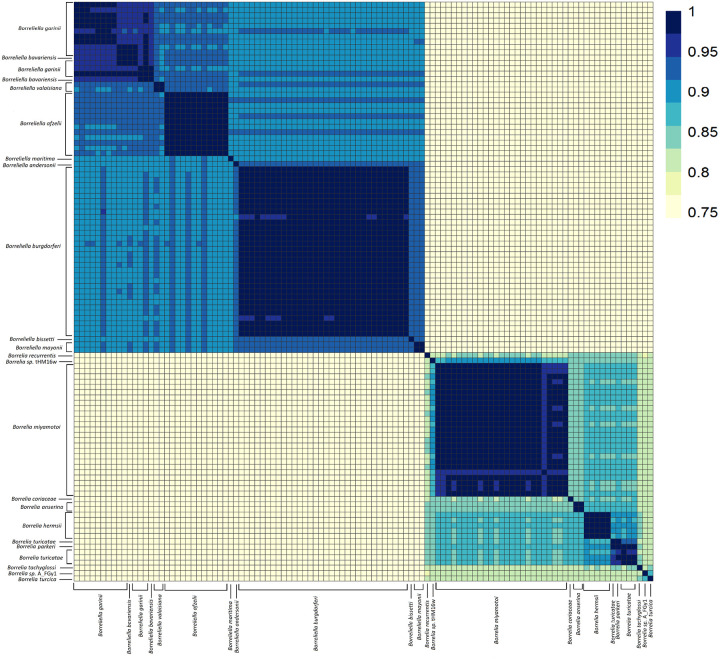
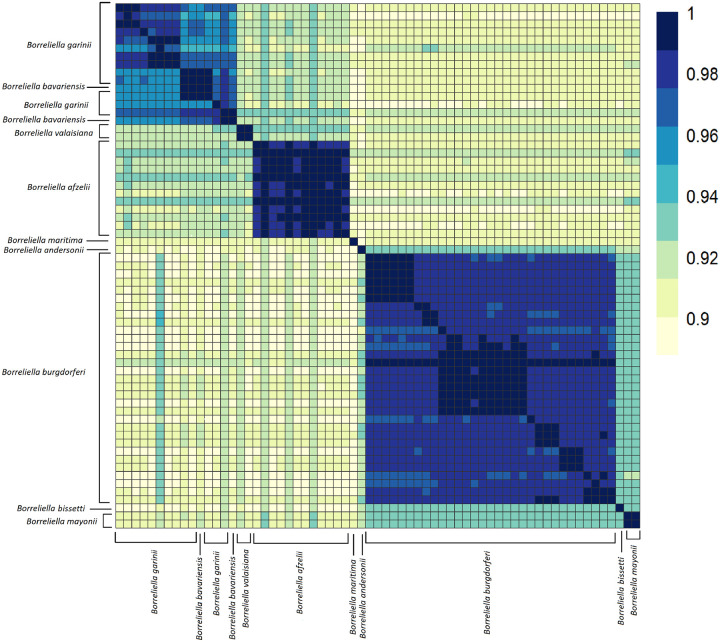
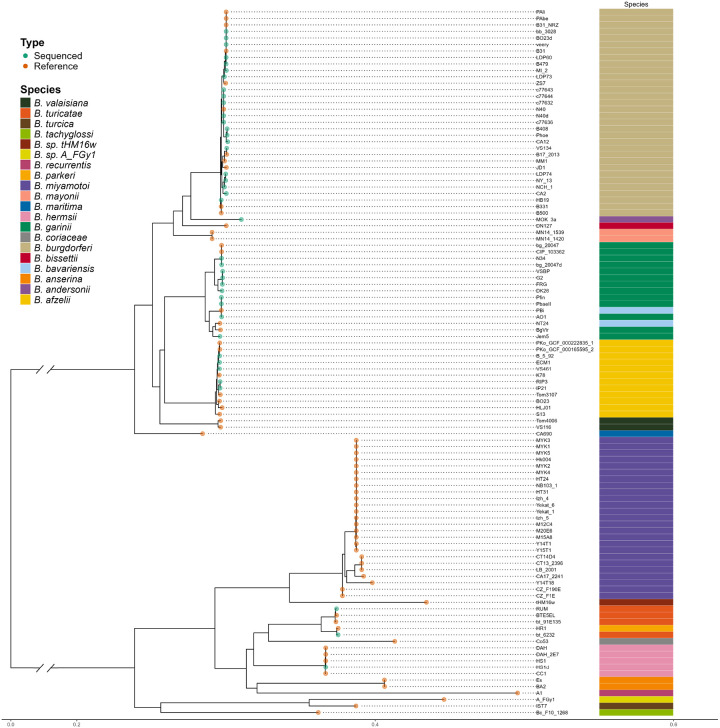
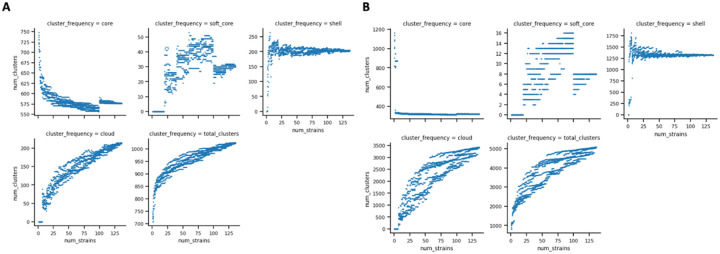
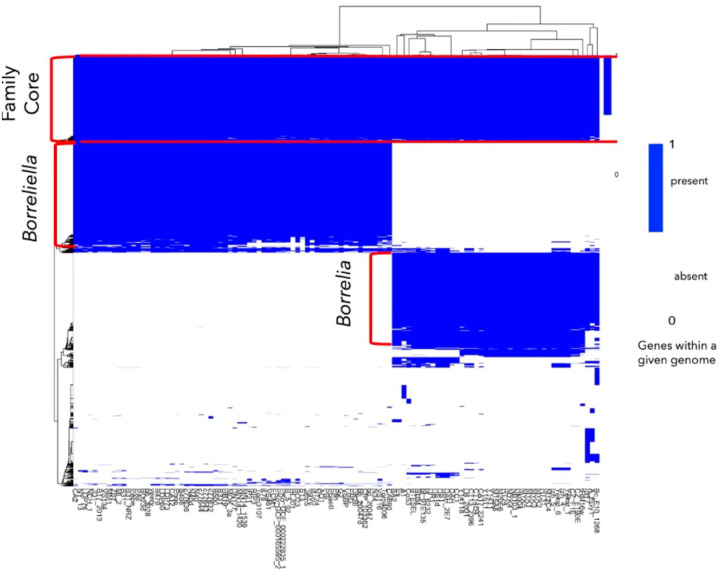
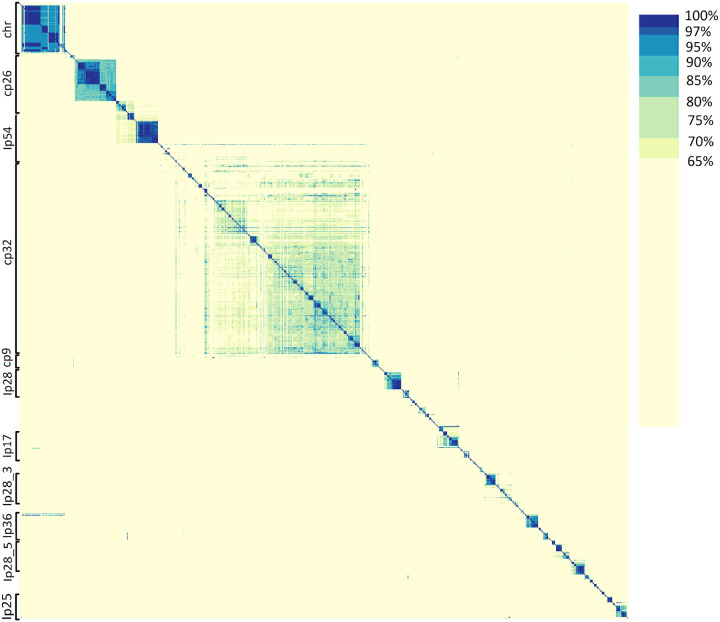
Results: We constructed a Borreliaceae family-level pangenome and characterized the phylogenetic relationships among the constituent taxa which supports the recent taxonomy of splitting the family into at least two genera. Gene content pro les were created for the majority of the Borreliaceae replicons, providing for the first time their unambiguous molecular typing.

Conclusion: Our characterization of the Borreliaceae pan-genome supports the splitting of the former Borrelia genus into two genera and provides for the phylogenetic placement of several non-species designated isolates. Mining this family-level pangenome will enable precision diagnostics corresponding to gene content-driven clinical outcomes while also providing targets for interventions.

Keywords: Borrelia; Borreliaceae; Borreliella; Spirochete; comparative genomics; distributed genome hypothesis; pan-genome; phylogenetics; supragenome; taxonomy.


Conflict of interest statement

Competing interests (NONE) Additional Declarations: No competing interests reported.

Figures

Figure 1
Figure 1
In silico sequencing validation of B. hermsii strain HS1 pair shows homology throughout several replicons and indicates regions of heterogeneity. Alignments of B. hermsii strain HS1 show nearly identical genomes. Similar pairwise locally colinear blocks are indicated in the same colors (pink to pink, blue to blue etc.). Contig breaks are indicated by red lines. b D-Genies dot plot of whole-genome complete reference B. hermsii strain HS1 (query, x-axis) to our sequenced B. hermsii strain HS1d (target, y-axis). Overall percent similarity was indicated from red (low = 0) to green (high = 100%). All contigs of the two whole genome sequences are portrayed in the figure. Each contig pair is separated by a dotted line. The position of the matches between strains is indicated by colored dots and lines (yellow, orange, green).
Figure 2
Figure 2
Self-alignment of B. hermsii strain HS1d contigs reveals inverted repeats at linear contig ends. A faceted pafr dot plot of each contig within the B. hermsii strain HS1d whole-genome sequence. The overall percent similarity was indicated from light blue (low = 0) to dark blue (high = 100%). All contigs were represented within each individual facet of the plot. Within each plot X and Y-axes are the overall lengths of the compared contigs.
Figure 3
Figure 3
Blast search of B. hermsii strain HS1 linear contigs reveals ResT site located on ends of sequenced replicons. A graphic depiction of Pacific Biosciences long-read sequencing platform and modified prepared Borreliaceae template. Alongside sequencing schematic is one of the faceted plots of B. hermsii strain HS1d (contig 3). This plot shows the percent similarity of replicon along its entire length with regions of similarity removed. Perpendicular lines are inverted repeats. The overall percent similarity was indicated from light blue (low = 0) to dark blue (high = 100%). All contigs were represented within each individual facet of the plot.
Figure 4
Figure 4
Average Nucleotide Identity of all Borreliaceae species and strains examined demonstrated genera-specific clustering. The range of ANI is from least (yellow) to greatest (blue). Each species is represented on the x- and y-axes. The diagonal line represents identity. The dendrograms were made with complete-linkage hierarchical clustering. The key color is noted on the right-hand side. The annotations indicate the generic groupings.
Figure 5
Figure 5
Average Nucleotide Identity analyses of Borreliella genomes shows a high degree of similarity amongst the major species of the genus. The range of ANI is from least (yellow) to greatest (blue). Each of the Borreliella spirochetes are represented on the x- and y-axes. The diagonal line represents identities. The dendrograms were made with complete-linkage hierarchical clustering. The color bar key is noted on the right-hand side. The annotations indicate the species group.
Figure 6
Figure 6
Average Nucleotide Identity of Borrelia genome spirochete shows separation of major species. The range of ANI is from least (yellow) to greatest (blue). Each Borrelia spirochete was represented on both axes. The diagonal line is where sample similarity values are to itself and beyond said line is for other genus members. Complete-linkage hierarchical clustering. The color bar key is noted on the right-hand side. The annotations indicate the species group.
Figure 7
Figure 7
Average Nucleotide Identity of reptile-associated Borrelia spirochetes suggests placement of non-species designated isolates. The range of ANI is from least (yellow) to greatest (blue). Each isolate is represented on the x- and y-axis. The diagonal line is where sample similarity values are to itself and beyond said line is for other genus members. Complete-linkage hierarchical clustering. The annotation color bars for each spirochete are noted on the right-hand side.
Figure 8
Figure 8
Midpoint rooted single-copy core gene tree of Borreliaceae shows the division between the Borreliella and Borrelia genera. The origin of the spirochete is annotated in blue (VCU) or red (NCBI) spheres at the nodes. The annotation bar indicates the species.
Figure 9
Figure 9
The gene cluster frequency of the Borreliaceae family pangenome reveals a large pangenome. Each colored circle signifies different components of the pangenome [core (blue), soft-core (orange), shell (green), and cloud (red)]. X-axis signifies the BlastP threshold. Y-axis signifies the number of genes within the pangenome.
Figure 10
Figure 10
Roary and EggNOG depict an expanding Borreliaceae pangenome over the number of included isolate genomes. X- axis represents the number of isolates and Y-axis represents the number of gene clusters within pangenome. Each panel-faceted plot is dedicated to different components of the pangenome. aRoary BlastP 75% was chosen as the threshold. Each light blue dot indicates an incorporated isolate. bEggNOG depiction of pangenome fluctuation with each incorporated genome.
Figure 11
Figure 11
Borreliaceae gene presence/absence heatmap. Genes are colored blue if present and white if absent. Homologs were defined as having Roary BlastP of 375%. Y-axis represents gene clusters within the Borreliaceae pangenome. X-axis depicts all Borreliaceae isolates. The red annotations indicate the gene groups. The Borreliaceae pangenome has a relatively small core with each of the two genera-defined core genomes being more than twice as large. Only the most prevalent of the distributed genes (not present in either of the three core genomes) are included in the heatmap.
Figure 12
Figure 12
Large-scale average nucleotide identity of Borreliaceae replicons reveals definitive groupings across the family. The range of ANI is from least (yellow) to greatest (blue). Each of the Borreliaceae replicons is represented on the x- and y-axes based on complete-linkage hierarchical clustering. The annotations indicate the replicon group.

References

    1. Shen K, Wang X, Post JC, Ehrlich GD. Molecular and Translational Research Approaches for the study of Bacterial Pathogenesis in Otitis Media. In: Rosenfeld R, Bluestone CD, editors. Evidence-based Otitis Media. 2nd ed. Hamilton, London: B.C. Decker Inc.; 2003. pp. 91–119.
    1. Ehrlich GD, Hu ZF, Post JC. Role for Biofilms in Infectious Disease. In: Ghannoum M, O’Toole GA, editors. Microbial Biofilms. Washington, D.C.: ASM; 2004. pp. 332–58.
    1. Ehrlich GD, Hu FZ, Shen K, Stoodley P, Post JC. Bacterial plurality as a general mechanism driving persistence in chronic infections. Clin Orthop Relat Res. 2005(437):20–4. - PMC - PubMed
    1. Ehrlich GD, Ahmed A, Earl J, Hiller NL, Costerton JW, Stoodley P, et al. The distributed genome hypothesis as a rubric for understanding evolution in situ during chronic bacterial biofilm infectious processes. FEMS Immunol Med Microbiol. 2010;59(3):269–79. - PMC - PubMed
    1. Shen K, Antalis P, Gladitz J, Sayeed S, Ahmed A, Yu S, et al. Identification, distribution, and expression of novel genes in 10 clinical isolates of nontypeable Haemophilus influenzae. Infect Immun. 2005;73(6):3479–91. - PMC - PubMed

Publication types

LinkOut - more resources