. 2024 Jun 19;3(6):e161.
doi: 10.1002/jex2.161. eCollection 2024 Jun.

Characterisation of sRNAs enriched in outer membrane vesicles of pathogenic Flavobacterium psychrophilum causing Bacterial Cold Water Disease in rainbow trout

Affiliations

Characterisation of sRNAs enriched in outer membrane vesicles of pathogenic Flavobacterium psychrophilum causing Bacterial Cold Water Disease in rainbow trout

Pratima Chapagain et al. J Extracell Biol. .

Abstract

Flavobacterium psychrophilum (Fp) causes Bacterial Cold Water Disease in salmonids. During host-pathogen interactions, gram-negative bacteria, such as Fp, release external membrane vesicles (OMVs) harbouring cargos, such as DNA, RNA and virulence factors. This study aimed to characterise the potential role of the OMVs' small RNAs (sRNAs) in the Fp-rainbow trout host-pathogen interactions. sRNAs carried within OMVs were isolated from Fp. RNA-Seq datasets from whole-cell Fp and their isolated OMVs indicated substantial enrichment of specific sRNAs in the OMVs compared to the parent cell. Many of the OMV-packaged sRNAs were located in the pathogenicity islands of Fp. Conservation of sRNAs in 65 strains with variable degrees of virulence was reported. Dual RNA-Seq of host and pathogen transcriptomes on day 5 post-infection of Fp -resistant and -susceptible rainbow trout genetic lines revealed correlated expression of OMV-packaged sRNAs and their predicted host's immune gene targets. In vitro, treatment of the rainbow trout epithelial cell line RTgill-W1 with OMVs showed signs of cytotoxicity accompanied by dynamic changes in the expression of host genes when profiled 24 h following treatment. The OMV-treated cells, similar to the Fp -resistant fish, showed downregulated expression of the suppressor of cytokine signalling 1 (SOCS1) gene, suggesting induction of phagosomal maturation. Other signs of modulating the host gene expression following OMV-treatment include favouring elements from the phagocytic, endocytic and antigen presentation pathways in addition to HSP70, HSP90 and cochaperone proteins, which provide evidence for a potential role of OMVs in boosting the host immune response. In conclusion, the study identified novel microbial targets and inherent characteristics of OMVs that could open up new avenues of treatment and prevention of fish infections.

Keywords: OMVs; disease resistance; fish; small RNAs.


Conflict of interest statement

The authors declare no conflicts of interest.

Figures

FIGURE 1
FIGURE 1
Overview of the experimental design to predict and validate bacterial small RNAs. Frozen stock cultures of Fp were cultured on TYEs agar, and the plate was incubated at 15°C for 1 week. Fp colonies isolated from TYEs agar plate were transferred to TYEs broth. For OMV isolation, broth culture tubes were centrifuged to pellet the bacterial cells, and the supernatant was collected and filtered to remove any remaining bacterial cells. The filtrate was then subjected to ultracentrifugation to pellet the OMVs. OMVs were characterised using NTA, followed by RNA sequencing on an Illumina MiSeq platform. Small RNAs were predicted using FlaiMapper and PresRAT, and validated by qPCR.
FIGURE 2
FIGURE 2
(a) A high‐quality image showing properly diluted scattered OMVs tracked using Nanoparticle Tracking Analysis (NTA). (b) The absolute number of particles of each diameter is plotted. The plot displays a single peak that represents the most frequently measured size of particles, which is slightly smaller than the average size of 235.9 nm indicated by the red dots. (c) RNase A facilitates degradation of free RNA associated with the external surface of OMVs, whereas internal RNA in intact OMVs is protected from degradation. RNA attached to the OMV surface (external) and isolated from the intact, RNase A‐treated OMVs (internal) were used to quantify the abundance of soFE013584 and soFE090116. The sRNAs were significantly more abundant (indicated by lower CT values) inside OMVs (p‐value ≤ 0.01).
FIGURE 3
FIGURE 3
Genomic pathogenicity islands (clusters of genes that play a role in microbial adaptability) of Fp predicted by either IslandPath‐DIMOB alone (Blue) or integrated methods (at least two methods, Red). The green window indicates the location of two sRNAs, soFE129980 and soFE125260, within genomic PAIs. Color‐coded arrows representing the physical location of genes within PAIs are annotated at the bottom of the figure, where the red arrows indicate sRNAs.
FIGURE 4
FIGURE 4
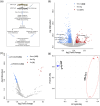
(a) Whole‐body dual RNA‐seq. Fish were intraperitoneally injected with Fp as previously described by Marancik et al. (2014). Total RNA was isolated from fish collected on day 5 post‐infection and processed for sequencing. Sequence reads were separated, in silico, by mapping to the rainbow trout and Fp genomes to identify DE transcripts and hub genes during host‐pathogen interactions. (b and c) Volcano plots showing the host transcripts (mRNAs & lncRNAs) and bacterial sRNAs, respectively, differentially expressed on day 5 following Fp infection in selectively bred, resistant‐ versus susceptible‐line rainbow trout. The red dots represent the upregulated transcripts in the resistant line, whereas the blue dots represent the downregulated transcripts at FDR ≤ 0.05. Two sRNAs named in the figure, located in the PAIs, were among the most upregulated sRNAs in the susceptible genetic line. (d) Principal component analysis of OMV‐specific sRNAs obtained from 8 RNA‐seq datasets generated from selectively bred, resistant‐ and susceptible‐line rainbow trout on day 5 post‐infection. Each round dot represents a single RNA‐seq dataset color‐coded by a genetic line.
FIGURE 5
FIGURE 5
(a) Gene expression network of DE bacterial sRNAs (triangular nodes) and DE host transcripts (mRNAs ‛circular nodes’ and lncRNAs ‛rectangular nodes’) (R > 0.85 or <−0.85). DE transcripts are clustered into two groups based on their fold change, with the upregulated transcripts in the BCWD‐resistant genetic line represented in red and the downregulated transcripts represented in blue. (b) A heat map showing the expression profile of 25 DE sRNAs between resistant (R) and susceptible (S) genetic lines. (c) Interaction network between 3 bacterial sRNAs (blue), including the OMV‐specific sRNA soFE090858, exhibited reciprocal expression with two isoforms encoding trichohyalin (LOC110510487_1 & LOC110510487_2). (d) Interaction network between 4 sRNAs negatively correlated in expression with transcripts encoding SOCS1 & SOCS3. The SOCS transcripts were downregulated in resistant fish. The sRNA in the centre of the figure (soFE095462) is located in PAI. (e) A heat map showing the expression profile of the SOCS transcripts and negatively correlated sRNAs in resistant (R) and susceptible (S) genetic lines. (f) Interaction network of ANAPC13_1 (red circle); the top downregulated transcript with known functions in susceptible fish on day 5 post‐infection. ANAPC13_1 exhibited target interaction and negative correlation in expression with 6 sRNAs located in PAI or enriched in OMVs. LncRNA Omy300040532 likely mediates the interaction between most of these sRNAs and ANAPC13_1.
FIGURE 6
FIGURE 6
(a) Overview of PrestoBlue cell viability assay in RTgill‐W1 cells after different time durations of OMVs treatment. Approximately 500,000 cells/well were seeded in 96‐well plates for 24 h. Cells were then treated with OMVs or Nuclease‐free water (NFW; control group) for 0 min, 6, 12 and 24 h at 18°C. Cell culture medium was used as a blank for the PrestoBlue Assay. PrestoBlue reagent was added to wells, followed by incubation at appropriate temperatures and absorbance measurement at 570 nm wavelength to determine cell viability. (b) PrestoBlue cell viability assay in OMVs treated RTgill‐W1 cells showed that the cytotoxicity increases with increased time duration of OMVs exposure. Significant cytotoxicity was observed at 12 and 24 h (p < 0.05). (c) Approximately 1.2 × 10⁶ RTgill‐W1 cells/well were seeded in 6‐well tissue culture plates and maintained overnight at 18°C. Cells were exposed to either OMVs or NFW (control group) for 6, 12 and 24 h at 18°C. The media from the ‛control’ and ‛treated’ cell wells were removed, and cells were washed, trypsinised and then lysed with Trizol reagent for RNA extraction and sequencing on day 1 post‐treatment. (d) A Volcano plot showing the host transcripts DE on day 1 following OMVs treatment in RTgill‐W1 cells. The red dots represent the upregulated transcripts in the OMV‐treated cells, whereas the blue dots represent the downregulated transcripts at FDR ≤0.05. Heat maps showing DE transcripts involved in chaperones and folding catalysts (e), membrane trafficking and endocytic pathway (f) and phagocytosis and antigen processing and presentation (g).
FIGURE 7
FIGURE 7
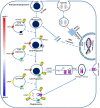
A proposed model showing modulation of the endocytic pathway by bacteria and OMVs under reciprocal regulation of SOCS1. Bacteria likely suppress phagosome maturation and lysosome fusion by upregulating the expression of the host SOCS1, as reported in Klopfenstein et al. (2020). On the contrary, phagosome maturation is likely enhanced by the downregulation of the host SOCS1 in response to OMVs treatment. The phagosome acquires Rab5 and EEA1 via fusion with early endosomes. Upregulation of EEA1 triggers fusion of the phagosome and late endosome. During the phagosome maturation process, a suite of other proteins is recruited, including Rab7, V‐ATPase and lysosome‐associated membrane glycoprotein (LAMP), which facilitates the fusion of lysosomes with the mature phagosome forming a phagolysosome. Degraded antigenic peptides by the proteasome (cytosolic pathway; not shown) are transported to the endoplasmic reticulum (ER) and loaded onto MHC‐I molecules. Whereas degraded antigenic peptides by phagosome (vacuolar pathway) can be loaded onto itinerant MHC‐I molecules within the phagosome. Dashed arrows indicate processes suggested in this study, and solid arrows refer to processes supported by information from the literature.

References

    1. Abbas, S. Z. , Qadir, M. I. , & Muhammad, S. A. (2020). Systems‐level differential gene expression analysis reveals new genetic variants of oral cancer. Scientific Reports, 10, 14667. - PMC - PubMed
    1. Abendroth, U. , Schmidtke, C. , & Bonas, U. (2014). Small non‐coding RNAs in plant‐pathogenic Xanthomonas spp. RNA Biology, 11, 457–463. - PMC - PubMed
    1. Ali, A. , Al‐Tobasei, R. , Kenney, B. , Leeds, T. D. , & Salem, M. (2018). Integrated analysis of lncRNA and mRNA expression in rainbow trout families showing variation in muscle growth and fillet quality traits. Scientific Reports, 8, 12111. - PMC - PubMed
    1. Ali, A. , & Salem, M. (2022). Genome‐wide identification of antisense lncRNAs and their association with susceptibility to Flavobacterium psychrophilum in rainbow trout. Frontiers in Immunology, 13, 1050722. - PMC - PubMed
    1. Ali, A. , Thorgaard, G. H. , & Salem, M. (2021). PacBio iso‐seq improves the rainbow trout genome annotation and identifies alternative splicing associated with economically important phenotypes. Frontiers in Genetics, 12, 683408. - PMC - PubMed