. 2024 Apr 26;27(6):109798.
doi: 10.1016/j.isci.2024.109798. eCollection 2024 Jun 21.

GSK2334470 attenuates high salt-exacerbated rheumatoid arthritis progression by restoring Th17/Treg homeostasis

Affiliations

GSK2334470 attenuates high salt-exacerbated rheumatoid arthritis progression by restoring Th17/Treg homeostasis

Qian Mo et al. iScience. .

Abstract

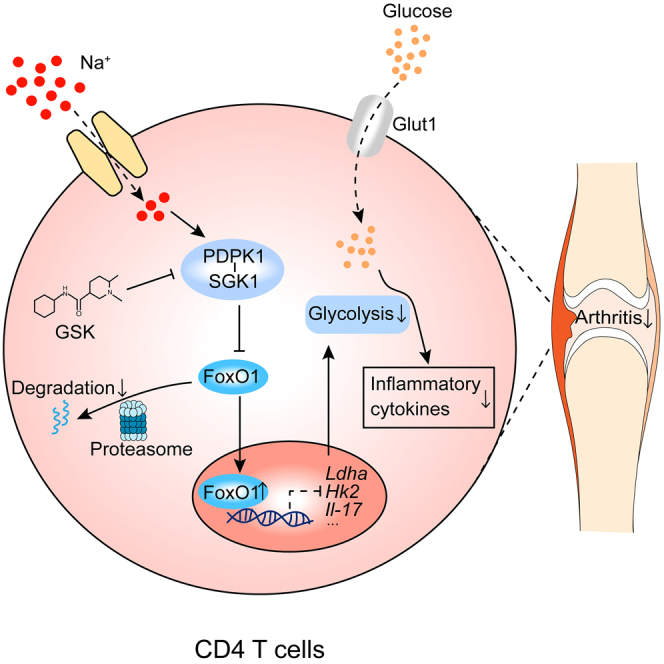
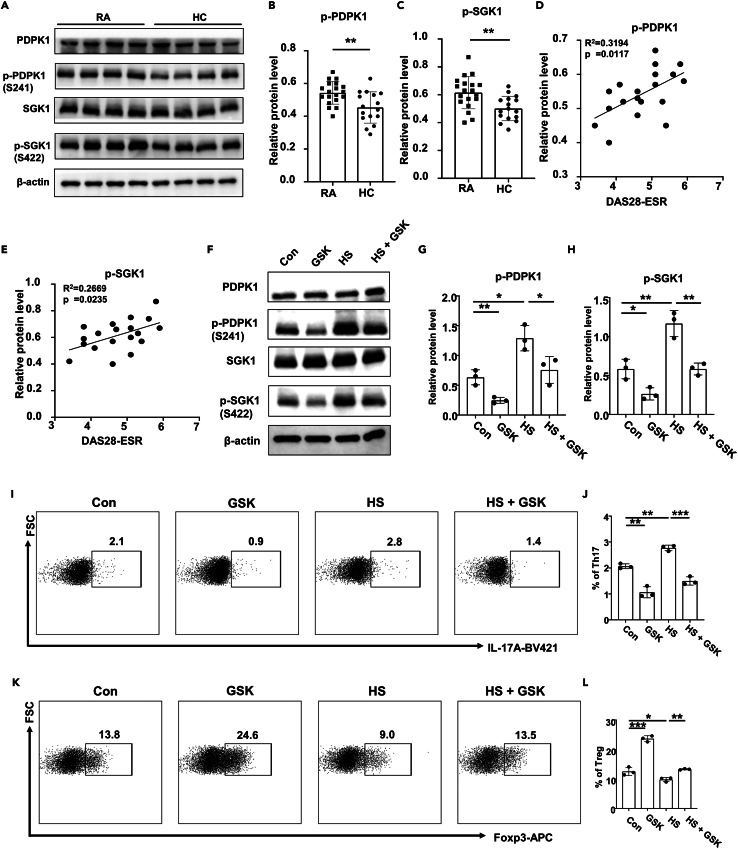
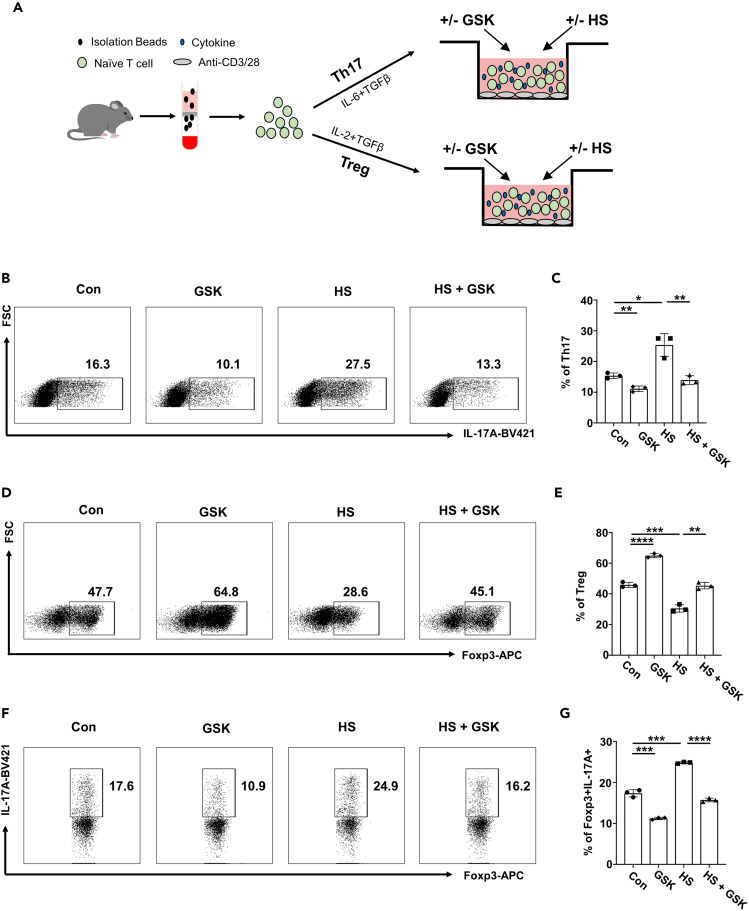
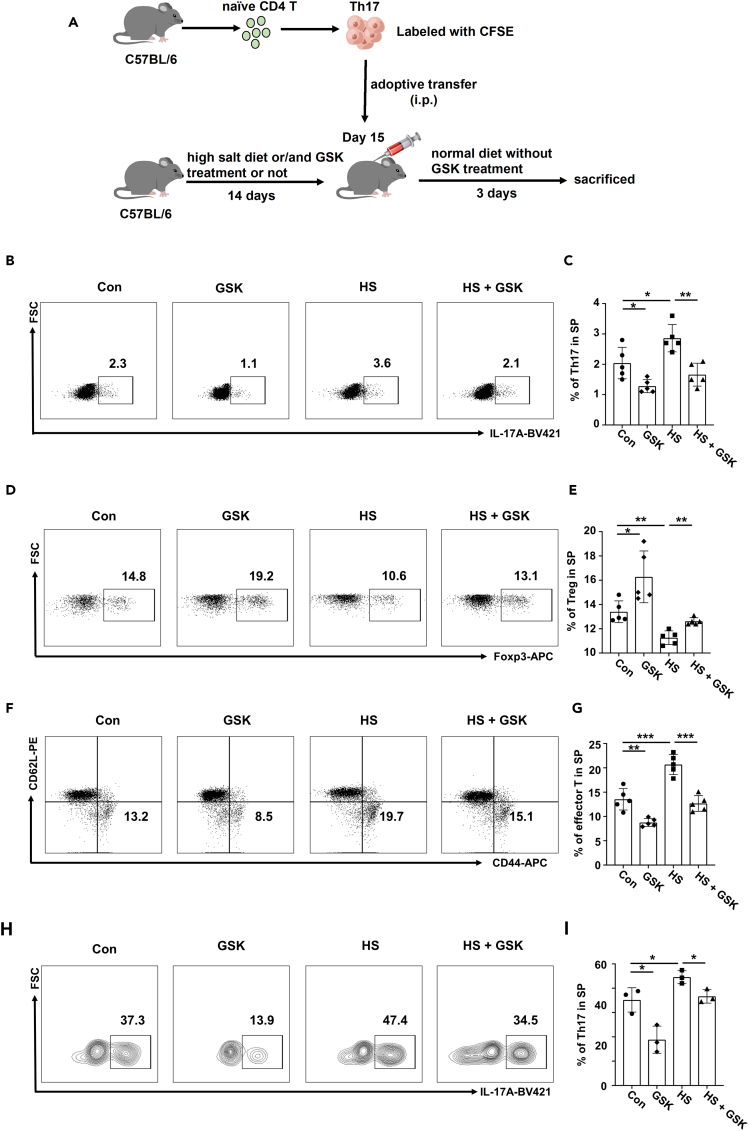
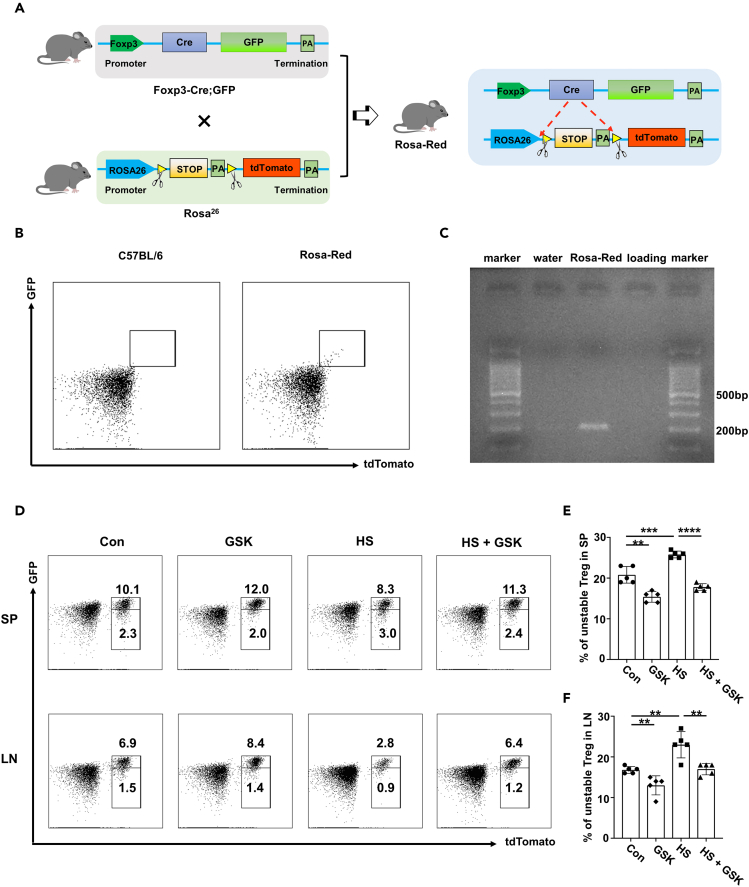
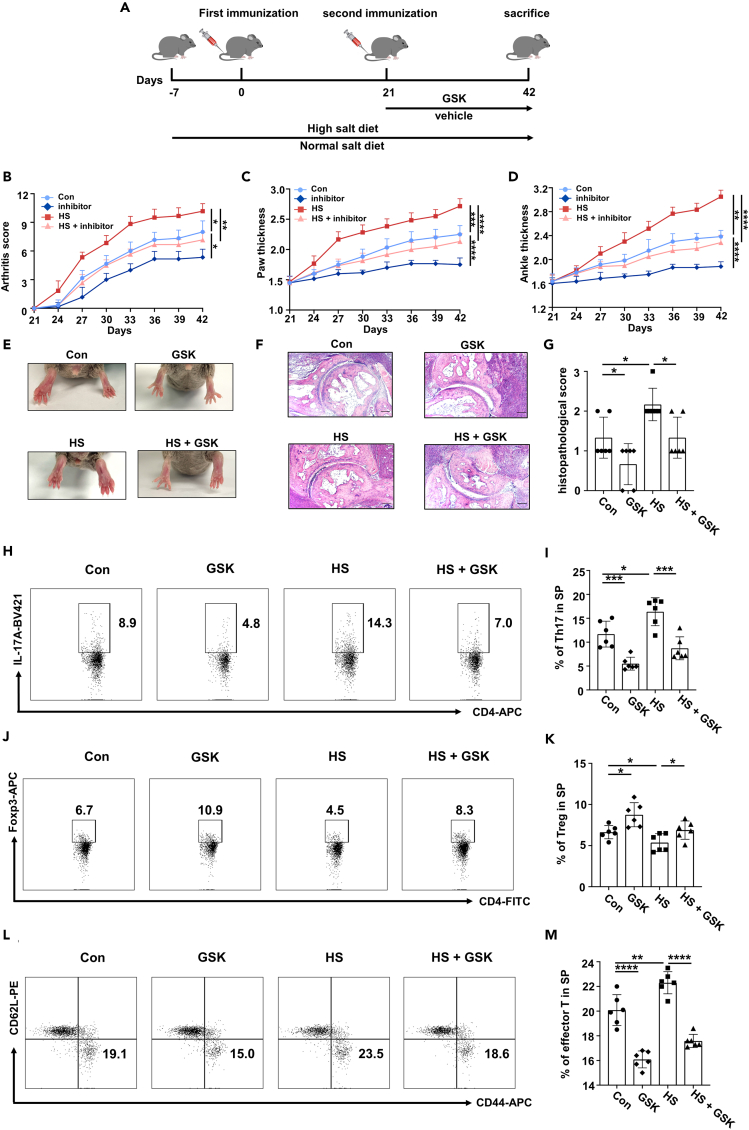
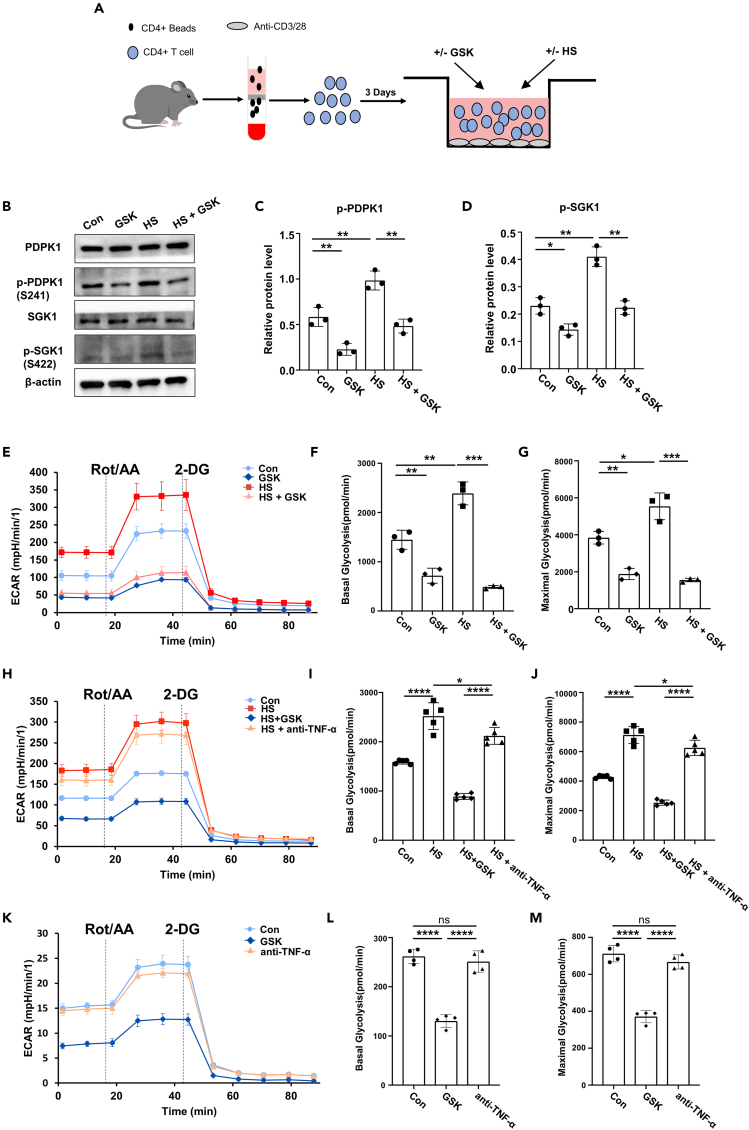
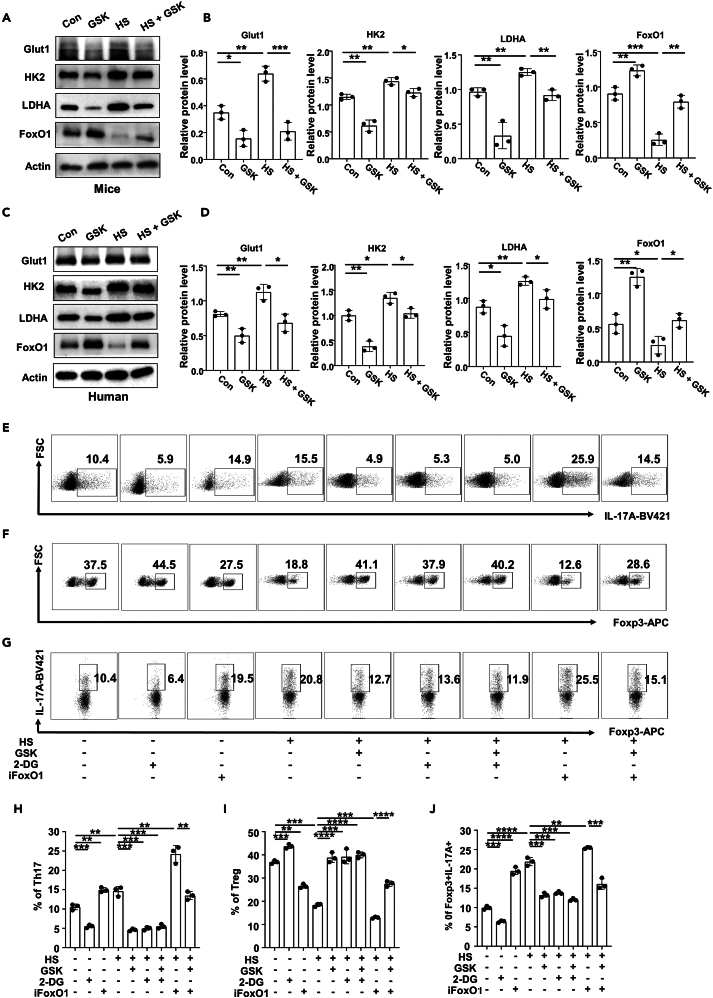
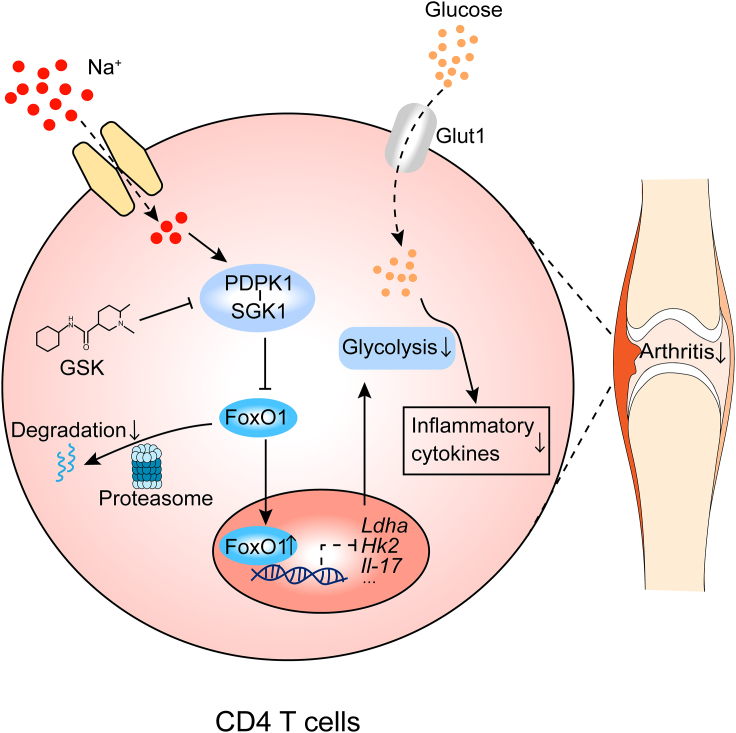
High salt (HS) consumption is a risk factor for multiple autoimmune disorders via disturbing immune homeostasis. Nevertheless, the exact mechanisms by which HS exacerbates rheumatoid arthritis (RA) pathogenesis remain poorly defined. Herein, we found that heightened phosphorylation of PDPK1 and SGK1 upon HS exposure attenuated FoxO1 expression to enhance the glycolytic capacity of CD4 T cells, resulting in strengthened Th17 but compromised Treg program. GSK2334470 (GSK), a dual PDPK1/SGK1 inhibitor, effectively mitigated the HS-induced enhancement in glycolytic capacity and the overproduction of IL-17A. Therefore, administration of GSK markedly alleviated HS-exacerbated RA progression in collagen-induced arthritis (CIA) model. Collectively, our data indicate that HS consumption subverts Th17/Treg homeostasis through the PDPK1-SGK1-FoxO1 signaling, while GSK could be a viable drug against RA progression in clinical settings.

Keywords: Biological sciences; Immunology; Natural sciences; Pharmacology; Physiology.


Conflict of interest statement

The authors declare no competing interests.

Figures

None
Graphical abstract
Figure 1
Figure 1
Phosphorylation levels of PDPK1 and SGK1 in CD4 T cells correlate with RA severity (A) Expression levels of (p-)PDPK1 and (p-)SGK1 in CD4 T cells of RA (n = 19) and HC (n = 16) groups were detected by Western blot. (B and C) Quantification of the phosphorylation levels of PDPK1 and SGK1 in CD4 T cells of RA and HC groups. (D and E) Correlation analysis of disease activity index DAS28-ESR with the phosphorylation levels of PDPK1 and SGK1. (F–H) CD4 T cells were isolated from RA patients and cultured for 3 days in the presence of HS (40 mmol/L) and/or GSK (2.5 μmol/L). Expression levels of (p-)PDPK1 and (p-)SGK1 in CD4 T cells of RA were detected by Western blot. (I and J) CD4 T cells from RA patients were isolated and treated with HS and/or GSK for 3 days, and the proportion of Th17 cells was detected by flow cytometry. (K and L) CD4 T cells from RA patients were isolated and treated with HS and/or GSK for 3 days, and the proportion of Treg cells was detected by flow cytometry. Statistical significance was calculated by unpaired Student’s t test and data are represented as mean ± SD. The correlation was determined by linear regression analysis for (D) and (E). ∗p < 0.05, ∗∗p < 0.01, ∗∗∗p < 0.001, ns not significant.
Figure 2
Figure 2
GSK reverses the effects of HS on Th17 and Treg program in vitro (A) Schematic representation of Th17 and Treg in vitro differentiation. (B and C) The proportion of differentiated Th17 cells (n = 3). (D and E) The proportion of differentiated Treg cells (n = 3). (F and G) Naive CD4 T cells were cultured for 3 days under the Treg polarization condition. Then, Treg cells were harvested, washed and cultured for an additional 2 days under Th17 condition in the presence of HS and/or GSK. The proportion of IL-17A producing cells within the Foxp3+ Treg cells was shown (n = 3). Statistical significance was calculated by unpaired Student’s t test and data are represented as mean ± SD. ∗p < 0.05, ∗∗p < 0.01, ∗∗∗p < 0.001, ∗∗∗∗p < 0.0001.
Figure 3
Figure 3
GSK reverses the effects of HS on Th17 and Treg program in vivo (A) Schematic representation of the adoptive transfer model. (B and C) The proportion of Th17 cells within splenic CD4 T cells of recipient mice (n = 5). (D and E) The proportion of Treg cells within splenic CD4 T cells of recipient mice (n = 5). (F and G) The proportion of activated CD4 T cells within splenic CD4 T cells of recipient mice (n = 5). (H and I) The proportion of IL-17A producing donor cells in spleen (n = 3). Statistical significance was calculated by unpaired Student’s t test and data are represented as mean ± SD. ∗p < 0.05, ∗∗p < 0.01, ∗∗∗p < 0.001.
Figure 4
Figure 4
GSK rectifies high salt-induced Treg instability in vivo (A) Schematic representation of constructing Rosa-Red mouse model. (B) Peripheral one-drop blood flow cytometry was employed to validate Rosa-Red transgenic mice. (C) PCR was employed for genotyping Rosa-Red mice. (D–F) The proportion of unstable Treg cells (tdTomato+ GFP) within the total Treg population in the spleen and lymph nodes of Rosa-Red mice. Statistical significance was calculated by unpaired Student’s t test and data are represented as mean ± SD. ∗∗p < 0.01, ∗∗∗p < 0.001, ∗∗∗∗p < 0.0001.
Figure 5
Figure 5
GSK ameliorates high salt-accelerated arthritis progression (A) Schematic representation of CIA model. (B) Arthritis score of CIA mice (n = 6). (C) Paw thickness of CIA mice (n = 6). (D) Ankle thickness of CIA mice (n = 6). (E) Representative pictures of the hind paw joints of CIA mice at day 42. (F) H&E staining of ankle joints of CIA mice. Scale bars, 100 μm. (G) The histopathological score of knee joints of CIA mice. (H and I) The proportion of Th17 cells within splenic CD4 T cells of CIA mice (n = 6). (J and K) The proportion of Treg cells within splenic CD4 T cells of CIA mice (n = 6). (L and M) The proportion of activated CD4 T cells within splenic CD4 T cells of CIA mice (n = 6). Statistical significance was calculated by unpaired Student’s t test and data are represented as mean ± SD. ∗p < 0.05, ∗∗p < 0.01, ∗∗∗p < 0.001, ∗∗∗∗p < 0.0001.
Figure 6
Figure 6
GSK down-tunes the glycolytic metabolism of high salt-insulted CD4 T cells (A) Schematic representation of CD4 T cell culture. (B) Expression levels of (p-)PDPK1 and (p-)SGK1 in CD4 T cells following treatment with GSK and/or HS (n = 3) were detected by western blot. (C and D) Quantitative analysis of p-PDPK1 and p-SGK1 expression (n = 3). (E) The glycolytic activity of CD4 T cells following GSK and/or HS treatment (n = 3). (F) Basal glycolysis rates post-treatment (n = 3). (G) Maximal glycolysis capacity of CD4 T cells following GSK and/or HS treatment (n = 3). (H) The glycolytic activity of CD4 T cells following co-treatment with HS and GSK or anti-TNF-α (n = 3). (I) Basal glycolysis rates of CD4 T cells following co-treatment with HS and GSK or anti-TNF-α (n = 3). (J) Maximal glycolysis rates following co-treatment with HS and GSK or anti-TNF-α (n = 3). (K) The glycolytic activity of CD4 T cells following treatment with PBS, GSK or anti-TNF-α (n = 3). (L) Basal glycolysis rates of CD4 T cells following treatment with PBS, GSK or anti-TNF-α (n = 3). (M) Maximal glycolysis rates following treatment with PBS, GSK or anti-TNF-α (n = 3). Statistical significance was calculated by unpaired Student’s t test and data are represented as mean ± SD. ∗p < 0.05, ∗∗p < 0.01, ∗∗∗p < 0.001, ∗∗∗∗p < 0.0001, ns (not significant).
Figure 7
Figure 7
Blockade of FoxO1 impairs the immune regulatory effects of GSK (A and B) CD4 T cells were isolated from C57BL/6 mice and stimulated by anti-CD3/28 in the presence of GSK and/or HS or not for 3 days (A) Western blot analysis was employed to assess the expression levels of Glut1, HK2, LDHA, and FoxO1 in CD4 T cells from C57BL/6 mice (n = 3). (B) Quantitative analysis of Glut1, HK2, LDHA, and FoxO1 expression in CD4 T cells from C57BL/6 mice (n = 3). (C, D) CD4 T cells were isolated from peripheral blood of RA patients and stimulated by anti-CD3/28 in the presence of GSK and/or HS for 3 days. (C) Western blot analysis was employed to assess the expression levels of Glut1, HK2, LDHA, and FoxO1 in CD4 T cells from RA patients (n = 3). (D) Quantitative analysis of Glut1, HK2, LDHA, and FoxO1 expression in CD4 T cells from RA patients (n = 3). (E–J) Naive CD4 T cells from C57BL/6 mice were polarized into Th17 cells or Treg cells in the presence of different combinations of HS, GSK, 2-DG and iFoxO1 for 3 days. For Treg stability assay, naive CD4 T cells were initially cultured for 3 days under Treg polarization condition. Then, Treg cells were harvested, washed and cultured for an additional 2 days under Th17 condition in the presence of HS, GSK, 2-DG or iFoxO1. (E, H) The proportion of Th17 cells within CD4 T cells following distinct stimulation (n = 3). (F, I) The proportion of Treg cells within CD4 T cells following distinct stimulation (n = 3). (G, J) The proportion of IL-17A producing cells within total Foxp3+ Treg cells following distinct stimulation (n = 3). Statistical significance was calculated by unpaired Student’s t test and data are represented as mean ± SD. ∗p < 0.05, ∗∗p < 0.01, ∗∗∗p < 0.001, ∗∗∗∗p < 0.0001.
Figure 8
Figure 8
Graphical illustration High salt stimulation turbocharges the glycolytic metabolism of CD4 T cells through the PDPK1-SGK1-FoxO1 signaling pathway, which subsequently disturbs the Th17/Treg balance and promotes the progression of RA. Utilization of PDPK1/SGK1 inhibitor, GSK, effectively corrects Th17/Treg imbalance to mitigate the detrimental outcomes of high salt insult.

References

    1. Sparks J.A. Rheumatoid Arthritis. Ann. Intern. Med. 2019;170:ITC1–ITC16. doi: 10.7326/AITC201901010. - DOI - PubMed
    1. Deane K.D., Demoruelle M.K., Kelmenson L.B., Kuhn K.A., Norris J.M., Holers V.M. Genetic and environmental risk factors for rheumatoid arthritis. Best Pract. Res. Clin. Rheumatol. 2017;31:3–18. doi: 10.1016/j.berh.2017.08.003. - DOI - PMC - PubMed
    1. Carranza-León D.A., Oeser A., Marton A., Wang P., Gore J.C., Titze J., Stein C.M., Chung C.P., Ormseth M.J. Tissue sodium content in patients with systemic lupus erythematosus: association with disease activity and markers of inflammation. Lupus. 2020;29:455–462. doi: 10.1177/0961203320908934. - DOI - PMC - PubMed
    1. Dent E.L., Broome H.J., Sasser J.M., Ryan M.J. Blood pressure and albuminuria in a female mouse model of systemic lupus erythematosus: impact of long-term high salt consumption. Am. J. Physiol. Regul. Integr. Comp. Physiol. 2020;319:R448–R454. doi: 10.1152/ajpregu.00070.2020. - DOI - PMC - PubMed
    1. Kleinewietfeld M., Manzel A., Titze J., Kvakan H., Yosef N., Linker R.A., Muller D.N., Hafler D.A. Sodium chloride drives autoimmune disease by the induction of pathogenic TH17 cells. Nature. 2013;496:518–522. doi: 10.1038/nature11868. - DOI - PMC - PubMed