. 2024 Jun 11;14(9):3634-3652.
doi: 10.7150/thno.95590. eCollection 2024.

Modularized supramolecular assemblies for hypoxia-activatable fluorescent visualization and image-guided theranostics

Affiliations

Modularized supramolecular assemblies for hypoxia-activatable fluorescent visualization and image-guided theranostics

Wen Liu et al. Theranostics. .

Abstract

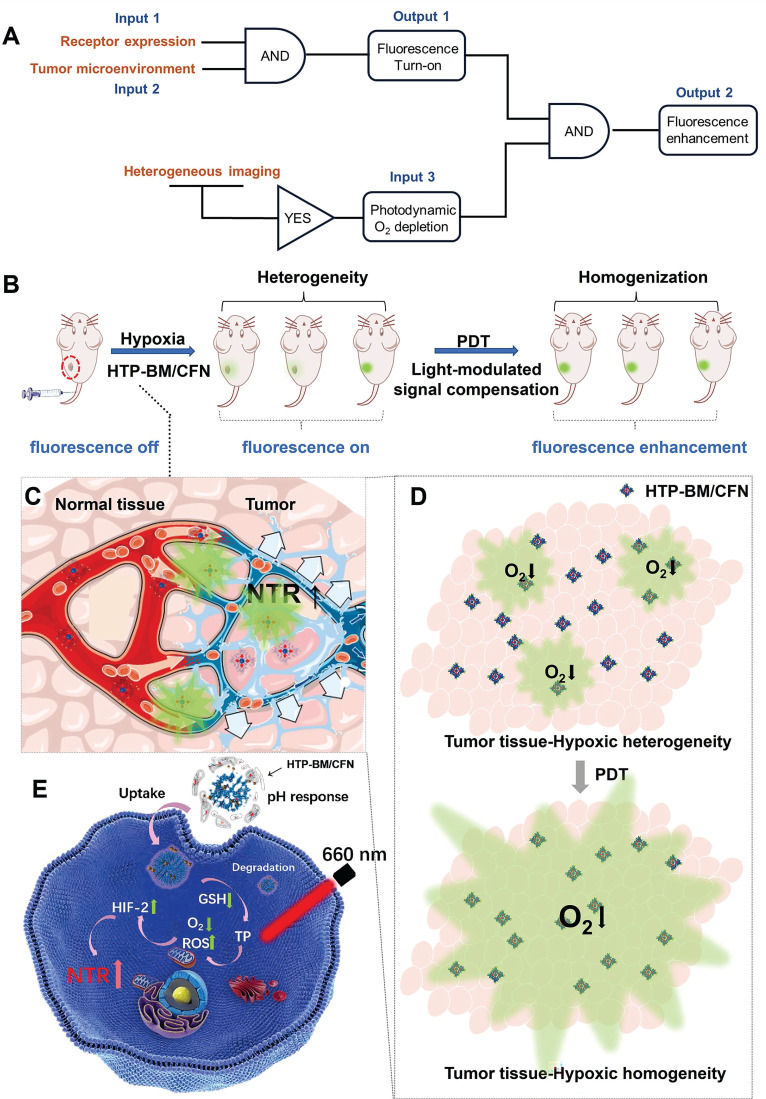
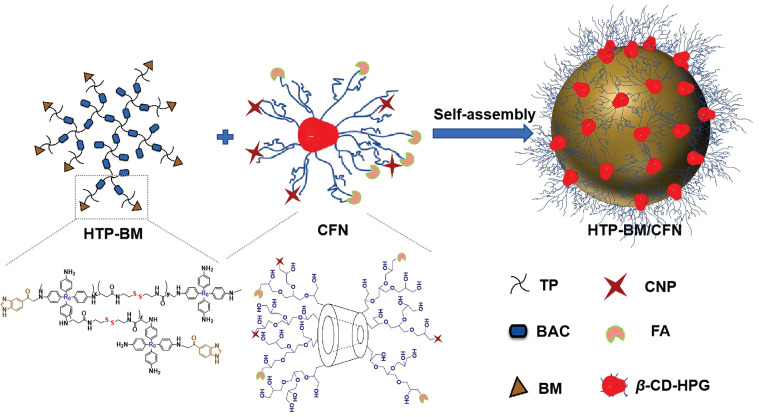
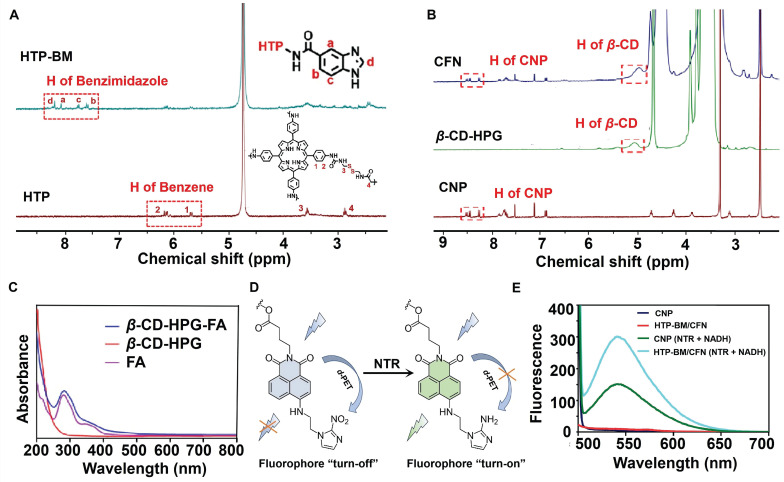
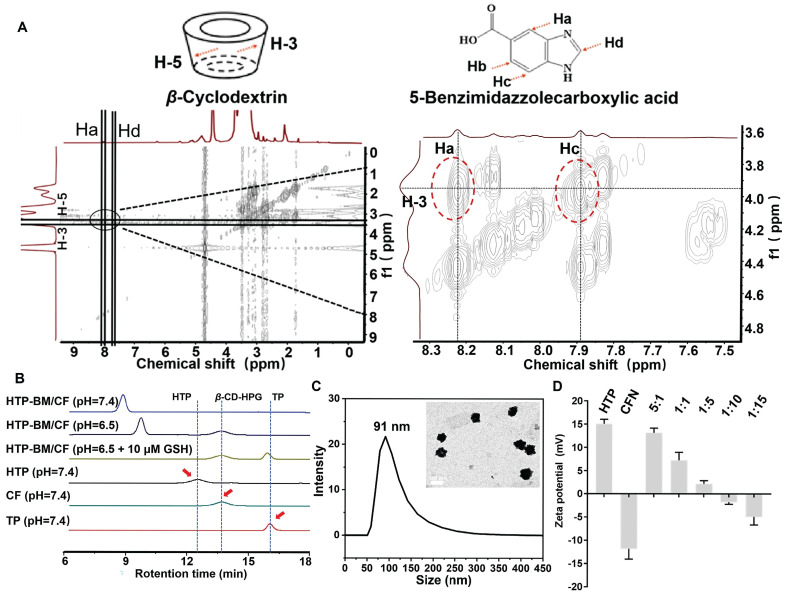
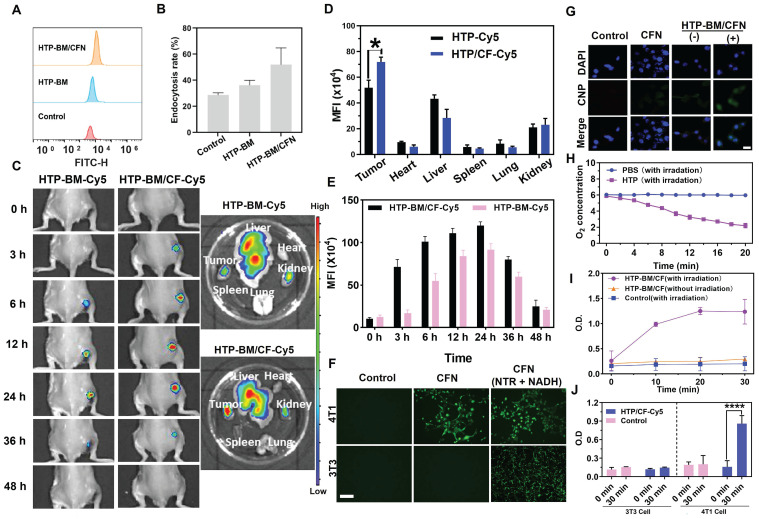
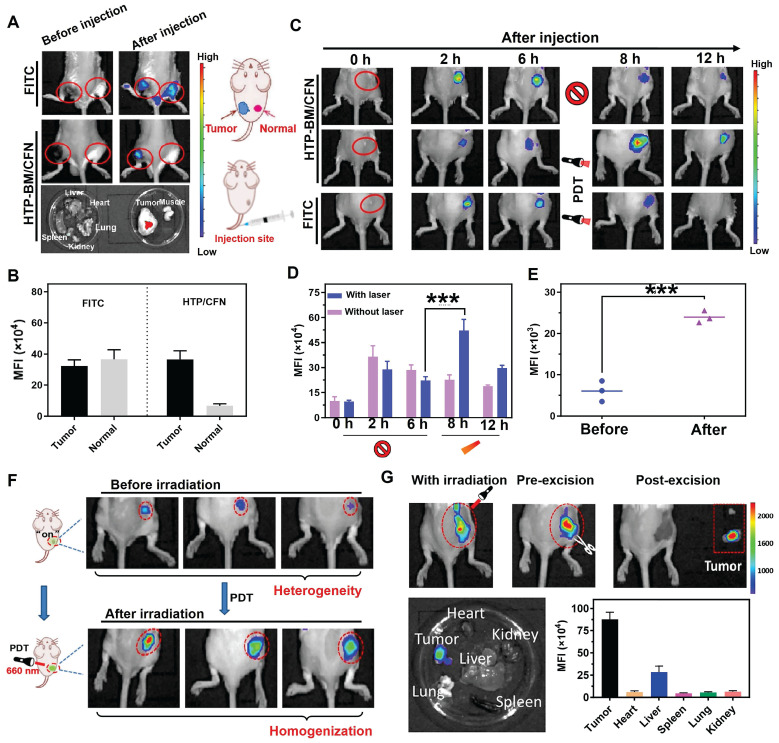
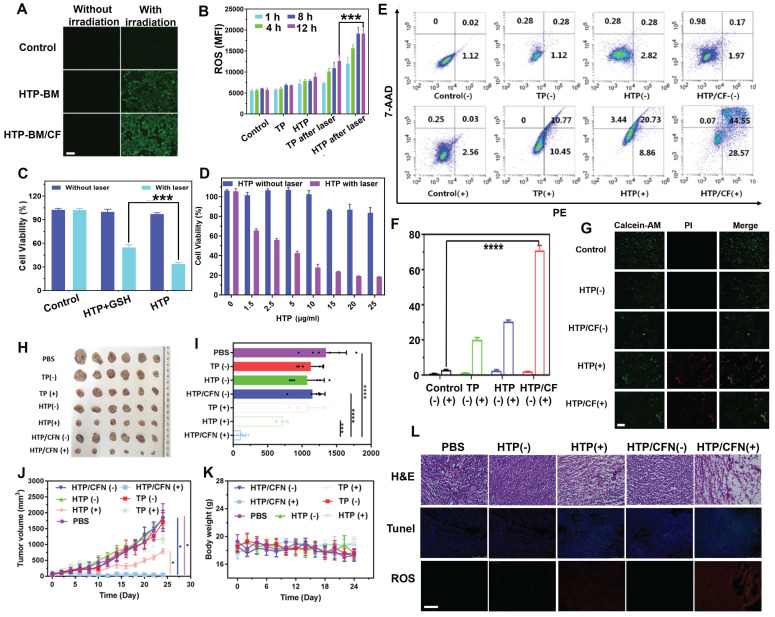
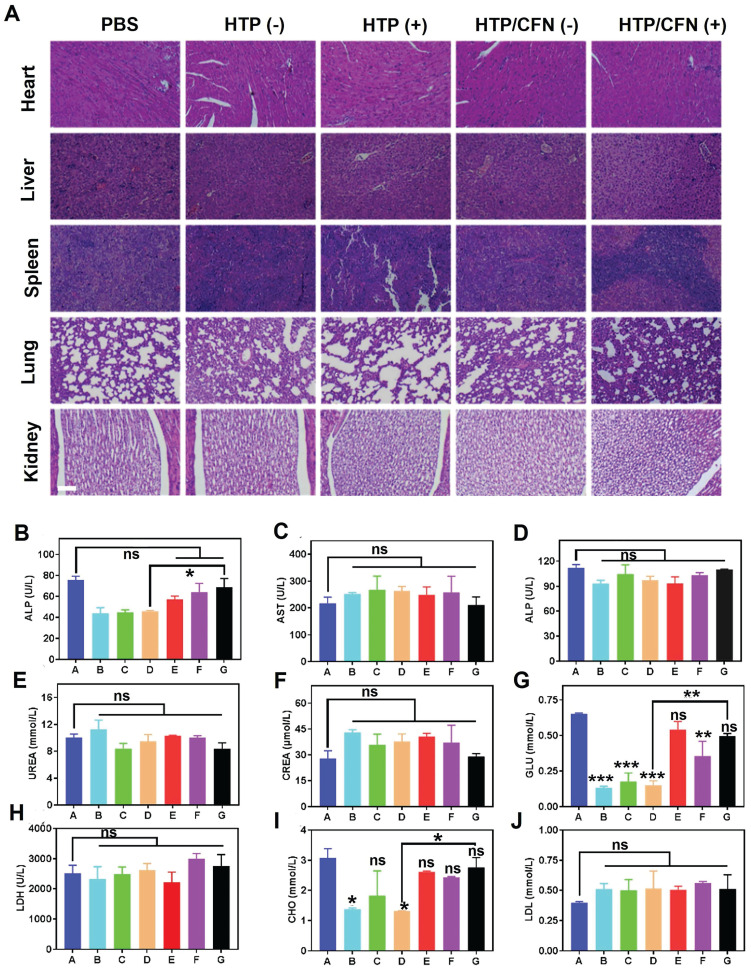
Rationale: Molecular imaging of microenvironment by hypoxia-activatable fluorescence probes has emerged as an attractive approach to tumor diagnosis and image-guided treatment. Difficulties remain in its translational applications due to hypoxia heterogeneity in tumor microenvironments, making it challenging to image hypoxia as a reliable proxy of tumor distribution. Methods: We report a modularized theranostics platform to fluorescently visualize hypoxia via light-modulated signal compensation to overcome tumor heterogeneity, thereby serving as a diagnostic tool for image-guided surgical resection and photodynamic therapy. Specifically, the platform integrating dual modules of fluorescence indicator and photodynamic moderator using supramolecular host-guest self-assembly, which operates cooperatively as a cascaded "AND" logic gate. First, tumor enrichment and specific fluorescence turn-on in hypoxic regions were accessible via tumor receptors and cascaded microenvironment signals as simultaneous inputs of the "AND" gate. Second, image guidance by a lighted fluorescence module and light-mediated endogenous oxygen consumption of a photodynamic module as dual inputs of "AND" gate collaboratively enabled light-modulated signal compensation in situ, indicating homogeneity of enhanced hypoxia-related fluorescence signals throughout a tumor. Results: In in vitro and in vivo analyses, the biocompatible platform demonstrated several strengths including a capacity for dual tumor targeting to progressively facilitate specific fluorescence turn-on, selective signal compensation, imaging-time window extension conducive to precise normalized image-guided treatment, and the functionality of tumor glutathione depletion to improve photodynamic efficacy. Conclusion: The hypoxia-activatable, image-guided theranostic platform demonstrated excellent potential for overcoming hypoxia heterogeneity in tumors.

Keywords: Tumor heterogeneity; fluorescent probe; hypoxia; photodynamic therapy; supramolecular assembly.


Conflict of interest statement

Competing Interests: The authors have declared that no competing interest exists.

Figures

Scheme 1
Scheme 1
(A) Schematic illustration of the enhanced fluorescence imaging based on HTP-BM/CFN in terms of manner as two-stage “AND” logic gate. (B). Schematic illustration of the multifunctional assemblies (HTP-BM/CFN) as fluorescent indicators of hypoxia, as well as photosensitizers that normalize tumor hypoxic heterogeneity: (C). Overexpressed folate receptors recruit folate-decorated HTP-BM/CFN to be enriched at tumor sites, followed by disassembly of the shell layers, release of the fluorescent indicator (CNP) and photosensitizer. The CNP is turned on under hypoxia-induced NTR high expression. (D). Heterogeneous fluorescence feedback appears within a single tumor with spatial heterogeneity of hypoxic regions. After HTP-BM core in GSH induced dissociation state exert a phototherapeutic effect upon the laser treatment, the hypoxia is enhanced with expanded hypoxic region regulated by PDT process, stimulating an enhanced and homogenized trend of fluorescence over the whole tumor. (E). Enhanced PDT efficiency with imaging monitoring was achieved by depleting GSH and elevating ROS production during cellular HTP degradation together with up-regulation of NTR.
Scheme 2
Scheme 2
Self-assembly diagram of HTP-BM/CFN assemblies via host-guest interaction, and the corresponding chemically structures of each component and functionality.
Figure 1
Figure 1
Characterization of core (HTP-BM) and shell (CFN) molecules. (A) 1H NMR spectra of HTP-BM. and HTP. (B) 1H NMR spectra of CFN, β-CD-HPG and CNP. (C) The comparison results of UV absorption spectra between FA, β-CD-HPG and CFN. (D) Fluorescence turn-on mechanism of the fluorophore CNP. (E) Fluorescence emission spectrum of CNP, HTP-BM/CFN, CNP (NTR+NADH) and HTP-BM/CFN (NTR + NADH) (λex = 436 nm).
Figure 2
Figure 2
Characterization of the HTP-BM/CFN core-shell self-assembly. (A) Two-dimensional NMR spectra of the HTP-BM/CFN assemblies. (B) GPC traces of TP, CF, HTP, and HTP-BM/CF under different treatment conditions. (C) Particle size distribution and morphology characterization of the assemblies (scale bar = 100 nm). (D) Zeta potential of the assemblies with different core/shell ratios.
Figure 3
Figure 3
(A) Flow cytometric analysis of HTP-BM and HTP-BM/CF uptake by 4T1 cells and quantitative fluorescence statistics (B). (C) In vivo fluorescence imaging of HTP-BM-Cy5 and HTP-BM/CF-Cy5 in mice and ex-vivo isolated tumors and major organs 48 h after tail vein injection. Quantitative fluorescence statistics of in vivo imaging in major organs (D) and tumor along the time (E) in mice. (F) Fluorescence images of 4T1 and 3T3 cells co-incubated with PBS, CFN and CFN (10 μL NTR, 2 μL NADH) for 6 h, respectively (scale bar is 100 μm). G) Fluorescence images of 4T1 cells incubated with CFN and HTP-BM/CFN with or without 10 min laser irradiation (660 nm, 1.2 W/cm2), (-) representing without irradiation, (+) representing with irradiation, scale bar: 20 μm. (H) Dissolved oxygen content in PBS and HTP solutions before and after laser irradiation (660 nm, 1.2 W/cm2). (I) Nitroreductase activity in 4T1 cells in the presence and absence of HTP-BM/CF after irradiation treatment with the time. (J) Nitroreductase activity in 4T1 cells and 3T3 cells in the presence and absence of HTP-BM/CF before and after 30 min of irradiation treatment. (* p<0.05, and **** p<0.0001)
Figure 4
Figure 4
(A) In vivo fluorescence imaging of tumor and muscle tissues before and after injected with FITC and HTP-BM/CFN respectively in mice and their fluorescent quantitative analysis (B). (C) In vivo fluorescence image along the time (0-6 h) after administrated with FITC and HTP-BM/CFN respectively, followed by light irradiation at 6h for fluorescence enhancement and their fluorescence quantification(D). (E) fluorescence quantification. (F) In vivo fluorescence image of light-modulated heterogeneous tumor imaging. (G) Real-time fluorescent imaging-guided tumor surgical resection based on the light-modulated fluorescence compensation of HTP-BM/CFN and fluorescent quantitative analysis of main organs and tumor. (*** p<0.001)
Figure 5
Figure 5
(A) Intracellular ROS fluorescence imaging after HTP-BM and HTP-BM/CF treatment for 12 h in the presence of laser exposure (660 nm, 1.2 W/cm2, 5 min), (scale bar: 500 µm). (B) Intracellular ROS fluorescence quantification by flow cytometry. (C) 4T1 cells viability incubated with HTP and GSH-treated HTP with or without laser irradiation (660 nm, 1.2 W/cm2, 8 min). (D) 4T1 cells cytotoxicity of HTP along the concentration with and without laser irradiation. (E) Apoptosis using FACS analysis of 4T1 cells treated with various formulations (PBS, TP, HTP, HTP/CF) before and after laser irradiation and (F) its quantitative fluorescence analysis. (G) Live (green) and dead (red) cells fluorescence images of 4T1 cells after incubation with HTP and HTP/CF with and without laser irradiation (660 nm, 1.2 W/cm2), (scale bar: 20 μm). (H) Tumor tissues image of mice extracted after 21 days of treatment with various formulations. (I) Tumor weight statistics of each group after 21 days of treatment. (J) Curves of tumor volume after different treatment with various formulations. (K) Changes in body weight of mice after treatment with different formulations (scale bar:100 µm). (L) Histological and immunohistochemical analysis of tumor sections collected from different treatment groups (scale bar:100 µm). Where (+) represents laser irradiation and (-) represents without laser irradiation. (* p<0.05, *** p<0.001, and **** p<0.0001)
Figure 6
Figure 6
In vivo biocompatibility evaluation of the HTP-BM/CFN: (A) H&E staining images of major organs (heart, liver, spleen, lung, kidney) of mice in each treatment groups, where (+) represents light and (-) represents no light (scale bar is 100 µm) (B)-(J) Blood biochemical analysis of hepatic function (ALT, AST and ALP), renal function (UREA, CREA, and GLU), low-density lipoprotein (LDH), total cholesterol (CHO) and blood lipids (LDL) collected from mice treated with different formulations (A: saline group, B: TP(-) group, C: TP(+) group, D: HTP(-) group, E: HTP(+) group, F: HTP-BM/CFN (-) group and G: HTP-BM/CFN ( +) group) . (* p<0.05, ** p<0.01, *** p<0.001 and ns p>0.05)

References

    1. Pe'er D, Ogawa S, Elhanani O, Keren L, Oliver TG, Wedge D. Tumor heterogeneity. Cancer cell. 2021;39:1015–7. - PubMed
    1. Arrieta VA, Dmello C, McGrail DJ, Brat DJ, Lee-Chang C, Heimberger AB. et al. Immune checkpoint blockade in glioblastoma: from tumor heterogeneity to personalized treatment. The Journal of Clinical Investigation. 2023;133:e163447. - PMC - PubMed
    1. Guo L, Kong D, Liu J, Zhan L, Luo L, Zheng W. et al. Breast cancer heterogeneity and its implication in personalized precision therapy. Experimental hematology & oncology. 2023;12:3. - PMC - PubMed
    1. Ramón y Cajal S, Sesé M, Capdevila C, Aasen T, De Mattos-Arruda L, Diaz-Cano SJ. et al. Clinical implications of intratumor heterogeneity: challenges and opportunities. Journal of Molecular Medicine. 2020;98:161–77. - PMC - PubMed
    1. Marusyk A, Janiszewska M, Polyak K. Intratumor heterogeneity: the rosetta stone of therapy resistance. Cancer cell. 2020;37:471–84. - PMC - PubMed

Publication types

Substances