. 2024 Jun 1;14(9):3509-3525.
doi: 10.7150/thno.96946. eCollection 2024.

Targeting endothelial glycolytic reprogramming by tsRNA-1599 for ocular anti-angiogenesis therapy

Affiliations

Targeting endothelial glycolytic reprogramming by tsRNA-1599 for ocular anti-angiogenesis therapy

Xiao-Yan Han et al. Theranostics. .

Abstract

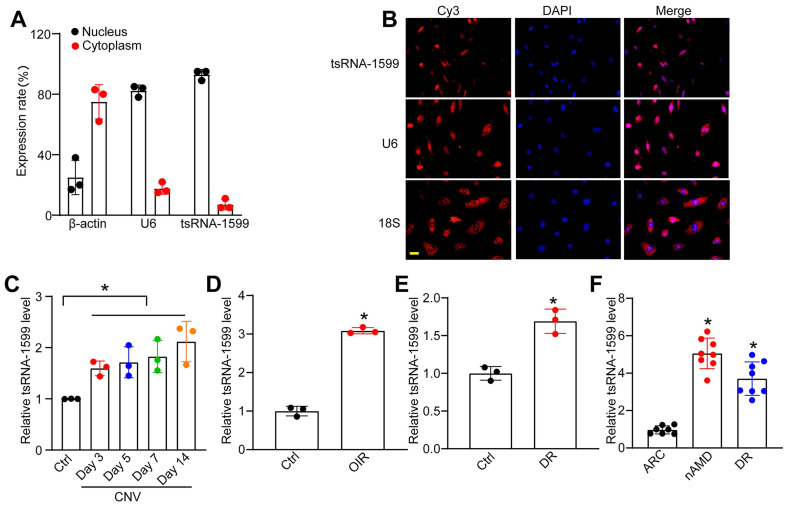
Rationale: Current treatments for ocular angiogenesis primarily focus on blocking the activity of vascular endothelial growth factor (VEGF), but unfavorable side effects and unsatisfactory efficacy remain issues. The identification of novel targets for anti-angiogenic treatment is still needed. Methods: We investigated the role of tsRNA-1599 in ocular angiogenesis using endothelial cells, a streptozotocin (STZ)-induced diabetic model, a laser-induced choroidal neovascularization model, and an oxygen-induced retinopathy model. CCK-8 assays, EdU assays, transwell assays, and matrigel assays were performed to assess the role of tsRNA-1599 in endothelial cells. Retinal digestion assays, Isolectin B4 (IB4) staining, and choroidal sprouting assays were conducted to evaluate the role of tsRNA-1599 in ocular angiogenesis. Transcriptomic analysis, metabolic analysis, RNA pull-down assays, and mass spectrometry were utilized to elucidate the mechanism underlying angiogenic effects mediated by tsRNA-1599. Results: tsRNA-1599 expression was up-regulated in experimental ocular angiogenesis models and endothelial cells in response to angiogenic stress. Silencing of tsRNA-1599 suppressed angiogenic effects in endothelial cells in vitro and inhibited pathological ocular angiogenesis in vivo. Mechanistically, tsRNA-1599 exhibited little effect on VEGF signaling but could cause reduced glycolysis and NAD+/NADH production in endothelial cells by regulating the expression of HK2 gene through interacting with YBX1, thus affecting endothelial effects. Conclusions: Targeting glycolytic reprogramming of endothelial cells by a tRNA-derived small RNA represents an exploitable therapeutic approach for ocular neovascular diseases.

Keywords: Angiogenesis; Endothelial metabolism; Glycolytic flux; Ocular neovascular disease; tsRNAs.


Conflict of interest statement

Competing Interests: The authors have declared that no competing interest exists.

Figures

Figure 1
Figure 1
tsRNA-1599 is a potential regulator of experimental neovascularization. (A) Volcano plot filtering was conducted to identify differentially expressed tsRNAs in the RPE-choroid-sclera complexes between CNV group and non-CNV group. (B and C) Length distribution of tsRNAs were shown in non-CNV group (B) and CNV group (C). (D and E) Stacked plots displaying the percentage of each tsRNA sub-type sorted by the sites and length expressed in non-CNV group (D) and CNV group (E). (F) Pie charts showing the percentage of different tsRNA types in non-CNV group and CNV group. (G) qRT-PCR assays were conducted to compare the expression of the indicated tsRNAs between CNV group and non-CNV group (n = 4, *P < 0.05 vs. non-CNV, Student t test). (H) HUVECs were treated with CoCl2 (300 μmol/L) to mimic hypoxic condition or left untreated (Ctrl) for 24 h. qRT-PCR assays were conducted to detect the expression of the indicated tsRNAs in HUVECs (n = 3, *P < 0.05 vs. Ctrl, Student t test).
Figure 2
Figure 2
tsRNA-1599 expression is significantly up-regulated in experimental neovascularization in vitro and in vivo. (A) The expression levels of nucleus control transcript (U6), cytoplasm control transcript (β-actin), and tsRNA-1599 were detected by qRT-PCR assays in the nucleus and cytoplasm fraction of HUVECs (n = 3). (B) RNA-FISH assays were conducted to detect the distribution of tsRNA-1599 expression in HUVECs using Cy3-labeled probe (tsRNA-1599). Nucleus control transcript (U6) and cytoplasm control transcript (18S rRNA) was also detected. Nuclei were stained with 4ʹ, 6-diamidino-2-phenylindole (DAPI). Scale bar, 10 μm. (C) qRT-PCRs were conducted to detect the levels of tsRNA-1599 expression in the RPE-choroid-sclera complexes of C57BL/6J mice after 3, 5, 7, 14-day laser photocoagulation (n = 3, *P < 0.05 vs. Ctrl, One-way ANOVA followed by Bonferroni's post hoc test). (D) qRT-PCR assays were conducted to compare the levels of tsRNA-1599 expression in the OIR retinas and normal retinas (n = 3, *P < 0.05 vs. Ctrl, Student t test). (E) qRT-PCR assays were conducted to compare tsRNA-1599 expression in DR retinas and non-DR retinas (n = 3, *P < 0.05 vs. Ctrl, Student t test). (F) qRT-PCR assays were conducted to compare tsRNA-1599 expression in aqueous humor of nAMD patients (n = 8) or DR patients (n = 8) with age related cataract (ARC, n = 7 vs. ARC, *P < 0.05, One-way ANOVA followed by Bonferroni's post hoc test).
Figure 3
Figure 3
tsRNA-1599 regulates endothelial angiogenic effects in vitro. (A) HUVECs were transfected with negative control (NC) mimic, tsRNA-1599 mimic, or left untreated (Ctrl) for 24 h. The levels of tsRNA-1599 expression were detected by qRT-PCRs (n = 3, *P < 0.05 vs. Ctrl group, One-way ANOVA followed by Bonferroni's post hoc test). (B and C) HUVECs were transfected with NC mimic (30 nM), tsRNA-1599 mimic (30 nM), NC inhibitor (30 nM, tsRNA-1599 inhibitor (30 nM), treated with aflibercept (40 μg/mL), or left untreated (Ctrl) for 24 h, and then treated with or without CoCl2 (300 μmol/L) for 24 h. The viability of HUVECs was determined by CCK-8 assays (B, n = 5). Calcein-AM/PI assays were conducted to detect cell apoptosis (C, n = 5, Scale bar, 20 μm). *P < 0.05 vs. Ctrl group; #P < 0.05 between the marked group; One-way ANOVA followed by Bonferroni's post hoc test. (D - F) HUVECs were transfected with NC mimic, tsRNA-1599 mimic, NC inhibitor, tsRNA-1599 inhibitor, treated with aflibercept (40 μg/mL), or left untreated (Ctrl) for 24 h. The proliferation ability of HUVECs was determined by EdU assays (D, n = 5, Scale bar, 20 μm). Cell migration and quantitative analysis was conducted by transwell assays (E, n = 5, Scale bar, 20 μm). Tube formation assays and quantitative analysis were conducted to detect the tube formation ability of HUVECs (F, n = 5, Scale bar, 50 μm). *P < 0.05 vs. Ctrl group; #P < 0.05 between the marked group; One-way ANOVA followed by Bonferroni's post hoc test.
Figure 4
Figure 4
tsRNA-1599 silencing plays an anti-angiogenic role in experimental angiogenesis. (A) IB4 staining of the whole-mount retinas from OIR mice injected without or with aflibercept (40 mg/mL, 1 μL), scramble (Scr) antagomir (20 μM, 1 μL), or tsRNA-1599 antagomir (20 μM, 1μL) at P17 (n = 5 mice for each group, Scale bar, 500 μm) along with the quantification of avascular areas and neovascular tufts (NVTs). White line denotes retinal margin and white area represents NVT. In the insets, red line: retinal margin; blue area: avascular area; red area: NVTs. (B and C) Quantification analysis of avascular areas and NVTs, respectively. *P < 0.05 vs. OIR group; #P < 0.05 between the marked group; One-way ANOVA followed by Bonferroni's post hoc test. (D and E) Retinal trypsin digestion was conducted to detect the number of acellular capillaries in non-DR mice (Ctrl), DR mice, DR mice-injected Scr antagomir (20 μM, 2 μL), tsRNA-1599 antagomir (20 μM, 2 μL), or aflibercept (40 mg/mL, 2 μL). Yellow arrows indicated acellular capillaries (n = 5 mice for each group, Scale bar, 10 μm). *P < 0.05 vs. DR group; #P < 0.05 between the marked group; One-way ANOVA followed by Bonferroni's post hoc test.
Figure 5
Figure 5
Delivery of tsRNA1599 has no obvious retinal toxicity in vivo. (A) Diagram illustrating the experimental procedure for assessing the effects of altered tsRNA-1599 levels on the retinal toxicity for 7 days. (B) IB4 staining of retinal flat-mounts injected with scramble (Scr) agomir (20 μM, 2 μL), tsRNA-1599 agomir (20 μM, 2 μL), Scr antagomir (20 μM, 2 μL), tsRNA-1599 antagomir (20 μM, 2 μL), or PBS for 7 days (Scale bar, 500 μm). Quantification of vascular junction and length were shown (n = 5). (C) Immunofluorescence staining of the retinas injected with Scr agomir (20 μM, 2 μL), tsRNA-1599 agomir (20 μM, 2 μL), Scr antagomir (20 μM, 2 μL), tsRNA-1599 antagomir (20 μM, 2 μL), or PBS for 7 days with NeuN and Rhodopsin (Scale bar, 50 μm). Quantification results and representative images of NeuN and Rhodopsin staining were shown (n = 5). (D) The retinas were administered with Scr agomir (20 μM, 2 μL), tsRNA-1599 agomir (20 μM, 2 μL), Scr antagomir (20 μM, 2 μL), tsRNA-1599 antagomir (20 μM, 2 μL), or PBS for 7 days (Scale bar, 20 μm). Quantitative results and representative images of RBPMS staining are depicted (n = 5). The displayed images were captured at a location halfway between the center and the periphery of retina. (E) TUNEL staining of the retinas injected with Scr agomir (20 μM, 2 μL), tsRNA-1599 agomir (20 μM, 2 μL), Scr antagomir (20 μM, 2 μL), tsRNA-1599 antagomir (20 μM, 2 μL), or PBS for 7 days (Scale bar, 50 μm). “ns” represents no statistical significance; One-way ANOVA followed by Bonferroni's post hoc test.
Figure 6
Figure 6
tsRNA-1599 is an indirect regulator of VEGF signaling in endothelial cells. HUVECs were transfected with negative control (NC) mimic (30 nM), tsRNA-1599 mimic (30 nM), NC inhibitor (30 nM, tsRNA-1599 inhibitor (30 nM), or left untreated (Ctrl) for 24 h, and then stimulated with VEGF (100 ng/mL) for up to 2 h. Western blots were conducted to detect the expression levels of VEGFR2, p-VEGFR2, Akt, p-Akt, p38, p-p38, ERK, and p-ERK (n = 3). β-actin was detected as the internal control. “ns” represents no statistical significance; One-way ANOVA followed by Bonferroni's post hoc test.
Figure 7
Figure 7
tsRNA-1599 regulates glycolytic balance in endothelial cells. (A-E) HUVECs were transfected with negative control (NC) inhibitor (30 nM), tsRNA-1599 inhibitor (30 nM), or left untreated, and the exposed to CoCl2 (300 μmol/L) to mimic hypoxic condition for 24 h. The group cultured in normal condition was taken as Ctrl group. Seahorse analysis of glycolysis (ECAR) was conducted at 24 h following treatment (A). The concentration of reagents used in ECAR assays was as followed: glucose (10 mM), oligomycin (2 μM), and 2‐deoxyglucose (2‐DG, 100 mM). ECAR analysis was conducted in HUVECs following tsRNA-1599 inhibition (B, n = 3, *P < 0.05 vs. Ctrl group; #P < 0.05 between the marked group; Kruskal-Wallis's test followed by Bonferroni's post hoc test). Glucose levels in culture medium were detected following tsRNA-1599 inhibition (C, n = 5, *P < 0.05 vs. Ctrl group; #P < 0.05 between the marked group; Kruskal-Wallis's test followed by Bonferroni's post hoc test). NAD+/NADH ratio was determined in HUVECs following tsRNA-1599 inhibition and the absorbance was measured at 450 nm (D, n = 5, *P < 0.05 vs. Ctrl group; #P < 0.05 between the marked group; Kruskal-Wallis's test followed by Bonferroni's post hoc test). Pyruvate level was determined in HUVECs following tsRNA-1599 inhibition and the absorbance was measured at 520 nm (E, n = 4, *P < 0.05 vs. Ctrl group; #P < 0.05 between the marked group; One-way ANOVA followed by Bonferroni's post hoc test). (F) Representative images of choroidal explants cultured in the presence or absence of tsRNA-1599 agomir with or without 2-DG (50 mM). The sprouting potency of choroidal explants were photographed on day 4, day 5, and day 6 (Scale bar, 500 μm).
Figure 8
Figure 8
tsRNA-1599 regulates endothelial angiogenic effects by interacting with YBX1. (A) Silver staining of tsRNA-1599-associated proteins following RNA pull-down assays by tsRNA-1599 mimic, scramble tsRNA mimic (NC), and streptavidin beads. (B) Western blot analysis of YBX1 expression following RNA pull-down assays using tsRNA-1599 mimic or scramble tsRNA mimic (NC) (n = 3, *P < 0.05 between the marked group, One-way ANOVA followed by Bonferroni test). (C) RIP-qPCR analysis of tsRNA-1599 expression following RNA immunoprecipitation using anti-YBX1 or IgG in HUVECs (n = 6, *P < 0.05 between the marked group, Student t test). (D) Western blot analysis of YBX1 expression following RNA pull-down assays using tsRNA-1599 agomir or scramble tsRNA agomir (NC) in RPE-choroid-sclera complex (n = 3, *P < 0.05 between the marked group, One-way ANOVA followed by Bonferroni test). (E) Immunostaining assays and RNA-FISH assays were conducted to detect the expression of tsRNA-1599 (red) and YBX1 (green) in HUVECs. (F and G) HUVECs were transfected with NC mimic, tsRNA-1599 mimic, NC inhibitor, or tsRNA-1599 inhibitor for 24 h. qPCR assays (F, n = 3) and western blots (G, n = 4) were conducted to detect the expression of YBX1. *P < 0.05 between the marked group; “ns” indicates no statistical significance; Student t test.
Figure 9
Figure 9
tsRNA-1599 regulates HK2 expression via interacting with YBX1. (A-B) HUVECs were transfected with negative control (NC) mimic (30 nM), tsRNA-1599 mimic (30 nM), NC inhibitor (30 nM), or tsRNA-1599 inhibitor (30 nM) for 48 h. qPCR assays (A, n = 3) and western blots were conducted to detect the expression of selected genes (B, n = 4). *P < 0.05 between the marked group; Student t test; “ns” represents no statistical significance. (C) The predicted result of binding sites between YBX1 and HK2 on the JASPAR website. (D) ChIP-qPCR results of the predicted binding sites (n = 4, *P < 0.05 between the marked group; “ns” represents no statistical significance; Student t test). (E - H) HUVECs were transfected with NC siRNA or YBX1 siRNA for 24 h. qPCR assays (E, n = 3, One-way ANOVA followed by Bonferroni's post hoc test, Scale bar, 20 μm) and western blots were conducted to detect the expression of YBX1 or HK2 (F - G, n = 4, Student t test, *P < 0.05 between the marked group). (H) qPCR assays were used to verify the expression of HK2 (n = 3, *P < 0.05 vs. NC group, Student t test). (I - J) HUVECs were transfected with negative control (NC) mimic (30 nM) plus NC siRNA (30 nM), NC mimic (30 nM) plus YBX1 siRNA (30 nM), NC siRNA (30 nM) plus tsRNA-1599 mimic (30 nM), YBX1 siRNA (30 nM) plus tsRNA-1599 mimic (30 nM) for 48 h. qPCR assays (I, n = 3) and western blots (J, n = 4) were conducted to detect the expression of HK2. *P < 0.05 between the marked group, Student t test.

References

    1. Eelen G, Treps L, Li X, Carmeliet P. Basic and therapeutic aspects of angiogenesis updated. Circ Res. 2020;127:310–29. - PubMed
    1. Carmeliet P, Jain RK. Angiogenesis in cancer and other diseases. Nature. 2000;407:249–57. - PubMed
    1. Madu CO, Wang S, Madu CO, Lu Y. Angiogenesis in breast cancer progression, diagnosis, and treatment. J Cancer. 2020;11:4474–94. - PMC - PubMed
    1. Li X, Carmeliet P. Targeting angiogenic metabolism in disease. Science. 2018;359:1335–6. - PubMed
    1. Risau W. Mechanisms of angiogenesis. Nature. 1997;386:671–4. - PubMed

Publication types

MeSH terms