. 2024 Jun 17;14(9):3719-3738.
doi: 10.7150/thno.92771. eCollection 2024.

FUNDC1 alleviates doxorubicin-induced cardiotoxicity by restoring mitochondrial-endoplasmic reticulum contacts and blocked autophagic flux

Affiliations

FUNDC1 alleviates doxorubicin-induced cardiotoxicity by restoring mitochondrial-endoplasmic reticulum contacts and blocked autophagic flux

Weibin He et al. Theranostics. .

Abstract

Rationale: Autophagy dysregulation is known to be a mechanism of doxorubicin (DOX)-induced cardiotoxicity (DIC). Mitochondrial-Endoplasmic Reticulum Contacts (MERCs) are where autophagy initiates and autophagosomes form. However, the role of MERCs in autophagy dysregulation in DIC remains elusive. FUNDC1 is a tethering protein of MERCs. We aim to investigate the effect of DOX on MERCs in cardiomyocytes and explore whether it is involved in the dysregulated autophagy in DIC. Methods: We employed confocal microscopy and transmission electron microscopy to assess MERCs structure. Autophagic flux was analyzed using the mCherry-EGFP-LC3B fluorescence assay and western blotting for LC3BII. Mitophagy was studied through the mCherry-EGFP-FIS1 fluorescence assay and colocalization analysis between LC3B and mitochondria. A total dose of 18 mg/kg of doxorubicin was administrated in mice to construct a DIC model in vivo. Additionally, we used adeno-associated virus (AAV) to cardiac-specifically overexpress FUNDC1. Cardiac function and remodeling were evaluated by echocardiography and Masson's trichrome staining, respectively. Results: DOX blocked autophagic flux by inhibiting autophagosome biogenesis, which could be attributed to the downregulation of FUNDC1 and disruption of MERCs structures. FUNDC1 overexpression restored the blocked autophagosome biogenesis by maintaining MERCs structure and facilitating ATG5-ATG12/ATG16L1 complex formation without altering mitophagy. Furthermore, FUNDC1 alleviated DOX-induced oxidative stress and cardiomyocytes deaths in an autophagy-dependent manner. Notably, cardiac-specific overexpression of FUNDC1 protected DOX-treated mice against adverse cardiac remodeling and improved cardiac function. Conclusions: In summary, our study identified that FUNDC1-meditated MERCs exerted a cardioprotective effect against DIC by restoring the blocked autophagosome biogenesis. Importantly, this research reveals a novel role of FUNDC1 in enhancing macroautophagy via restoring MERCs structure and autophagosome biogenesis in the DIC model, beyond its previously known regulatory role as an mitophagy receptor.

Keywords: FUNDC1; Mitochondrial-Endoplasmic Reticulum Contacts; autophagy; cardiotoxicity; doxorubicin.


Conflict of interest statement

Competing Interests: The authors have declared that no competing interest exists.

Figures

Figure 1
Figure 1
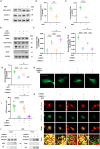
DOX blocked autophagosome biogenesis in cardiomyocytes. (A) AC16 were treated with 2 μM DOX for 24 h followed by 2 h CQ treatment, LC3B and p62 were detected with immunoblotting; (B) Quantitative analysis of LC3B II (n = 4); (C) AC16 were treated with 2 μM DOX for 24 h, mRNA level of MAP1LC3B were detected with qPCR, (n = 6); (D) AC16 were cotransfected with p62-mCherry and EGFP-LC3 for 24 h followed by 2 μM DOX treatment for another 24 h and starvation for 2 h. Images were acquired with confocal microscope. Scale bar:5 μm; (E) AC16 were treated with 2 μM DOX for 24 h followed by 2 h starvation, LC3 were detected with immunostaining. Scale bar:20 μm (F) Quantitative analysis of LC3 puncta (n = 60-90 cells/group); (G) AC16 were transfected with EGFP-LC3 for 24 h followed by 2 μM DOX treatment for another 24 h, and starvation 2 h. Images were acquired with confocal microscope. Scale bar:5 μm; (H) AC16 were transfected with mCherry-EGFP-LC3B for 24 h followed by 2 μM DOX treatment for another 24 h and starvation for 2 h. Images were acquired with confocal microscope. Scale bar:5 μm; (I) Quantitative analysis of numbers of autolysosome and autophagosome (n = 10 cells/group); (J) Quantitative analysis the autolysosome-to-autophagosome ratio (n = 10 cells/group). ns: no significance, *** P < 0.001; **** P < 0.0001; DOX: doxorubicin; CQ: chloroquine.
Figure 2
Figure 2
DOX interrupted mitochondria-endoplasmic reticulum contacts formation. (A) AC16 were treated with indicated concentration of DOX for 24 h, MFN1, MFN2, FUNDC1 and IP3R1 were detected with immunoblotting; (B) Quantitative analysis of expression of FUNDC1 (n = 4); (C) AC16 were treated with 2 μM DOX for 24 h, mRNA level of MFN1/2, FUNDC1, IP3R1/2, VDAC1 and GRP75 were detected with qPCR; (D) AC16 were transfected with ER-DsRed for 24 h followed by different concentrations of DOX treatment for another 24 h, immunostaining of TOM20 indicated mitochondria, images were acquired with confocal microscope. Scale bar:5 μm; (E) Quantitative analysis of Pearson's coefficients indicating colocalization of mitochondria and endoplasmic reticulum (n = 10-17 cells/group); (F) Transmission electron microscope analysis of mitochondria and endoplasmic reticulum, M: mitochondria, ER: endoplasmic reticulum, asterisk indicated MERCs. Scale bar:500 nm. MERCs formation was quantified; (G) mito-R-GECO1 stable cell line was subjected to 24 h DOX treatment, images were acquired with confocal microscope, Scale bar:20 μm; mito-R-GECO1 intensity was quantified; (H) mito-R-GECO1 stable cell line was subjected to 24 h DOX treatment, cells were stimulated with 0.2 mM histamine, followed by time series imaging by confocal microscope. Scale bar:5 μm; (I) The intensity of mito-R-GECO1 over time was quantified (n = 6 cells/group); ns: no significance; * P < 0.05; ** P <0.01; *** P < 0.001; **** P < 0.0001, DOX: doxorubicin.
Figure 3
Figure 3
FUNDC1 overexpression restored MERCs structures in DOX-treated cardiomyocytes. (A) Scheme graph indicated that full length FUNDC1 domain in which red domain represent transmembrane domain and yellow domain represent the AA7-48 necessary for tethering mitochondria to ER. The FUNDC1△ 7-48 indicated truncated FUNDC1 which lack AA 7-48 and is supposed to be unable to promote MERCs formation; (B) Cardiomyocytes were transfected with ER-DsRed for 24 h followed by 2 μM DOX treatment for 24 h, immunostaining of TOM20 indicated mitochondria, images were acquired with confocal microscope, Scale bar:5 μm, Pearson's coefficients indicating colocalization of mitochondria and endoplasmic reticulum were quantified, (n = 10-17 cells/group); (C) Transmission electron microscope analysis of mitochondria and endoplasmic reticulum, M: mitochondria, ER: endoplasmic reticulum, asterisk indicated MERCs. Scale bar:500 nm. MERCs formation was quantified; (D) mito-R-GECO1 stable cell line stably expressing vector or FUNDC1 were subjected to 24 h DOX treatment, images were acquired with confocal microscope. Scale bar:20 μm; mito-R-GECO1 intensity was quantified; (E) mito-R-GECO1 stable cell line stably expressing vector or FUNDC1 were subjected to 24 h DOX treatment, cells were stimulated with 0.2 mM histamine, followed by time series imaging by confocal microscope. Scale bar:5 μm; (F) The intensity of mito-R-GECO1 over time was quantified (n = 6 cells/group); ns: no significance; * P < 0.05; **** P < 0.0001, DOX: doxorubicin.
Figure 4
Figure 4
FUNDC1 overexpression restored the blocked autophagic flux in DOX-treated cardiomyocytes. (A) AC16 were transfected with Vector or FUNDC1 plasmid for 24 h followed by 2 μM DOX treatment for 24 h and CQ treatment for 2 h. LC3B, p62 and FUNDC1 were detected with immunoblotting; (B) Quantitative analysis of LC3B II (n = 3); (C) Autophagic flux was calculated from the change in normalized LC3-II levels to GAPDH upon CQ treatment in left panel, (n = 3); (D) AC16 were transfected with mCherry-EGFP-LC3B for 24 h followed by 2 μM DOX treatment for 24 h and starvation for 2 h. Images were acquired with confocal microscope. Scale bar:5 μm; (E) Quantitative analysis of numbers of autolysosome and autophagosome (n = 10-20 cells/group); (F) Quantitative analysis the ratio of autolysosome and autophagosome. (n = 10-20 cells/group); ns: no significance; * P < 0.05; ** P <0.01; *** P < 0.001, DOX: doxorubicin.
Figure 5
Figure 5
FUNDC1 enhanced autophagosome biogenesis by facilitating ATG5-ATG12/ATG16L1 complex formation. (A) AC16 were treated with indicated concentration of DOX for 24 h, ATG5-ATG12 and ATG16L1 were detected with immunoblotting; (B) Quantitative analysis of ATG5-ATG12 (n = 4); (C) Quantitative analysis of ATG16L1 (n = 4); (D) FUNDC1 or FUNDC1△ stable cell line were subjected to DOX treatment for 24 h, ATG5, ATG5-ATG12 and ATG16L1 were detected with immunoblotting; (E) Quantitative analysis of ATG5 (n = 4); (F) Quantitative analysis of ATG5-ATG12 (n = 4); (G) Quantitative analysis of ATG16L1 (n = 4); (H) FUNDC1 or FUNDC1△ stable cell line were transfected with EGFP-ATG5 for 24 h followed by 2 μM DOX treatment for 24 h and starvation for 2 h, Images were acquired with confocal microscope. Scale bar:5 μm; (I) Quantitative analysis of ATG5 puncta (n = 11-15 cells/group); (J) ATG5-HA or/and FUNDC1 stable cell line were subjected to DOX treatment for 24 h. Immunoprecipitation were performed anti-HA antibody followed by immunoblotting of ATG16L1; (K) Full length FUNDC1 and FUNDC1△ stable cell line were co-transfected with p62-mCherry and EGFP-LC3 for 24 h followed by 2 μM DOX treatment for 24 h and starvation for another 2 h. Images were acquired with confocal microscope. Scale bar:5 μm; ns: no significance; *** P < 0.001; **** P < 0.0001, DOX: doxorubicin.
Figure 6
Figure 6
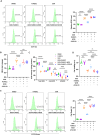
FUNDC1 overexpression alleviated DOX-induced oxidative stress and cardiomyocytes death in an autophagy-dependent manner. Negative control or ATG5 knock-down (ATG5 KD) cell lines were treated with 2 μM DOX or/and 10 μM wortmannin for 24 h. (A) ROS was detected by DCFH probe, relative ROS level in each group was quantified, (n = 6); (B) Relative MDA level in each group, (n = 6); (C) SOD activities were determined in each group. (n = 6); (D) Cell viability was determined by CCK-8 assay (n = 6); (E) Cell death was determined by SYTOX Green staining (n = 6); ns: no significance; ** P <0.01; *** P < 0.001; **** P < 0.0001, DOX: doxorubicin.
Figure 7
Figure 7
Cardiac-specific overexpression of FUNDC1 restored MERCs structures and blocked autophagic flux in vivo. (A) Immunoblotting of FUNDC1 in heart tissue; (B) Quantitative analysis of FUNDC1 expression in heart tissue, (n = 6); (C) Immunohistochemistry staining of FUNDC1 in heart tissue; (D) Representative TEM images of MERCs in heart tissue, mt: mitochondria-yellow, TT: transversal tubule-blue; junctional sarcoplasmic reticulum (jSR)-red; (E) Immunoblotting of LC3B in heart tissue; (F) Quantitative analysis of LC3B II(n = 3); (G) Autophagic flux was calculated from the change in normalized LC3-II levels to GAPDH upon BFA1 treatment in left panel, (n = 3). (H) Representative images of immunostaining of LC3 in heart tissue. ns: No significance, Scale bar:20 μm; (I) Immunoblotting of ATG5-ATG12 and ATG16L1 in heart tissue; ns: no significance; * P < 0.05; *** P < 0.001; **** P < 0.0001, DOX: doxorubicin; NS: Normal saline; BFA1: Bafilomycin A1.
Figure 8
Figure 8
Cardiac-specific overexpression of FUNDC1 ameliorated DOX-induced cardiac dysfunction and remodeling in vivo. (A) Representative echocardiographic images of cardiac function; (B-D) Quantitative analysis of LVEF, LVFS and cardiac output (n = 10/group); (E) Heart weight (HW)-to-tibia length (TL) ratio was calculated; (F) An overview of mice heart in each group; (G-H) Representative images of Masson Trichrome staining and quantitative analysis of fibrosis level. (n = 4). * P < 0.05; ** P <0.01; *** P < 0.001; **** P < 0.0001.

References

    1. Kalyanaraman B. Teaching the basics of the mechanism of doxorubicin-induced cardiotoxicity: Have we been barking up the wrong tree? Redox Biol. 2020;29:101394. - PMC - PubMed
    1. Wu L, Wang L, Du Y, Zhang Y, Ren J. Mitochondrial quality control mechanisms as therapeutic targets in doxorubicin-induced cardiotoxicity. Trends Pharmacol Sci. 2023;44(1):34–49. - PubMed
    1. Bartlett JJ, Trivedi PC, Pulinilkunnil T. Autophagic dysregulation in doxorubicin cardiomyopathy. J Mol Cell Cardiol. 2017;104:1–8. - PubMed
    1. Chen Q, Meléndez GC, Lesnefsky EJ. New Insight Into Cardioprotection From Anthracyclines: Still Converging on the Mitochondria. JACC CardioOncol. 2023;5(3):374–376. - PMC - PubMed
    1. Csordás G, Renken C, Várnai P, Walter L, Weaver D, Buttle KF. et al. Structural and functional features and significance of the physical linkage between ER and mitochondria. J Cell Biol. 2006;174(7):915–921. - PMC - PubMed

Publication types

MeSH terms