. 2024 Jun 26:13:319-333.
doi: 10.2147/ITT.S458278. eCollection 2024.

Deciphering Natural Killer Cell Cytotoxicity Against Medulloblastoma in vitro and in vivo: Implications for Immunotherapy

Affiliations

Deciphering Natural Killer Cell Cytotoxicity Against Medulloblastoma in vitro and in vivo: Implications for Immunotherapy

Melanie Gauthier et al. Immunotargets Ther. .

Abstract

Purpose: Medulloblastoma (MB) is the most prevalent paediatric brain tumour. Despite improvements in patient survival with current treatment strategies, the quality of life of these patients remains poor owing to the sequelae and relapse risk. An alternative, or, in addition to the current standard treatment, could be considered immunotherapy, such as Natural Killer cells (NK). NK cells are cytotoxic innate lymphoid cells that play a major role in cancer immunosurveillance. To date, the mechanism of cytotoxicity of NK cells, especially regarding the steps of adhesion, conjugation, cytotoxic granule polarisation in the cell contact area, perforin and granzyme release in two and three dimensions, and therapeutic efficacy in vivo have not been precisely described.

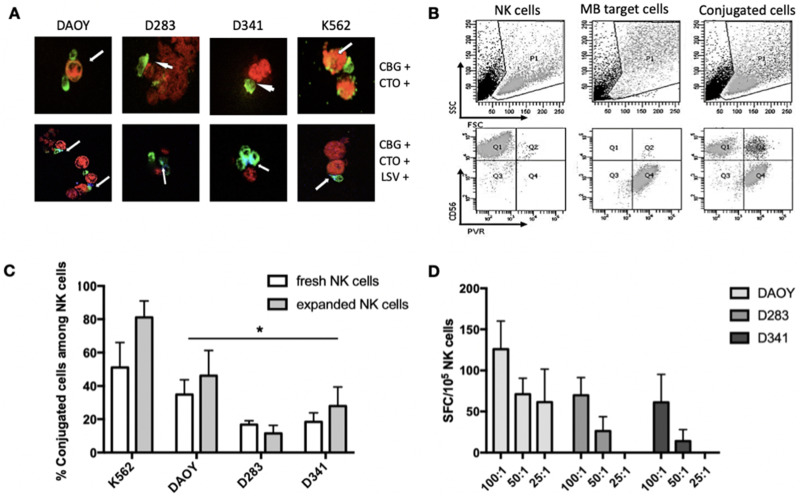
Materials and methods: Each step of NK cytotoxicity against the three MB cell lines was explored using confocal microscopy for conjugation, Elispot for degranulation, flow cytometry, and luminescence assays for target cell necrosis and lysis and mediators released by cytokine array, and then confirmed in a 3D spheroid model. Medulloblastoma-xenografted mice were treated with NK cells. Their persistence was evaluated by flow cytometry, and their efficacy in tumour growth and survival was determined. In addition, their effects on the tumour transcriptome were evaluated.

Results: NK cells showed variable affinities for conjugation with MB target cells depending on their subgroup and cytokine activation. Chemokines secreted during NK and MB cell co-culture are mainly associated with angiogenesis and immune cell recruitment. NK cell cytotoxicity induces MB cell death in both 2D and 3D co-culture models. NK cells initiated an inflammatory response in a human MB murine model by modulating the MB cell transcriptome.

Conclusion: Our study confirmed that NK cells possess both in vitro and in vivo cytotoxic activity against MB cells and are of interest for the development of immunotherapy.

Keywords: adoptive transfer; cancer; immune cells; medulloblastoma.


Conflict of interest statement

The authors report no conflicts of interest in this work.

Figures

Figure 1
Figure 1
Phenotype analysis of MB cell lines and primary NK cells before and after expansion. (A) Immunomodulatory markers and NK cell activating ligands on MB cell lines (pink) and Isotopic controls (Orange). Annotated pie charts showing NK cell phenotype at D0 and during expansion (D14 and D21) regarding (B) CD11b and CD27 expression, (C) CD62L and CD57 maturation markers, (D) CD56high/low and CD16 expression, (E) DNAM-1 and NKp44 activating receptors, (F) TIM-3 and PD-1 exhaustion markers. (G) Percentage of TIGIT+CD56+ NK cells for n=4 representative cultures. (H) NK cell expansion factor during expansion period (n=6).
Figure 2
Figure 2
Conjugation, granule polarization and exocytosis as steps of the cytotoxicity mechanism against MB. (A) Microscopy imaging (40X) of NK cells conjugation with K562, or MB cell lines. NK cells, target cells and lysosomal granules were respectively stained in green(CBG), red (CTO) and blue (LV). White arrows indicate conjugation area of NK cells with target cells in the upper line, and lysosomal granules polarization in the bottom line. (B) Flow cytometry gating strategy showing conjugated cells (CD56+ PVR+) among NK (CD56+) and MB cells (PVR+) co-culture. The upper line shows the FSC/SSC gate excluding cell debris showing NK cells alone (left panel), MB cells alone (middle panel) and conjugates (right panel) and the lower line shows conjugated cells in the CD56+/PVR+ Q2 quadrant. (C) Percentages of conjugated NK cells among total (unstimulated) fresh or expanded NK cells with K562, DAOY, D283 and D341 (ANOVA test; * p<0.05). (D) Expanded NK cells granzyme B secretion after co-culture with MB target cell lines at various E:T ratios (100:1, 50:1, 25:1), ELISPOT results expressed in Spot Forming Colony (SFC) per 105 NK cells (n=3).
Figure 3
Figure 3
Cytokine Array analysis of NK cells and MB cells during co-culture. (A) Cytokines detected by membrane array analysis. On each membrane, negative and positive control spots have two to four repeats in upper right and lower left corner. The average intensity of duplicates of the 42 factors was normalized to negative controls. (B) Raw cytokine array membrane after incubation with conditioned medium from NK cells or MB cells, or from 24h co-culture. Underlined cytokine spots are IL-6 secretion spots. (C) heatmap of 14 most secreted cytokines expressed as percentage of the maximal signal intensity.
Figure 4
Figure 4
Cytotoxic activity of NK cells in 2D and 3D DAOY spheroid co-culture models. (A) Quantitative analysis by flow cytometry of DAOY, D283 and D341 necrosis induced by unstimulated or expanded NK cells at a 5:1 (E:T ratio. K562 is used as a control. (B) Quantitative analysis by bioluminescence of specific lysis induced by expanded NK cells in co-culture with the 3 MB cell lines at various (E)T ratios. (C) Follow-up of spheroid formation during 14 days after 104 DAOY cells/well seeding, imaged by inverted microscopy (4X, scale 250µm). (D) Spheroid imaging, seeded at various cell densities before (H0) and after (H24) co-culture with expanded NK cells at 10:1 (E)T ratio. (E) Spheroid diameter (µm) variation after NK cell co-culture at 10:1 (n=7). (F) Diameter variation (µm) of 1×10⁴ seeded DAOY cell spheroid after 24h of co-culture with expanded NK cells at various (E)T ratios (n=4). (t test, * p<0.05; ** p<0.01).
Figure 5
Figure 5
Effect of NK cell adoptive transfer in mouse MB xenograft model (A) Experimental design of in vivo study. Mice were randomized in control group (n=4), IL-15 group (n=6) and NK group (n=7) when tumor reached 100 mm3. Following human NK cells (NK group) or saline solution (control and IL-15 group) infusion at day 0, the tumour volume was assessed twice a week with an alternate infusion of 0,5µg intra-tumour or intraperitoneal recombinant human IL-15 (IL-15 and NK group) until animals reached the end-point or day 80 (study’s end). Blood samples were withdrawn every 10 days to follow circulating NK cells percentages by flow cytometry. (B) Percentage of tumour volume variation from baseline over time. The * indicates the point from which the tumour volume in the NK group became significantly lower than in the control group (D28) (p<0.05, Mann–Whitney test). Black arrow indicates the day when the median survival of IL-15 group animals was reached, inducing an inflexion in mean tumour volume progression. (C) Kaplan-Meier survival curve. (D) Follow up of activated human NK cells (NKp44+) among PBMC in NK group. (E) Murine (Ly49+) and NKp44+ NK cells percentage at end-point (t test; * p<0.05).
Figure 6
Figure 6
Human transcriptome analysis of tumour samples. (A) Vulcano plot of DEG identified between NK and control group (adjusted p value<0.05). (B) Heat-map illustrating Up-regulated (red) and down-regulated DEG (blue) according to each group (log2FC>1). (C) (D) Up-regulated KEGG pathways identified between NK and control group and between NK and IL-15 group. (E) (F) Down-regulated KEGG pathways identified between NK and control group and between NK and IL-15 group. (G) NK cell mediated cytotoxicity pathways (hsa04650, Pathview).
None

References

    1. Gerber NU, Mynarek M, von Hoff K, Friedrich C, Resch A, Rutkowski S. Recent developments and current concepts in medulloblastoma. Cancer Treat Rev. 2014;40(3):356–365. doi:10.1016/j.ctrv.2013.11.010 - DOI - PubMed
    1. Menyhárt O, Győrffy B. Molecular stratifications, biomarker candidates and new therapeutic options in current medulloblastoma treatment approaches. Cancer Metastasis Rev. 2020;39(1):211–233. doi:10.1007/s10555-020-09854-1 - DOI - PMC - PubMed
    1. Taylor MD, Northcott PA, Korshunov A, et al. Molecular subgroups of medulloblastoma: the current consensus. Acta Neuropathol. 2012;123(4):465–472. doi:10.1007/s00401-011-0922-z - DOI - PMC - PubMed
    1. Taylor RE, Bailey CC, Robinson K, et al. Results of a randomized study of preradiation chemotherapy versus radiotherapy alone for nonmetastatic medulloblastoma: the International Society of Paediatric Oncology/United Kingdom Children’s Cancer Study Group PNET-3 Study. J Clin Oncol. 2003;21(8):1581–1591. doi:10.1200/JCO.2003.05.116 - DOI - PubMed
    1. Esfahani K, Roudaia L, Buhlaiga N, Del Rincon SV, Papneja N, Miller WH. A review of cancer immunotherapy: from the past, to the present, to the future. Curr Oncol. 2020;27(Suppl 2):S87–S97. doi:10.3747/co.27.5223 - DOI - PMC - PubMed