. 2024 Jun 14:15:1422869.
doi: 10.3389/fendo.2024.1422869. eCollection 2024.

Evaluation of bone marrow glucose uptake and adiposity in male rats after diet and exercise interventions

Affiliations

Evaluation of bone marrow glucose uptake and adiposity in male rats after diet and exercise interventions

Ronja Ojala et al. Front Endocrinol (Lausanne). .

Abstract

Objectives: Obesity impairs bone marrow (BM) glucose metabolism. Adult BM constitutes mostly of adipocytes that respond to changes in energy metabolism by modulating their morphology and number. Here we evaluated whether diet or exercise intervention could improve the high-fat diet (HFD) associated impairment in BM glucose uptake (BMGU) and whether this associates with the morphology of BM adipocytes (BMAds) in rats.

Methods: Eight-week-old male Sprague-Dawley rats were fed ad libitum either HFD or chow diet for 24 weeks. Additionally after 12 weeks, HFD-fed rats switched either to chow diet, voluntary intermittent running exercise, or both for another 12 weeks. BMAd morphology was assessed by perilipin-1 immunofluorescence staining in formalin-fixed paraffin-embedded tibial sections. Insulin-stimulated sternal and humeral BMGU were measured using [18F]FDG-PET/CT. Tibial microarchitecture and mineral density were measured with microCT.

Results: HFD rats had significantly higher whole-body fat percentage compared to the chow group (17% vs 13%, respectively; p = 0.004) and larger median size of BMAds in the proximal tibia (815 µm2 vs 592 µm2, respectively; p = 0.03) but not in the distal tibia. Switch to chow diet combined with running exercise normalized whole-body fat percentage (p < 0.001) but not the BMAd size. At 32 weeks of age, there was no significant difference in insulin-stimulated BMGU between the study groups. However, BMGU was significantly higher in sternum compared to humerus (p < 0.001) and higher in 8-week-old compared to 32-week-old rats (p < 0.001). BMAd size in proximal tibia correlated positively with whole-body fat percentage (r = 0.48, p = 0.005) and negatively with humeral BMGU (r = -0.63, p = 0.02). HFD significantly reduced trabecular number (p < 0.001) compared to the chow group. Switch to chow diet reversed this as the trabecular number was significantly higher (p = 0.008) than in the HFD group.

Conclusion: In this study we showed that insulin-stimulated BMGU is age- and site-dependent. BMGU was not affected by the study interventions. HFD increased whole-body fat percentage and the size of BMAds in proximal tibia. Switching from HFD to a chow diet and running exercise improved glucose homeostasis and normalized the HFD-induced increase in body fat but not the hypertrophy of BMAds.

Keywords: bone marrow adiposity; bone marrow glucose uptake; diet; exercise; positron emission tomography.


Conflict of interest statement

The authors declare that the research was conducted in the absence of any commercial or financial relationships that could be construed as a potential conflict of interest.

Figures
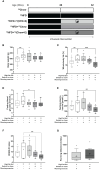
Figure 1
Figure 1
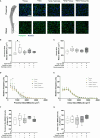
Anthropometrics. (A) Study outline. Eight-week-old rats were fed either chow or high-fat diet (HFD) for 24 weeks. Additionally, after 12 weeks, HFD-fed rats switched either to chow diet, voluntary running exercise, or both for another 12 weeks. (B) Body weight and (C) whole-body fat-percentage at the end of study (n = 16–24/group). Fasting plasma levels of (D) glucose (n = 12–18/group) and (E) insulin (n = 11–16/group). (F) Homeostatic model assessment for insulin resistance (HOMA-IR index; n = 11–16/group). (G) Mean daily running distance of exercising rats (12HFD+12(HFD+E), n = 16; and 12HFD+(12Chow+E), n = 19). Data is presented as boxes representing quartiles and whiskers representing the 10th and 90th percentiles. Median is marked with a single line and mean value is marked with a plus sign in each box. One-way ANOVA with Dunnet’s correction for multiple comparison was performed in (B–F) to compare mean values between groups. The 24HFD group served as the control group. Student’s t-test was performed to compare mean difference between groups in (G) * p < 0.05, ** p < 0.01, *** p < 0.001.
Figure 2
Figure 2
BM insulin-stimulated GU is site- and age-dependent. (A) An example of the regions of interest in coronal (top panel) and axial (bottom panel) planes (highlighted in pink) for the analyses of insulin-stimulated bone marrow glucose uptake (BMGU) in humeral and sternal bone marrow from PET/CT images. CT scans were used as anatomical reference. Color bar represents increasing concentration of radioactivity (higher in red). (B) Sternal and humeral BMGU are higher at 8 weeks of age than those of older animals in the control chow group (n = 6–9/group). There is no difference at 32 weeks in (C) humeral or (D) sternal BMGU between the intervention groups (n = 3–8/group). (E) Sternal BMGU is significantly higher than humeral BMGU at 32 weeks when all intervention groups are combined (n = 32). Data is presented as boxes representing quartiles and whiskers representing the 10th and 90th percentiles. Median is marked with a single line and mean value is marked with a plus sign in each box. Covariance analysis with Tukey’s correction for multiple comparison was performed in (B) and one-way ANOVA with Dunnett’s correction for multiple comparison was performed in (C, D) to compare mean values between groups. The 24HFD group served as the control group for Dunnett’s comparison. Student’s t-test was performed to compare mean difference between groups in (E) * p < 0.05, ** p < 0.01, *** p < 0.001.
Figure 3
Figure 3
BMAds resist diet-induced hypertrophy in response to a dietary and/or exercise intervention. (A) Differences in the morphology of bone marrow adipocytes (BMAds) in different regions of the tibia. BMAds in the proximal tibia are smaller and more interspersed with bone marrow cells than those in the distal tibia. Scale bar represents 100 µm. High-fat diet increases the median size of BMAds in (B) the proximal tibia, but not in (C) the distal tibia. Frequency distribution of the size of BMAds in (D) proximal and (E) distal tibia. A bin width of 200 µm2 was applied from a lower and upper bin center of 300 µm2 and 3900 µm2, respectively. Small letters indicate a significant difference in the mean frequency distribution between the high-fat group (24HFD) and age-matched group (24Chow, a) or the exercising group (12HFD+12(HFD+E), b) or the combination group (12HFD+12(Chow+E), c). (F, G) The density of BMAds is not affected by study intervention. One-way ANOVA with Dunnett’s correction for multiple comparison was performed in (B, C, F, G) to compare mean values between groups. Data is presented as boxes representing quartiles and whiskers representing the 10th and 90th percentiles. Median is marked with a single line and mean value is marked with a plus sign in each box. Covariance analysis with Dunnett’s correction for multiple comparison was performed in (D, E) to compare group wise mean frequency distribution in each bin. The 24HFD group served as the control group for Dunnett’s comparison. n = 4–10/group. * p < 0.05.
Figure 4
Figure 4
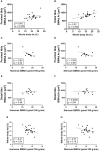
The size of BMAds in the proximal tibia inversely correlates with humeral BMGU. (A, B) The size of bone marrow adipocytes (BMAds) in proximal (n = 32) and distal (n = 31) tibia correlates positively with whole-body fat percentage. In rats exposed to high-fat diet, (C-F) the size of BMAds in the proximal tibia (n = 16), but not distal (n = 15), inversely correlates with humeral, but not sternal, insulin-stimulated bone marrow glucose uptake (BMGU). In addition, (G, H) humeral, but not sternal, BMGU correlated with whole-body fat percentage (n = 25) among rats exposed to high-fat diet. Pearson’s correlation analysis was performed for all analyses.

References

    1. Cawthorn WP, Scheller EL, Learman BS, Parlee SD, Simon BR, Mori H, et al. . Bone marrow adipose tissue is an endocrine organ that contributes to increased circulating adiponectin during caloric restriction. Cell Metab. (2014) 20:368–75. doi: 10.1016/j.cmet.2014.06.003 - DOI - PMC - PubMed
    1. Attané C, Estève D, Chaoui K, Iacovoni JS, Corre J, Moutahir M, et al. . Human bone marrow is comprised of adipocytes with specific lipid metabolism. Cell Rep. (2020) 30:949–58.e6. doi: 10.1016/j.celrep.2019.12.089 - DOI - PubMed
    1. Pham TT, Ivaska KK, Hannukainen JC, Virtanen KA, Lidell ME, Enerbäck S, et al. . Human bone marrow adipose tissue is a metabolically active and insulin-sensitive distinct fat depot. J Clin Endocrinol Metab. (2020) 105:1–11. doi: 10.1210/clinem/dgaa216 - DOI - PMC - PubMed
    1. Scheller EL, Khandaker S, Learman BS, Cawthorn WP, Anderson LM, Pham HA, et al. . Bone marrow adipocytes resist lipolysis and remodeling in response to β-adrenergic stimulation. Bone. (2019) 118:32–41. doi: 10.1016/j.bone.2018.01.016 - DOI - PMC - PubMed
    1. Scheller EL, Doucette CR, Learman BS, Cawthorn WP, Khandaker S, Schell B, et al. . Region-specific variation in the properties of skeletal adipocytes reveals regulated and constitutive marrow adipose tissues. Nat Commun. (2015) 6:7808. doi: 10.1038/ncomms8808 - DOI - PMC - PubMed