[Preprint]. 2024 Jun 17:2024.06.15.599126.
doi: 10.1101/2024.06.15.599126.

Conditional frequency spectra as a tool for studying selection on complex traits in biobanks

Affiliations

Conditional frequency spectra as a tool for studying selection on complex traits in biobanks

Roshni A Patel et al. bioRxiv. .

Update in

Abstract

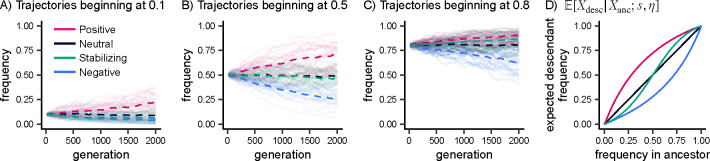
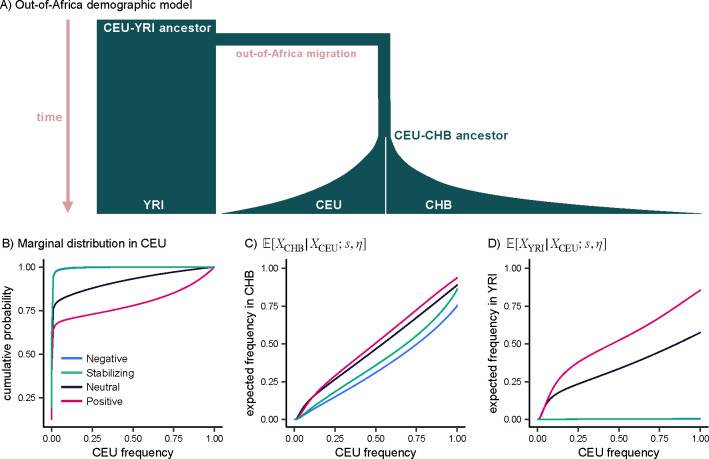
Natural selection on complex traits is difficult to study in part due to the ascertainment inherent to genome-wide association studies (GWAS). The power to detect a trait-associated variant in GWAS is a function of frequency and effect size - but for traits under selection, the effect size of a variant determines the strength of selection against it, constraining its frequency. To account for GWAS ascertainment, we propose studying the joint distribution of allele frequencies across populations, conditional on the frequencies in the GWAS cohort. Before considering these conditional frequency spectra, we first characterized the impact of selection and non-equilibrium demography on allele frequency dynamics forwards and backwards in time. We then used these results to understand conditional frequency spectra under realistic human demography. Finally, we investigated empirical conditional frequency spectra for GWAS variants associated with 106 complex traits, finding compelling evidence for either stabilizing or purifying selection. Our results provide insight into polygenic score portability and other properties of variants ascertained with GWAS, highlighting the utility of conditional frequency spectra.


Figures

Figure 1:
Figure 1:. Overview.
A) Derived allele frequency distribution of 19,269 trait-associated variants and approximately 11 million non-associated variants in the UK Biobank White British cohort. B) Overview of conditional frequency spectra. Given two populations k and j, the conditional frequency spectrum PXk=xkXj=xj requires us to first consider allele trajectories backwards in time from xj to the frequency in the common ancestor of populations k and j; then ultimately forwards in time to xk.
Figure 2:
Figure 2:. Forward transitions.
A, B, C) Allele frequency trajectories simulated under a Wright-Fisher model. Dashed lines depict the mean frequency across 20 trajectories for each model of selection. D) Expected frequency in a descendant population conditional on the frequency in the ancestral population, computed with fastDTWF. For all panels, the demographic model consists of a constant population size with Ne=10,000 for 2,000 generations, and selection coefficients correspond to |hs|=5.0×10⁻⁴.
Figure 3:
Figure 3:. Backward transitions.
A) Backward transition probabilities can be interpreted as a posterior consisting of a likelihood (i.e., forward transition probabilities), multiplied by a prior (i.e., the marginal distribution in the ancestor). B-E) Expected frequency in an ancestral population conditional on the frequency in the descendant population, computed with fastDTWF. Selection coefficients correspond to |hs|=5.0×10⁻⁴. Demographic models consist of an ancestral population with Ne=10,000 and B) constant population size for 2,000 generations; C) 0.1Ne bottleneck; D) 0.1Ne bottleneck and exponential growth at a rate of 0.1%; E) exponential growth at a rate of 0.1% each generation. To enhance visibility, overlapping distributions are represented with dashed lines.
Figure 4:
Figure 4:. Out-of-Africa demography.
A) Overview of out-of-Africa demographic model inferred from YRI, CEU, and CHB by Jouganous et al. (2017). Widths and lengths of branches are approximately proportional to population sizes and split times. B) Marginal distribution in CEU predicted by our theoretical results. C, D) Expected frequency in CHB and YRI conditional on the frequency in CEU. For all panels, selection coefficients correspond to |hs|=5.0×10⁻⁴, computed with fastDTWF.
Figure 5:
Figure 5:. Conditional frequency spectra for trait-associated variants.
A, B) Mean frequency in YRI and CHB conditional on UK Biobank White British frequency decile for quantitative trait-associated variants and matched variants. C-H) Mean frequency in YRI conditional on UK Biobank White British frequency decile for variants associated with height, trunk mass, and complex diseases. For all panels, error bars depict the 95% confidence interval for the mean, calculated from 100 bootstrap samples. Points are jittered along the x-axis (UK Biobank White British frequency) for better visibility.
Figure 6:
Figure 6:. Implications for polygenic score portability.
A, B) Expected heterozygosity in CHB and YRI conditional on the frequency in CEU, computed with fastDTWF. Selection coefficients range from |hs|=5.0×10⁻⁵, shown in the lightest shades, to |hs|=5.0×10⁻⁴, shown in the darkest shades. C, D) Mean heterozygosity in CHB and YRI conditional on UK Biobank White British frequency decile for all trait-associated variants and matched variants. Error bars depict the 95% confidence interval for the mean, calculated from 100 bootstrap samples, and points are jittered along the x-axis (UK Biobank White British frequency) for better visibility. For all panels, dotted line corresponds to the heterozygosity in the conditional population.

References

    1. Speed D., Hemani G., Johnson M., and Balding D., 2012. Improved Heritability Estimation from Genome-wide SNPs. American Journal of Human Genetics 91: 1011–1021. - PMC - PubMed
    1. Yang J., Benyamin B., McEvoy B. P., Gordon S., Henders A. K., Nyholt D. R., Madden P. A., Heath A. C., Martin N. G., Montgomery G. W., et al. , 2010. Common SNPs explain a large proportion of the heritability for human height. Nature Genetics 42: 565–569. - PMC - PubMed
    1. Yang J., Bakshi A., Zhu Z., Hemani G., Vinkhuyzen A. A. E., Lee S. H., Robinson M. R., Perry J. R. B., Nolte I. M., van Vliet-Ostaptchouk J. V., et al. , 2015. Genetic variance estimation with imputed variants finds negligible missing heritability for human height and body mass index. Nature Genetics 47: 1114–1120. - PMC - PubMed
    1. Schoech A. P., Jordan D. M., Loh P.-R., Gazal S., O’Connor L. J., Balick D. J., Palamara P. F., Finucane H. K., Sunyaev S. R., and Price A. L., 2019. Quantification of frequency-dependent genetic architectures in 25 UK Biobank traits reveals action of negative selection. Nature Communications 10: 790. - PMC - PubMed
    1. Zeng J., de Vlaming R., Wu Y., Robinson M. R., Lloyd-Jones L. R., Yengo L., Yap C. X., Xue A., Sidorenko J., McRae A. F., et al. , 2018. Signatures of negative selection in the genetic architecture of human complex traits. Nature Genetics 50: 746–753. - PubMed

Publication types

LinkOut - more resources