[Preprint]. 2024 Jun 19:2024.06.18.599612.
doi: 10.1101/2024.06.18.599612.

Sex differences and immune correlates of Long COVID development, persistence, and resolution

Affiliations

Sex differences and immune correlates of Long COVID development, persistence, and resolution

Rebecca E Hamlin et al. bioRxiv. .

Update in

Abstract

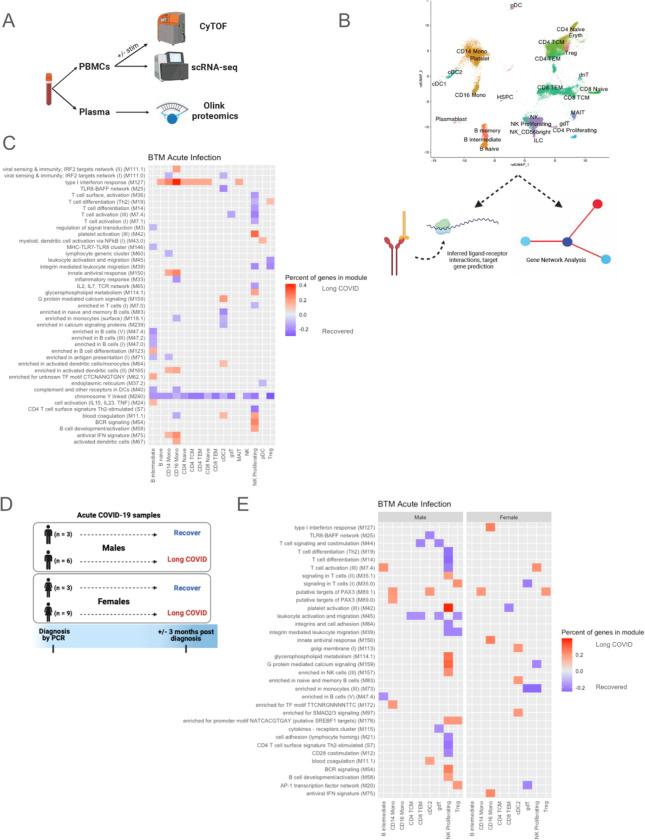
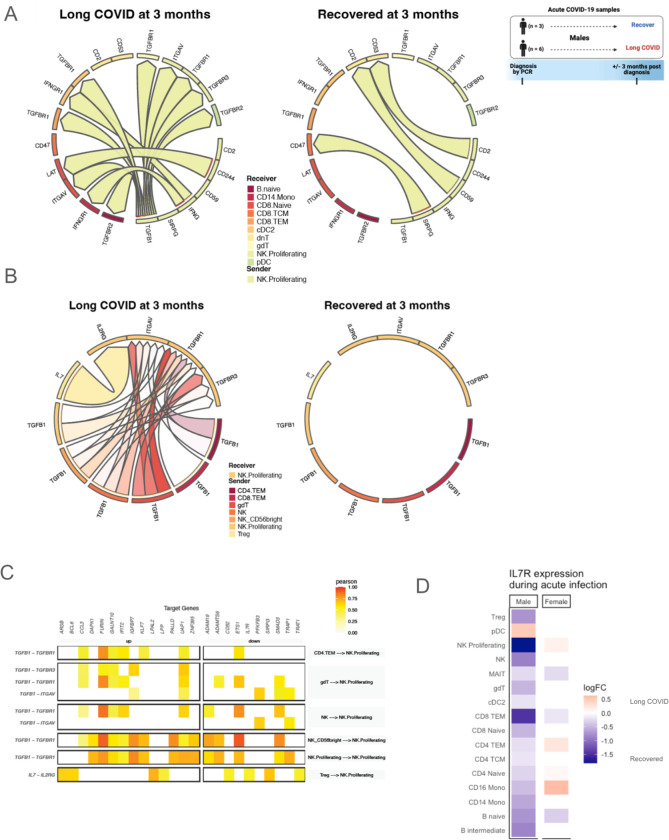
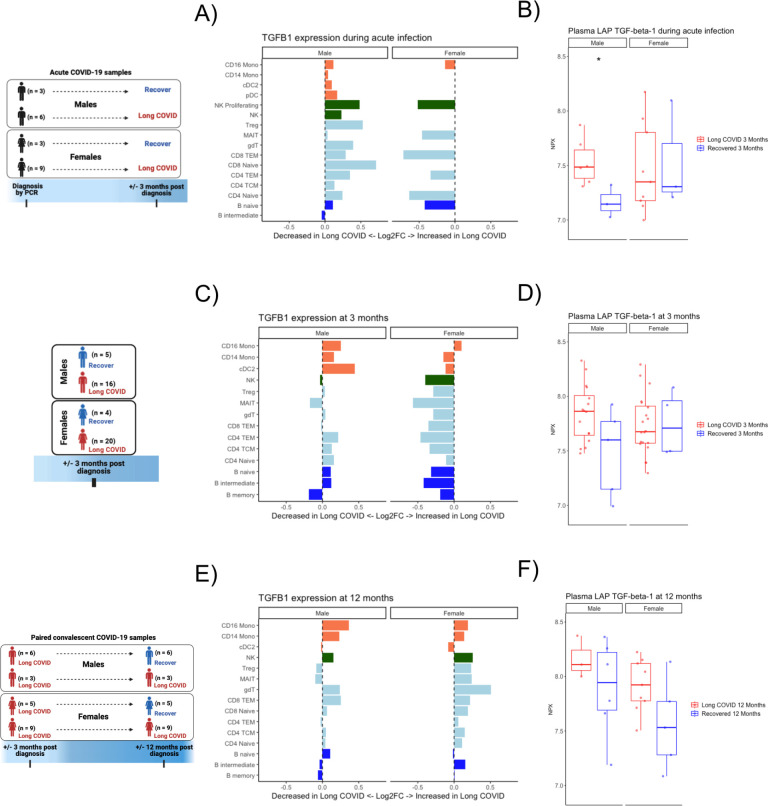
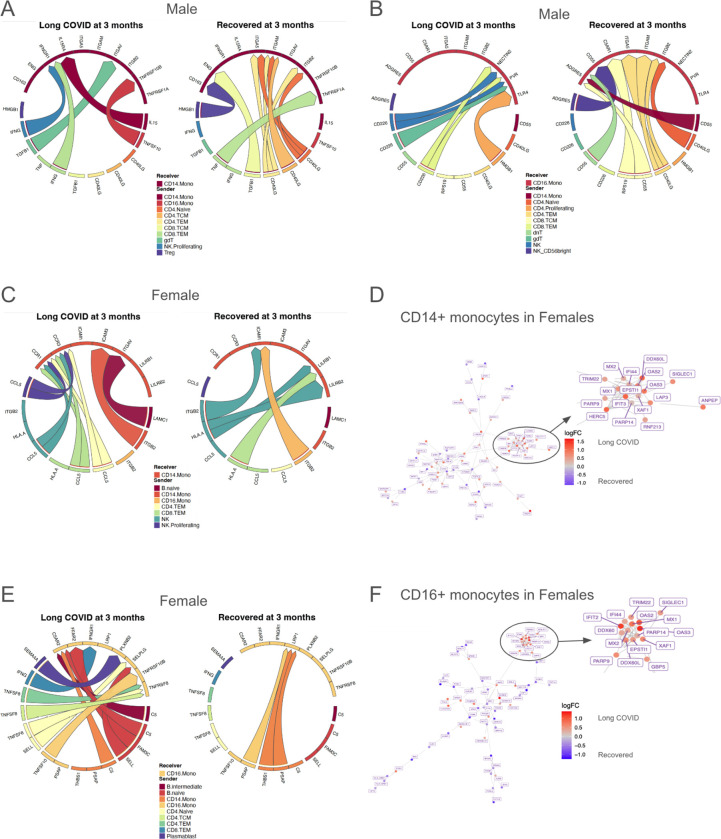
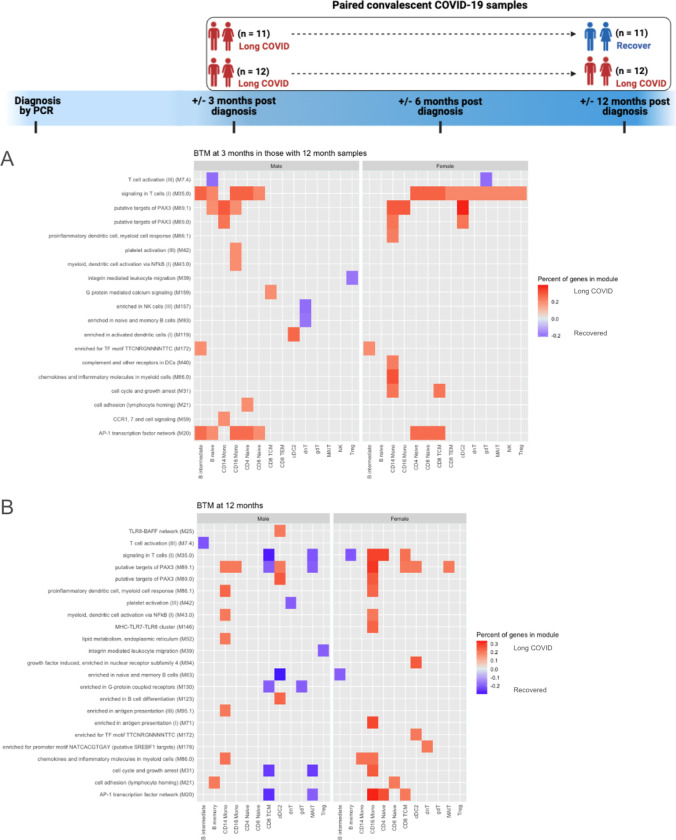
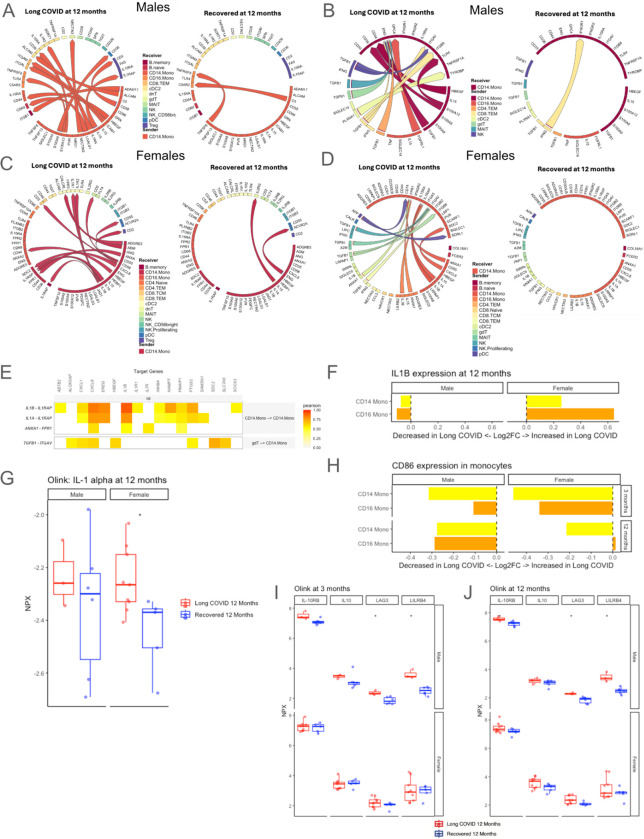
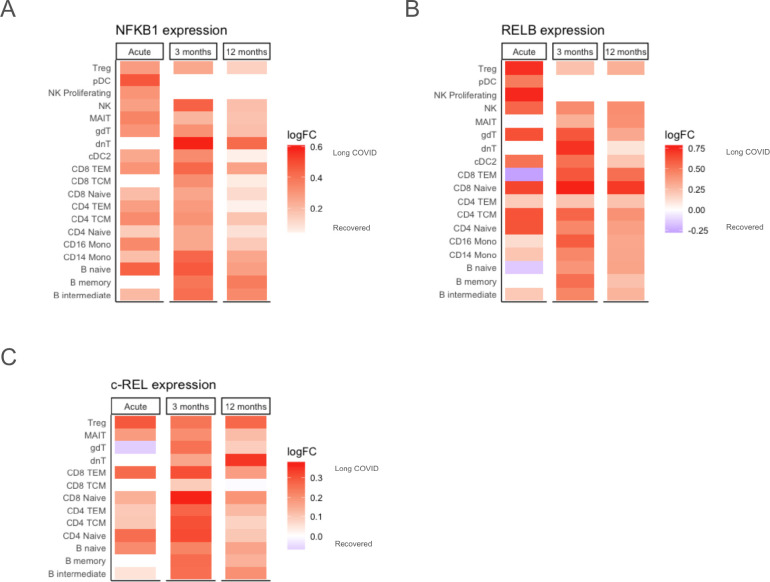
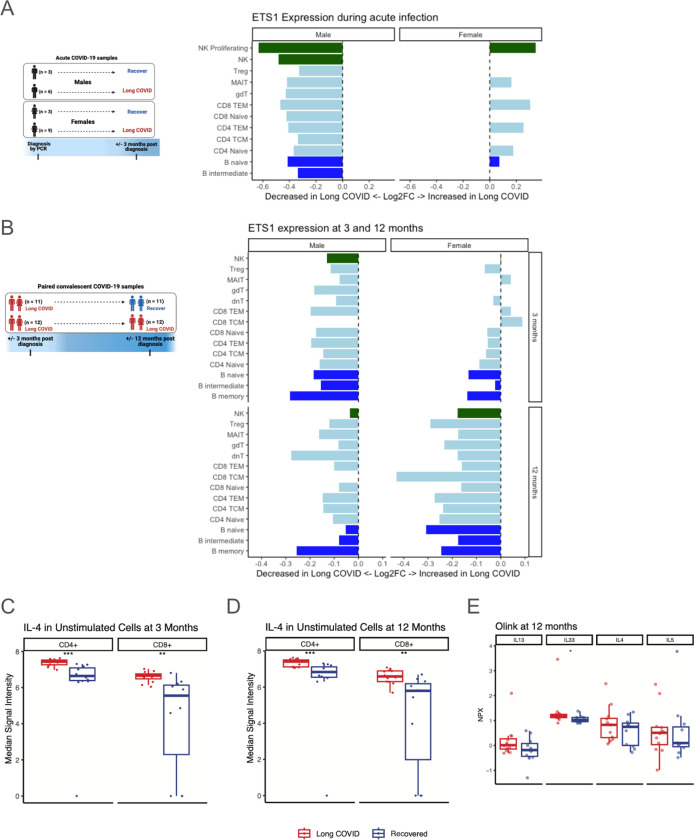
Sex differences have been observed in acute COVID-19 and Long COVID (LC) outcomes, with greater disease severity and mortality during acute infection in males and a greater proportion of females developing LC. We hypothesized that sex-specific immune dysregulation contributes to the pathogenesis of LC. To investigate the immunologic underpinnings of LC development and persistence, we used single-cell transcriptomics, single-cell proteomics, and plasma proteomics on blood samples obtained during acute SARS-CoV-2 infection and at 3 and 12 months post-infection in a cohort of 45 patients who either developed LC or recovered. Several sex-specific immune pathways were associated with LC. Specifically, males who would develop LC at 3 months had widespread increases in TGF-β signaling during acute infection in proliferating NK cells. Females who would develop LC demonstrated increased expression of XIST, an RNA gene implicated in autoimmunity, and increased IL1 signaling in monocytes at 12 months post infection. Several immune features of LC were also conserved across sexes. Both males and females with LC had reduced co-stimulatory signaling from monocytes and broad upregulation of NF-κB transcription factors. In both sexes, those with persistent LC demonstrated increased LAG3, a marker of T cell exhaustion, reduced ETS1 transcription factor expression across lymphocyte subsets, and elevated intracellular IL-4 levels in T cell subsets, suggesting that ETS1 alterations may drive an aberrantly elevated Th2-like response in LC. Altogether, this study describes multiple innate and adaptive immune correlates of LC, some of which differ by sex, and offers insights toward the pursuit of tailored therapeutics.


Conflict of interest statement

Competing interests: Upinder Singh reports research support from National Institutes of Health, Agency for Healthcare Research and Quality, and Pfizer, Inc.; she is an advisor to Regeneron and Gilead. Catherine Blish is an advisor to Immunebridge and DeepCell on topics unrelated to this research. All other authors declare no competing interests.

Figures

Fig. 1.
Fig. 1.. Experimental design, cell clustering and blood transcription modules (BTM) differences during acute infection.
(A) Experimental design demonstrating use of CyTOF and scRNA-seq for PBMC samples and Olink proteomics for plasma samples. (B) UMAP of scRNA-seq data (subsampled to 100,000 cells to reduce overplotting). Individual cell types were further analyzed with MultiNicheNet for cell-cell communication inference and BioNet for gene network analysis. (C) BTMs of samples during acute infection that differentiated subjects with LC versus those who recovered by 3 months post infection for males and females combined. Only modules in which >10% of the constituent genes had an absolute log2 fold-change (log2FC) >0.25 are plotted. Red tiles indicate higher expression in subjects who developed LC, and blue tiles indicate lower expression. (D) Subjects included in acute SARS-CoV-2 infection analysis, separated by sex and LC versus recovered status 3 months post infection. (E) BTMs during acute infection that differentiated those with LC versus those who recovered by 3 months post infection. Males and females are plotted separately. The top 50 modules, by percent of genes, in which >10% of the constituent genes had an absolute log2 fold-change (log2FC) >0.25, are plotted. Red tiles indicate higher expression in subjects who developed LC, and blue tiles indicate lower expression.
Fig. 2.
Fig. 2.. Proliferating NK cells in males during acute infection.
(A-B) Predicted ligand-receptor interactions involving proliferating NK cells, separated by development of LC symptoms 3 months after acute infection versus resolution of symptoms by 3 months, with (A) showing signaling sent from proliferating NK cells, and (B) showing signaling received by proliferating NK cells. (C) Target genes with altered expression in proliferating NK cells of acutely infected male subjects who will develop LC at 3 months, with associated ligand-receptor interactions. Tile color in the heatmap indicates the Pearson correlation coefficient of expression of the ligand-receptor pair and the target gene. (D) Pseudobulk interleukin-7 receptor (IL7R) expression by cell type during acute infection, separated by sex. Tile color in the heatmap indicates log2FC, with higher expression in those who will develop LC at 3 months post infection indicated by red and lower expression indicated by blue.
Fig 3.
Fig 3.. TGF-β in transcriptomic and plasma proteomics analyses differs by sex in those with LC.
(A) Log2FC of pseudobulk expression of TGFβ1 gene during acute infection, separated by sex. Bars moving to the right of the dashed line indicate increased expression and bars moving to the left indicate reduced expression in those who will develop LC at 3 months post infection. Bar colors correspond to major cell types. (B) Plasma proteomic measurement of LAP TGFβ1 during acute infection, separated by sex. * indicates unadjusted p<0.05 between those who will develop LC vs. recover at 3 months post infection. (C) Log2FC of pseudobulk expression of TGFβ1 gene 3 months after acute infection, separated by sex. Bars moving to the right of the dashed line indicate increased expression and bars moving to the left indicate reduced expression in those with LC at 3 months post infection. Bar colors correspond to major cell types. (D) Plasma proteomic measurement of LAP TGFβ1 in those with LC vs. those who recovered at 3 months post infection, separated by sex. (E) Log2FC of pseudobulk expression of TGFβ1 gene 12 months after acute infection, separated by sex. Bars moving to the right of the dashed line indicate increased expression and bars moving to the left indicate reduced expression in those with persistent LC at 12 months. Bar colors correspond to major cell types. (F) Plasma proteomic measurement of LAP TGFβ1 in those with persistent LC vs. recovery at 12 months post infection, separated by sex.
Fig 4.
Fig 4.. Sex-specific differences in inflammatory monocytes during acute infection.
(A-B) Inferred cell-cell communication, separated by development of LC symptoms 3 months after acute infection versus resolution of symptoms by 3 months, toward (A) CD14+ monocytes and (B) CD16+ monocytes in males. (C) Cell-cell communication inference, separated by development of LC symptoms 3 months after acute infection versus resolution of symptoms by 3 months, toward CD14+ monocytes in females. (D) Differential gene network in CD14+ monocytes in females during acute infection. Red nodes indicate higher expression (log2FC) in those who will develop LC, and blue nodes indicate lower expression. (E) Cell-cell communication inference, separated by development of LC symptoms 3 months after acute infection versus resolution of symptoms by 3 months, toward CD16+ monocytes in females. (F) Differential gene network in CD16+ monocytes in females during acute infection. Red nodes indicate higher expression (log2FC) in those who will develop LC, and blue nodes indicate lower expression.
Fig. 5.
Fig. 5.. BTMs at 3 and 12 months after acute SARS-CoV-2 infection.
(A) BTMs 3 months after acute infection, separated by sex, which differentiate those with persistent LC at 12 months post infection versus those who will recover by 12 months. (B) BTMs 12 months after acute infection, separated by sex, which differentiate those with persistent LC at 12 months post infection versus those who recovered between 3 and 12 months. The top 50 modules, by percent of genes, in which >10% of the constituent genes had an absolute log2 fold-change (log2FC) >0.25, are plotted. Red tiles indicate higher expression in subjects with LC, and blue tiles indicate lower expression.
Fig. 6.
Fig. 6.. Cell-cell communication of CD14+ monocytes, co-stimulatory potential, and markers of T cell exhaustion in persistent LC.
(A-B) Inferred communication (A) originating from, and (B) going toward CD14+ monocytes in males at 12 months post infection, comparing those with persistent LC versus those who recovered by 12 months. (C-D) Inferred cell-cell communication (C) originating from, and (D) going toward CD14+ monocytes in females at 12 months post infection, comparing those with persistent LC versus those who recovered by 12 months. (E) Target genes with increased expression in CD14+ monocytes of females with LC at 12 months, with associated ligand-receptor interactions. Tile color in the heatmap indicates the Pearson correlation coefficient of expression of the ligand-receptor pair and the target gene. (F) Log2FC of pseudobulk IL-1β expression in CD14+ and CD16+ monocytes at 12 months post infection, comparing those with persistent LC and those who recovered by 12 months, separated by sex. Bars moving to the right of the dashed line indicate increased expression and bars moving to the left indicate reduced expression in those with LC. (G) Plasma proteomic measurement of IL-1𝛂 at 12 months post infection, separated by sex. * indicates unadjusted p<0.05 between LC versus recovered subjects. (H) Log2FC of pseudobulk CD86 expression in CD14+ and CD16+ monocytes in sexes combined at 3 and 12 months post infection. Bars moving to the left of the dashed line indicate reduced expression in those with LC. (I-J) Plasma proteomic correlates of T cell exhaustion at (I) 3 months and (J) 12 months in those with persistent LC to 12 months compared to those with LC at 3 months but recovery by 12 months post infection, separated by sex. * indicates unadjusted p<0.05.
Fig. 7.
Fig. 7.. Increased expression of NF-κB transcription factors is associated with LC development and persistence.
(A-C) Higher pseudobulk expression of (A) NFkB1 and (B) RELB across many cell types is associated with LC development after acute infection and persistence for 12 months, with sexes combined. (C) Increased pseudobulk c-REL expression across T and B lymphocytes is associated with LC development after acute infection and persistence for 12 months, with sexes combined. Red tiles indicate higher expression (log2FC) in LC and blue tiles indicate lower expression.
Fig. 8.
Fig. 8.. ETS1 expression is reduced in LC, with a corresponding increase in Th2 polarization.
(A) Log2FC of pseudobulk ETS1 expression during acute infection, comparing those who develop LC at 3 months after acute infection versus those who recover by 3 months, separated by sex. Bar colors correspond to major cell types. (B) Log2FC of pseudobulk ETS1 expression at 3 and 12 months post infection, comparing those with LC at 3 and 12 months versus those with LC at 3 months but recovery by 12 months, separated by sex. Bar colors correspond to major cell types. (C-D) Intracellular IL-4 as measured by CyTOF in CD4+ and CD8+ T cells at (C) 3 months and (D) 12 months post infection, comparing those with persistent LC at 3 and 12 months versus those with LC at 3 months but recovery by 12 months. (E) Plasma proteomic measurements of common Th2 immune cytokines IL-13, IL-33, IL-4, and IL-5, showing higher levels of all markers (only IL-33 meets unadjusted statistical significance) in those with persistent LC at 12 months versus those who recovered by 12 months. * indicates unadjusted p<0.05, ** indicates unadjusted p<0.01, and *** indicates unadjusted p<0.001.

References

    1. WHO Coronavirus (COVID-19) Dashboard (available at https://covid19.who.int).
    1. Coronavirus disease (COVID-19): Post COVID-19 condition (available at https://www.who.int/news-room/questions-and-answers/item/coronavirus-dis...).
    1. A. S. for P. Affairs (ASPA), About Long COVID (2023) (available at https://www.covid.gov/be-informed/longcovid/about).
    1. CDC, Healthcare WorkersCent. Dis. Control Prev. (2020) (available at https://www.cdc.gov/coronavirus/2019-ncov/hcp/clinical-care/post-covid-c...).
    1. Davis H. E., McCorkell L., Vogel J. M., Topol E. J., Long COVID: major findings, mechanisms and recommendations. Nat. Rev. Microbiol. 21, 133–146 (2023). - PMC - PubMed

Publication types

LinkOut - more resources