[Preprint]. 2024 Jun 17:2023.07.24.550437.
doi: 10.1101/2023.07.24.550437.

Development of a hepatic cryoinjury model to study liver regeneration

Affiliations

Development of a hepatic cryoinjury model to study liver regeneration

Marcos Sande-Melon et al. bioRxiv. .

Update in

Abstract

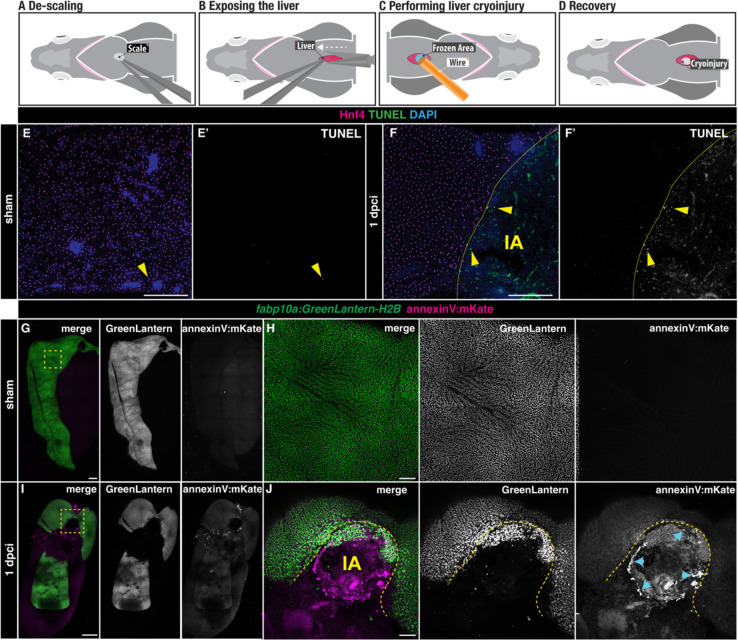
The liver is a remarkable organ that can regenerate in response to injury. Depending on the extent of injury, the liver can undergo compensatory hyperplasia or fibrosis. Despite decades of research, the molecular mechanisms underlying these processes are poorly understood. Here, we developed a new model to study liver regeneration based on cryoinjury. To visualise liver regeneration at cellular resolution, we adapted the CUBIC tissue-clearing approach. Hepatic cryoinjury induced a localised necrotic and apoptotic lesion characterised by inflammation and infiltration of innate immune cells. Following this initial phase, we observed fibrosis, which resolved as regeneration re-established homeostasis in 30 days. Importantly, this approach enables the comparison of healthy and injured parenchyma with an individual animal, providing unique advantages to previous models. In summary, the hepatic cryoinjury model provides a fast and reproducible method for studying the cellular and molecular pathways underpinning fibrosis and liver regeneration.

Keywords: Liver regeneration; apoptosis; cryoinjury; fibrosis; inflammation; necrosis; proliferation.


Figures

Figure 1.
Figure 1.. Liver cell death following cryoinjury.
A-D) A simplified schematic illustrating the cryoinjury procedure in the zebrafish liver. A) The zebrafish liver is placed ventral side up to facilitate the surgery. B) A small incision near the midline exposes the ventral liver lobe. C) The frozen cryoprobe is applied to the liver surface for 15 seconds to induce injury. D) The damaged area in the liver appears as a blister-like structure at 1 dpci. E-F) TUNEL-staining of sham (E-E’) and injured (F-F’) liver sections at 1 dpci. IA, injured area. Yellow arrowheads: TUNEL+ cells; yellow dashed lines: border zone. G-J) Tg(fabp10a: GreenLantern-H2B; annexinV:mKate) in toto acquisitions of sham (G-H) and 1 dpci (I-J) livers. I-J) The IA (yellow dashed line) is identifiable by the absence of GreenLantern-H2B+ hepatocytes. Blue arrowheads: AnnexinV-mKate+ cells. Scale bars: 500 μm
Figure 2.
Figure 2.. Progression of liver regeneration following cryoinjury.
A) A simplified schematic illustrating the collection of livers following cryoinjury. B-G) Whole mount images of cleared zebrafish livers at the indicated stages of regeneration. Yellow dashed lines: border zone. H) Quantification of the IA area compared to the visible liver parenchyma area (n= 16, 16, 14, 18, 7, and 12 bars indicate mean, p-values: one-way ANOVA followed by Tukey’s multiple comparisons test). Scale bars: 500 μm.
Figure 3.
Figure 3.. Transient fibrotic deposition during liver regeneration following cryoinjury.
A-H) AFOG staining in sections of representative sham-operated (A,G) or injured livers at the indicated stages (B-H). Blue: collagen; Red: cell debris and fibrin. Anterior is towards the left, dorsal is towards the top. Details are shown at higher magnifications. G’H’) Adjacent sections from the samples showed in G and H, immunostained with an anti-Col1a1 antibody and counterstained with DAPI. Asterisks: Col1a1 deposition in the liver parenchyma. I) Quantification of the collagen area of livers from the indicated cohorts, normalized to the liver parenchyma area (n = 6, 5, 6, 6, and 4; error bars representing SD; p-values: one-way ANOVA followed by Tukey’s multiple comparisons test). Bv: blood vessel; fc, fibrotic cap; IA: injured area; int: intestine; p: pancreas; vl: ventral lobe. Scale bars: 100 (white), 500 μm (orange and black).
Figure 4.
Figure 4.. Cryoinjury induces the local and transient infiltration of leukocytes.
A) Schematic representation of the experiment workflow. B-H) Sections of livers from Tg(fabp10a:NLS-mKate) animals at the indicated stages, immunostained to detect hepatocyte nuclei (mKate) and leukocytes (Lcp1) Cyan arrowheads: low signal Lcp1+cells; dashed yellow line: border zone; IA: injured area; yellow arrowheads: high signal Lcp1+ cells; Asterisks: spared hepatocytes surrounded by injured/necrotic tissue area. (I) Quantification of the number of Lcp1+ cells in designated regions (n = 6, 5, 6, 6, 5, 4, and 6; solid black line indicates the mean). p-values: one-way ANOVA followed by Tukey’s multiple comparisons test. Scale bars: 25 μm.
Figure 5.
Figure 5.. Local hepatocyte hyperplasia upon cryoinjury.
A) Schematic representation of the experiment workflow. B-H) Liver sections from Tg(fabp10a:NLS-mKate) animals at the indicated stages, immunostained to detect proliferation (PCNA) and hepatocyte nuclei (mKate). Yellow arrowheads: proliferating hepatocytes. Cyan arrowheads: other cell types actively cycling. Dashed yellow line: separation between healthy and injured liver parenchyma; IA, injured area; Asterisks: spared hepatocytes surrounded by injured/necrotic tissue area. I) Hepatocyte proliferation index in the border zone at the indicated stages (n = 6, 5, 6, 5, 5, 4, and 5; solid black line indicates the mean). p-values: one-way ANOVA followed by Tukey’s multiple comparisons test. Scale bars: 25 μm
Figure 6.
Figure 6.. Biliary Epithelial Cells (BECs) and endothelial cells (ECs) recover upon cryoinjury.
A-F) Whole mount imaging of GreenLantern+ hepatocytes and Anxa4+ biliary epithelial cells from sham (A) or injured (B-F) livers at the indicated stages. Details from boxed regions are shown magnified. G) Mean intensity profile of Anxa4 within the IA at the designated stages is represented by individual lines for each sample, with the IA delineated in grey (n= 4, 4, 4, 4). H-M) Whole mount acquisitions of GFP+ ECs from sham (H) or injured (I-M) livers at the indicated stages. Details from boxed regions are shown magnified acquisitions. N) Mean intensity profile of fli1a:nGFP within the IA at the designated stages is represented by individual lines for each sample, with the IA delineated in grey (n= 4, 4, 4, 4). Dashed line: border zone of the injured area, IA: injured area. Scale bars: 500 μm.
Figure 7.
Figure 7.. Transcriptional signatures of liver regeneration upon cryoinjury.
A) Schematic representation of the experiment workflow. B-D) Volcano plots representing the comparison of 1, 3 and 7 dpci with sham adult zebrafish. DEGs (FC ≥1.5 (darker dots) or ≤−1.5 (lighter dots;); P≤0.05; with top DEG annotated). E) Bar plot representing the number of upregulated and downregulated DEG at 1, 3, and 7 dpci. F) Venn diagram representing DEG at 1,3, and 7 dpci. G) GSEA of liver cell types during liver regeneration. H) Dotplot representing the expression of key genes for specific liver cell populations upon cryoinjury.
Figure 8.
Figure 8.. Model of liver regeneration upon cryoinjury.
Schematic representation of the cellular events upon cryoinjury during liver repair in the zebrafish

References

    1. Michalopoulos G. K. & Bhushan B. Liver regeneration: biological and pathological mechanisms and implications. Nat Rev Gastroenterol Hepatol 18, 40–55 (2021). - PubMed
    1. Pellicoro A., Ramachandran P., Iredale J. P. & Fallowfield J. A. Liver fibrosis and repair: immune regulation of wound healing in a solid organ. Nature Reviews Immunology 2014 14:3 14, 181–194 (2014). - PubMed
    1. González-Rosa J. M., Martín V., Peralta M., Torres M. & Mercader N. Extensive scar formation and regression during heart regeneration after cryoinjury in zebrafish. Development 138, 1663–1674 (2011). - PubMed
    1. Schnabel K., Wu C. C., Kurth T. & Weidinger G. Regeneration of cryoinjury induced necrotic heart lesions in zebrafish is associated with epicardial activation and cardiomyocyte proliferation. PLoS One 6, (2011). - PMC - PubMed
    1. Chablais F., Veit J., Rainer G. & Jawiska A. The zebrafish heart regenerates after cryoinjury-induced myocardial infarction. BMC Dev Biol 11, (2011). - PMC - PubMed

Publication types