[Preprint]. 2024 Jun 23:2024.06.20.599756.
doi: 10.1101/2024.06.20.599756.

Neocortical long-range inhibition promotes cortical synchrony and sleep

Affiliations

Neocortical long-range inhibition promotes cortical synchrony and sleep

Jacob M Ratliff et al. bioRxiv. .

Abstract

Behavioral states such as sleep and wake are highly correlated with specific patterns of rhythmic activity in the cortex. During low arousal states such as slow wave sleep, the cortex is synchronized and dominated by low frequency rhythms coordinated across multiple regions. Although recent evidence suggests that GABAergic inhibitory neurons are key players in cortical state modulation, the in vivo circuit mechanisms coordinating synchronized activity among local and distant neocortical networks are not well understood. Here, we show that somatostatin and chondrolectin co-expressing cells (Sst-Chodl cells), a sparse and unique class of neocortical inhibitory neurons, are selectively active during low arousal states and are largely silent during periods of high arousal. In contrast to other neocortical inhibitory neurons, we show these neurons have long-range axons that project across neocortical areas. Activation of Sst-Chodl cells is sufficient to promote synchronized cortical states characteristic of low arousal, with increased spike co-firing and low frequency brain rhythms, and to alter behavioral states by promoting sleep. Contrary to the prevailing belief that sleep is exclusively driven by subcortical mechanisms, our findings reveal that these long-range inhibitory neurons not only track changes in behavioral state but are sufficient to induce both sleep-like cortical states and sleep behavior, establishing a crucial circuit component in regulating behavioral states.


Conflict of interest statement

Competing interests. The authors declare no competing interests.

Figures
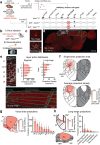
Figure 1 –
Figure 1 –. Sst-Chodl cells from primary visual cortex have long-range projections across the neocortex.
a) Experimental strategy for transcriptomic profiles and proportion of inhibitory neuron cell types labeled from single cell RNA sequencing from tdTomato reporter mice crossed with Nos1CreER or Sstflp; Chodlcre or Sstflp; Nos1creER mouse lines. Data from (Ben-Simon et al 2024). b) Experimental summary of an AAV-CreOn/FlpOn-oScarlet fluorophore injection into the visual cortex of Sstflp; Nos1CreER mice, arbor reconstruction, and atlas mapping. c) Example image of Sst-Chodl arbor with and without reconstruction (scale: 100µm). d) Thin section showing projections locally around injection site and long-range projections to frontal regions (scale: 1mm). e) Insets from d) showing (i) regional and (ii) long-range projections. Bar graphs provide quantifications of regional and interareal arbor density (scale: 100 and 200µm, respectively). f) Top: projection map from an example brain. Bottom: mean projection density across brain with inferred injection sites labelled (*). g) Schematic of visual areas showing quantification of projection density across subregions. h) Quantification of long-range projections outside of visual areas and neocortex. RL = rostrolateral visual area, V1 = primary visual area, AL = anterolateral visual area, PM = posteromedial visual area, L = lateral visual area, AM = anteromedial visual area, A = anterior area, LI = laterointermediate area, PL = posterolateral visual area, AuT = auditory/temporal cortex, RSP = retrosplenial cortex, SS = somatosensory, FrM = frontomotor cortex, CB = cerebellum, NC = Neocortex, OB = olfactory bulbs, BS = brainstem, HPF = hippocampal formation, Olf = olfactory areas, StP = Striatum/Pallidum. N = 6 mice. Data are means, bars indicate s.e.m.
Figure 2 –
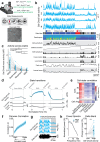
Figure 2 –. Imaging of Sst-Chodl cells shows high activity during sleep and quiet wake.
a) Schematic of GCaMP expression strategy, simultaneous imaging and state monitoring, and an example imaging field of view (FOV) with 4 Sst-Chodl cells (ROIs in blue; scale: 100 μm). b) Example data of 4 Sst-Chodl cells from a), sleep/wake states, and behavioral and physiological measures that are summarized as an arousal score. c) Mean activity of recorded cells across states. d) Mean Sst-Chodl cell activity, locomotion, and arousal level (note multiple scales) around state transitions. e) Correlation between cell activity and state measurements (i.e., delta power, pupil, etc). f) Mean pairwise correlation between cells based on arousal level. g) Example recordings during periods of high and low Sst-Chodl cell activity. h) Left: power spectra during periods of high and low Sst-Chodl cell activity. Right: quantification of delta band power change between these periods. (ANOVA p < 0.001, post-hoc multiple comparisons: SWS-QW p < 0.001, SWS-Move p < 0.001, SWS-REM p < 0.001, QW-Move p = 0.001, QW-REM p = 0.010, Move-Rem p = 0.990). N = 15 animals (11 Sstflp; Nos1creER mice and 4 Sstflp; Chodlcre mice), n = 97 cells (76 from Nos1creER cross, 21 from Chodlcre cross, 68 recorded across sleep and wake) and 42 pairs. ***: p < 0.001, **: p < 0.01, *: p < 0.05. Data are means; shading and bars indicate s.e.m.
Figure 3 –
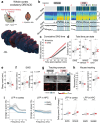
Figure 3 –. Optogenetic activation of Sst-Chodl cells induces local network synchronization.
a) Left: schematic of CreOn/FlpOn-ChR2-EYFP injections. Right: example ChR2 expression patterns (scale: 200µm). b) Schematic of linear silicon probe attached to a tapered optical fiber with example LFPs and units shown in their respective layer locations. c) Stimulation protocol schematic showing spontaneous and optogenetic stimulation (opto) blocks. Opto blocks include periods of stimulation and intertrial-intervals (ITIs). d) Left: Mean LFP power change across tissue depth. Center: change in delta power (1-4Hz) during slow wave sleep (SWS) across cortical layers. Right: delta band power change across SWS, quiet wake (QW) and movement (Move) (p = 0.003, 0.008, 0.069, resp., paired t-test). e) Normalized cross-correlograms (CCGs) between stimulated periods and ITIs. Left: mean CCG. Center: distribution of peak synchrony changes for each pair. Right: mean ± s.e.m. of pairwise synchrony changes (p < 0.001, paired t-test). f) Change in pairwise synchrony across SWS, QW, and Move (p < 0.001 for all, paired t-test). g) Spike-phase coherence across the LFP frequency spectrum during stimulation and spontaneous blocks. h) Distribution (left) and average (right) of unit-wise change in delta band phase locking with stimulation (p < 0.001, paired t-test). i) Example LFP data and single unit activity during UP and DOWN state transitions during spontaneous blocks. j) Average LFP time-locked to the peak of the DOWN state with (blue) and without (grey) optogenetic stimulation in example session. k) Change in amplitude and duration of DOWN state with optogenetic stimulation (p = 0.021 and p = 0.003, respectively, paired t-test). N = 8 sessions across 4 mice, N = 446 units and 39,804 pairs. ***: p < 0.001, **: p < 0.01, *: p < 0.05; ns, not significant. Data are means, shading and bars indicate s.e.m.
Figure 4 –
Figure 4 –. Chemogenetic activation of neocortical Sst-Chodl neurons promotes sleep.
a) Top: strategy for targeting the entire neocortex by injection of AAV-CreOn/FlpOn-hM3Dq mCherry at 22 injection sites. Bottom: example of a control brain injected with the AAV-EF1a-fDIO-mCherry vector. b) Example sessions for one mouse after systemic injection of Vehicle (left) or 0.5mg/kg CNO (right) with sleep/wake state scoring and physiological measurements. c) Cumulative SWS sleep time across sessions following Vehicle (grey) or CNO (red) injection. d) Total time spent in SWS, WAKE, and REM sleep for the 2 hours after injection (Vehicle, black; CNO, red; SWS, p = 0.002; WAKE, p = 0.002; REM p = 0.015, respectively). e) Latency to sleep onset (p = 0.009). f) SWS bout duration (p = 0.020) and numbers of SWS bouts (p = 0.059). g) Tracking example of the mouse in b) during the first 30 min following injections. Top bar: sleep/wake scoring according to the legend at the bottom of the panel. Center: images of mouse and nest (dashed white line) position in home cage. Bottom: heatmap of the animal position during the 30 min period. h) Total distance travelled (p = 0.031) and time in nest (p = 0.010) during the 2 hours post-injection. i) LFP power change from channels recorded in the neocortex (left) and in the hippocampus (HPC, right) during SWS (blue) or WAKE (grey) periods. j) Delta band (0.5-4Hz) power change during SWS sleep vs. wake from neocortical (SWS, p = 0.030; WAKE, p < 0.001) and hippocampal channels (SWS, p > 0.999; WAKE, p = 0.585). ***, p < 0.001; **, p < 0.01; *, p < 0.05; ns, not significant; paired t-test for D-F) and H) and two-way repeated ANOVA for J) with interaction p = 0.036; followed by Bonferroni post hoc comparisons. N = 28 sessions across 8 mice. Data are means, shading and bars indicate s.e.m.

References

    1. Anafi R. C., Kayser M. S. & Raizen D. M. Exploring phylogeny to find the function of sleep. Nat Rev Neurosci 20, 109–116 (2019). - PubMed
    1. Bryant P. A., Trinder J. & Curtis N. Sick and tired: Does sleep have a vital role in the immune system? Nat Rev Immunol 4, 457–67 (2004). - PubMed
    1. Rasch B. & Born J. About sleep’s role in memory. Physiol Rev 93, 681–766 (2013). - PMC - PubMed
    1. Rechtschaffen A., Gilliland M. A., Bergmann B. M. & Winter J. B. Physiological correlates of prolonged sleep deprivation in rats. Science 221, 182–4 (1983). - PubMed
    1. Iwanczuk W. & Guzniczak P. Neurophysiological foundations of sleep, arousal, awareness and consciousness phenomena. Part 2. Anaesthesiol Intensive Ther 47, 168–74 (2015). - PubMed

Publication types

LinkOut - more resources