[Preprint]. 2024 Jun 17:2024.06.17.599107.
doi: 10.1101/2024.06.17.599107.

TRIM7 ubiquitinates SARS-CoV-2 membrane protein to limit apoptosis and viral replication

Affiliations

TRIM7 ubiquitinates SARS-CoV-2 membrane protein to limit apoptosis and viral replication

Maria Gonzalez-Orozco et al. bioRxiv. .

Update in

  • TRIM7 ubiquitinates SARS-CoV-2 membrane protein to limit apoptosis and viral replication.
    Gonzalez-Orozco M, Tseng HC, Hage A, Xia H, Behera P, Afreen K, Peñaflor-Tellez Y, Giraldo MI, Huante M, Puebla-Clark L, van Tol S, Odle A, Crown M, Teruel N, Shelite TR, Moreno-Contreras J, Terasaki K, Makino S, Menachery V, Endsley M, Endsley JJ, Najmanovich RJ, Bashton M, Stephens R, Shi PY, Xie X, Freiberg AN, Rajsbaum R. Gonzalez-Orozco M, et al. Nat Commun. 2024 Nov 30;15(1):10438. doi: 10.1038/s41467-024-54762-5. Nat Commun. 2024. PMID: 39616206 Free PMC article.

Abstract

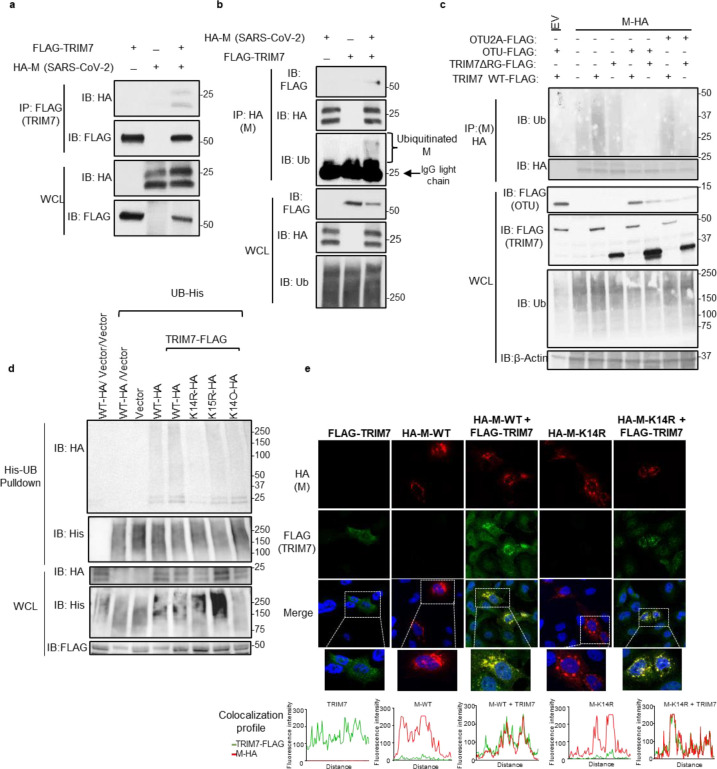
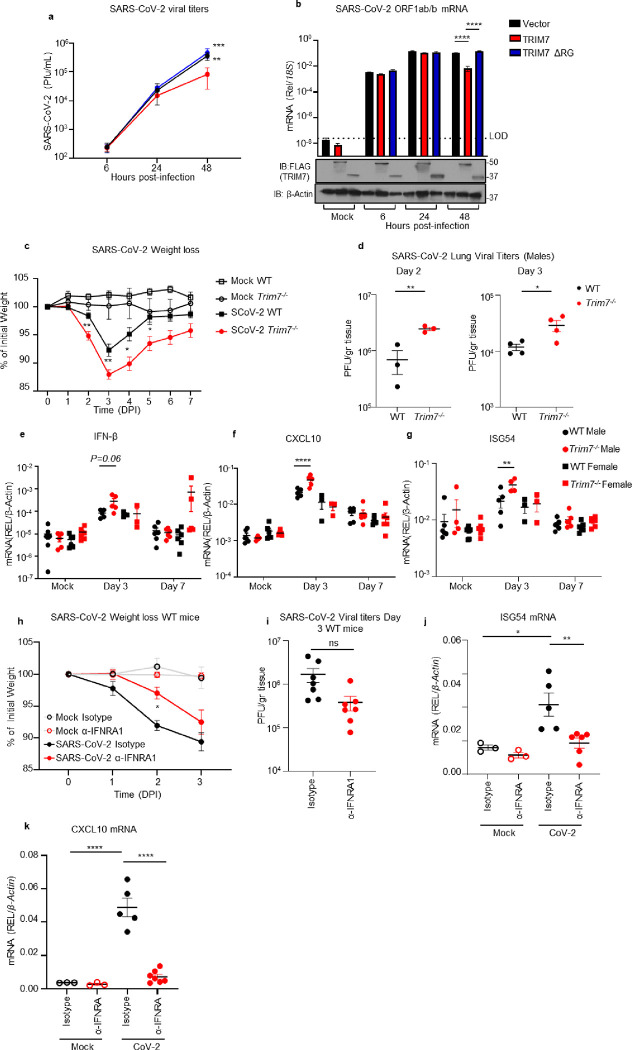
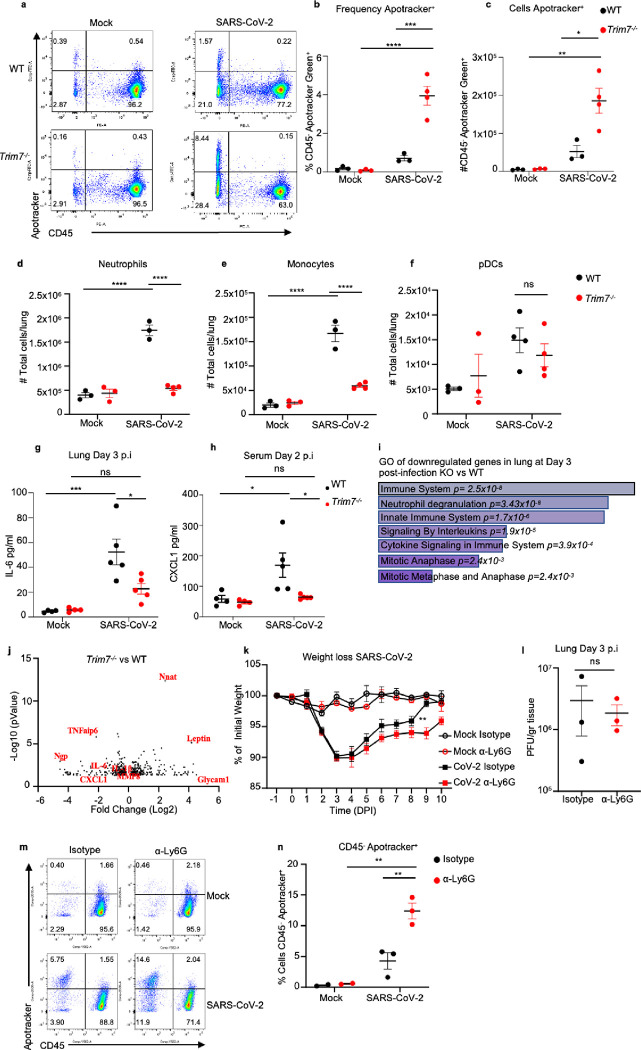
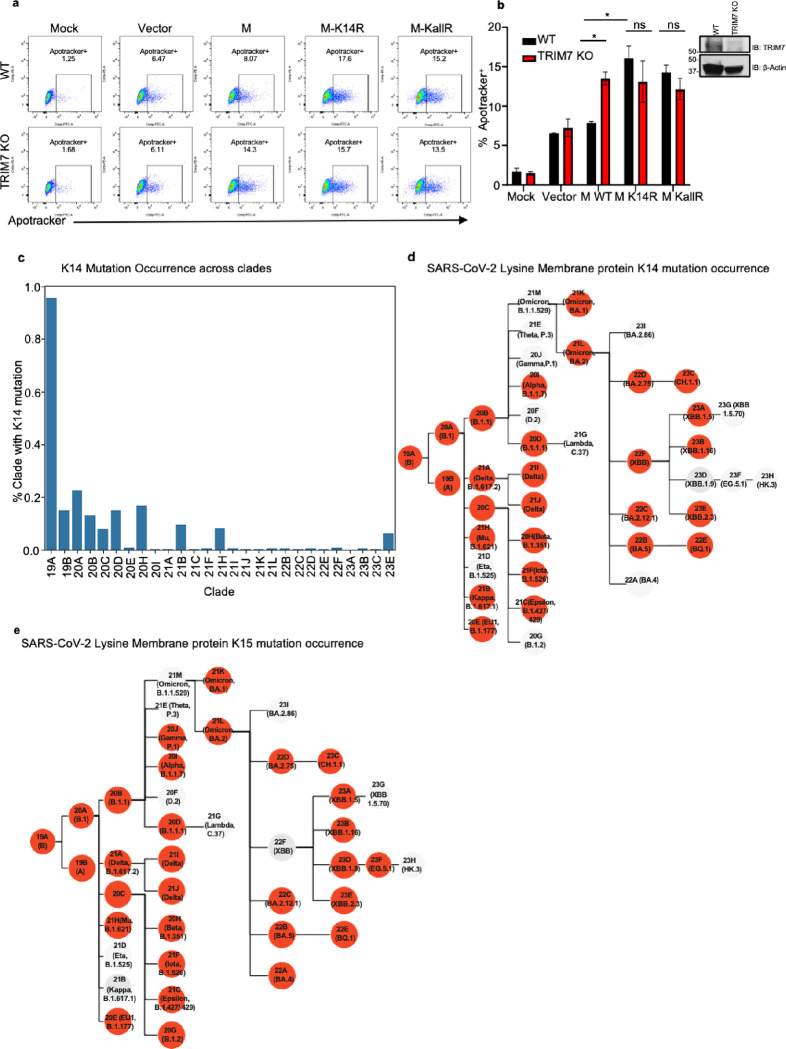
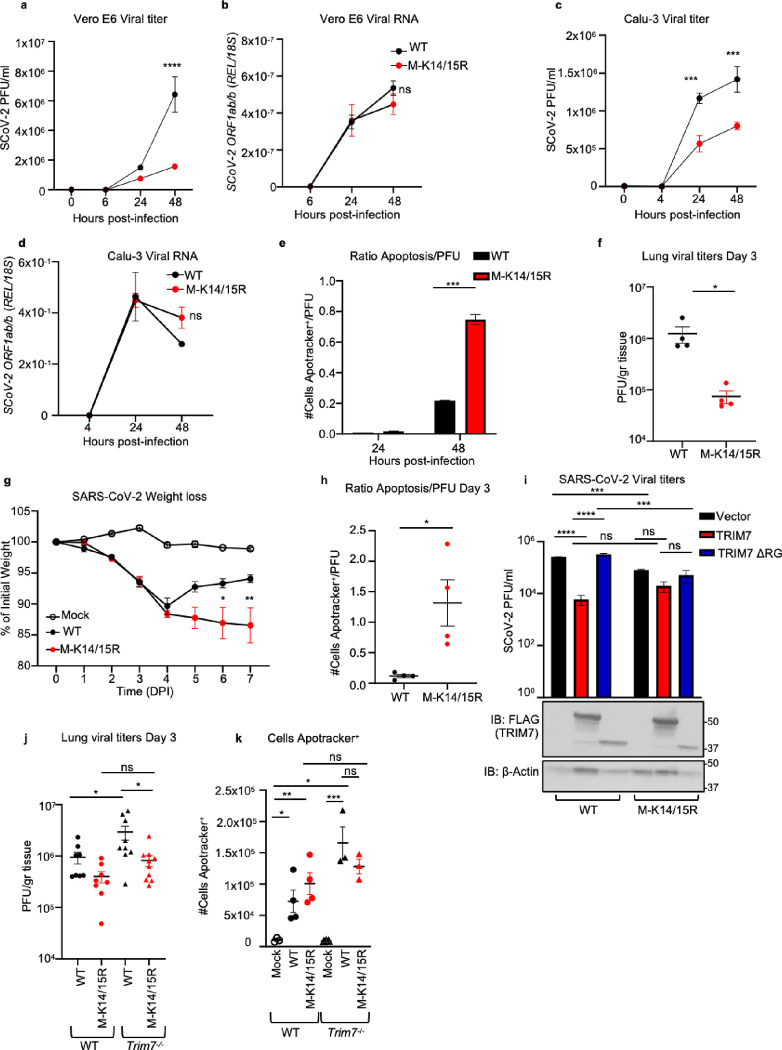
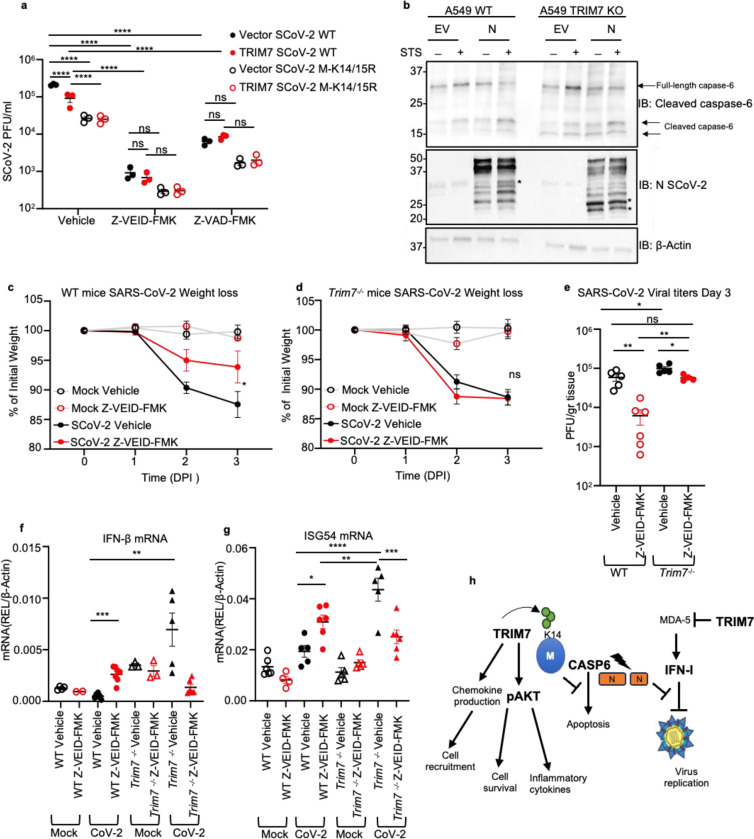
SARS-CoV-2 is a highly transmissible virus that causes COVID-19 disease. Mechanisms of viral pathogenesis include excessive inflammation and viral-induced cell death, resulting in tissue damage. We identified the host E3-ubiquitin ligase TRIM7 as an inhibitor of apoptosis and SARS-CoV-2 replication via ubiquitination of the viral membrane (M) protein. Trim7 -/- mice exhibited increased pathology and virus titers associated with epithelial apoptosis and dysregulated immune responses. Mechanistically, TRIM7 ubiquitinates M on K14, which protects cells from cell death. Longitudinal SARS-CoV-2 sequence analysis from infected patients revealed that mutations on M-K14 appeared in circulating variants during the pandemic. The relevance of these mutations was tested in a mouse model. A recombinant M-K14/K15R virus showed reduced viral replication, consistent with the role of K15 in virus assembly, and increased levels of apoptosis associated with the loss of ubiquitination on K14. TRIM7 antiviral activity requires caspase-6 inhibition, linking apoptosis with viral replication and pathology.

Keywords: Antiviral activity; Apoptosis; Caspase-6; E3-Ubiquitin ligases; Membrane protein; SARS-CoV-2; TRIM7; Ubiquitination.


Conflict of interest statement

Declaration of interest The authors declare no competing interests.

Figures

Figure 1.
Figure 1.. TRIM7 ubiquitinates SARS-CoV-2 Membrane protein.
a-b) HEK 293T cells were transfected with Vector, M-HA, +/− TRIM7 WT-FLAG, and immunoprecipitated using anti-FLAG beads (a) or anti-HA beads (b). c) HEK293T cells transfected with M-HA, TRIM7 WT-FLAG or TRIM7-ΔRING-FLAG +/− OTU-WT-FLAG or OTU-2A-FLAG followed by immunoprecipitation with anti-HA beads, d) denaturing pulldown using NiNTA beads. HEK293T cells transfected with His-Ub, M WT-HA, M-K14R, M-K15R, M-K14O (all Ks mutated to Rs except for K14), +/− TRIM7 WT-FLAG. e) Confocal microscopy of Hela cells transfected with TRIM7-FLAG (488), M WT-HA or M K14R-HA (555), for 24 hours. Colocalization profile graphs are shown.
Figure 2.
Figure 2.. TRIM7 has antiviral activity during SARS-CoV-2 infection.
a-b) HEK293T-hACE-2 cells were transfected with TRIM7 WT or TRIM7-ΔRING followed by infected with SARS-CoV-2 (MOI 0.1). Viral titers quantified by plaque assay (a) or viral RNA by qPCR (b). Bottom panel in b shows Immunoblot control for TRIM7 expression. c-g) C57BL/6NJ WT (n=18 9 females, 9 males) and Trim7−/− mice (n=23 10 females, 13 males) infected with maSARS-CoV-2 (1×10⁶ PFU). Weight loss (c), viral titers by plaque assay (d), gene expression in lung tissue by qPCR (e: IFN-β, f: CXCL10, g: ISG54). h-j) IFNAR1 blockade: C57BL/6J WT (n=7/group 5 females and 2 males) were treated with anti-IFNRA1 or isotype 24h before infection with maSARS-CoV-2 (1×10⁶ PFU). Weight loss (h), lung viral titers (i) and gene expression by qPCR of ISG54 (j) CXCL10 (k). Data are depicted as Mean + SEM. (a-b) are representative of 3 independent experiments in triplicates 2-way ANOVA Tukey’s multiple comparisons. (c) is combined data from 3 independent experiments 2-way ANOVA Tukey’s multiple comparisons. (d-g) representative data of 3 independent experiments (d) T-test. (e-g) 2-way ANOVA Tukey’s multiple comparisons. (h) representative data 2-way ANOVA Tukey’s multiple comparisons. (i) T-test analysis. (j-k) representative data one-way ANOVA Tukey’s multiple comparisons. p < 0.001 **, p < 0.0001 ***, p < 0.00001 ****.
Figure 3.
Figure 3.. Trim7 −/− mice have impaired innate immune response to SARS-CoV-2 infection.
Male C57BL/6NJ WT and Trim7−/− mice were infected with maSARS-CoV-2 (WT n=3, KO n=4). At day 3 post-infection lung cells were stained for CD45 and Apotracker Green and a representative FACS dot plot shown in (a), frequency of CD45-Apotracker Green+ cells (b), or total number of cells per lung (c), total number of neutrophils CD45+CD11cCD11b+Ly6CintLy6Ghi (d), monocytes CD45+CD11cCD11b+Ly6ChiLy6G (e), pDCs CD45+CD11cloPDCA-1+CD11b (f). 23-Bioplex analysis from lung (g) or serum (h). IL-6 and CXCL1 are shown. i) Gene ontology graph of genes downregulated in the lung of Trim7−/− mice at day 3 post-infection. j) Volcano plot of genes changing in lung in WT and Trim7−/− mice at day 3 post-infection. k) Weight loss graph of WT mice depleted of neutrophils using anti Ly6G antibody or isotype as control infected with maSARS-CoV-2 (n=8). l) viral titers in the lung of mice infected as (k) (n=3), (m) representative dot blot of lung cells stained using CD45 and Apotracker Green, (n) Frequency of cells CD45- Apotracker Green+. Data are depicted as Mean ± SEM. (b-h) and (k), representative data of at least 2 independent experiments 2-way ANOVA Tukey’s multiple comparisons. (l), T-test analysis. (n), 2-way ANOVA Tukey’s multiple comparisons. p < 0.001 **, p < 0.0001 ***, p < 0.00001 ****.
Figure 4.
Figure 4.. Mutations on M lysine 14 induce apoptosis and are present in circulating stains of SARS-CoV-2.
a-b) A549 WT or TRIM7 KO transfected with M-WT, M-K14R, or M-KallR mutants for 24h and then stained with Apotracker Green, representative dot blot (a), frequency of cells Apotracker+ (b). c-d) M lysine mutations in SARS-CoV-2 sequences. c) percentage of occurrence of M-K14 mutation across the clades. d) membrane protein K14 mutation occurrence. e) membrane protein K15 mutation occurrence. Red highlighted nodes indicate at least one mutation occurrence in the specific clade. Data are depicted as Mean ± SEM. b, representative data of 2 independent experiments in duplicates 2-way ANOVA Tukey’s multiple comparisons test. p < 0.001 **, p < 0.0001 ***, p < 0.00001 ****.
Figure 5.
Figure 5.. Recombinant virus with M K14/K15 mutations shows increased pathogenesis.
Vero E6 or Calu-3 infected with SARS-Cov-2 WT or M-K14/15R MOI 0.1 and 1 respectively. a) viral titers and b) viral RNA in Vero E6. c) viral titers and d, viral RNA in Calu-3. e) ratio of cells in apoptosis Apotracker+ normalized by viral titers (Apotracker+/PFU) in Calu-3 cells. WT C57BL/6J male mice infected with SARS-CoV-2 WT (n=8) or M-K14/15R mutant viruses (n=10) and mock (n=5). At day 3 post-infection 4 mice were euthanized and lung collected for plaque assay and flow cytometry. f) viral titers in lung. g) weight loss curve. h) ratio of cells in apoptosis in lung (Apotracker+/PFU). i) viral titers of HEK 293T-hACE-2 cells transfected with TRIM7 WT or TRIM7ΔRING and infected with SARS-CoV-2 WT or MK14/15R at MOI 0.1 (bottom panel western blot analysis of overexpression of TRIM7). WT (n=8, 6 males, 2 females) and Trim7−/− (n=9 and 11, 7 or 9 males and 2 females) mice infected intranasal with SARS-CoV-2 WT or M-K14/15R and euthanized at day 3 post-infection. j) lung viral titers. k) total number of cells in apoptosis (CD45 +Apotracker+). Data are depicted as Mean ± SEM. a-e) are representative of 3 independent experiments in triplicate 2-way ANOVA Tukey’s multiple comparisons. f-h) is presentative data of at least 2 independent experiments. f) and h) t-test analysis. g) 2-way ANOVA Tukey’s multiple comparisons. i) is presentative data of at least 3 independent experiments in triplicates, 2-way ANOVA Tukey’s multiple comparisons. j) is combined data of 2 independent experiments, k) is representative data of 1 of the 2 independent experiments of j) one-way ANOVA Tukey’s multiple comparisons. p < 0.001 **, p < 0.0001 ***, p < 0.00001 ****.
Figure 6.
Figure 6.. TRIM7 mediates its antiviral effects by inhibiting caspase-6 activation.
a) viral titers of HEK 293T-hACE-2 cells overexpressing TRIM7 WT and infected with SARS-CoV-2 WT or M-K14/15R at MOI 0.1 and treated with vehicle (DMSO) or 50μM of Z-VEID-FMK 24h post-infection. b) western blot analysis of A549 WT and TRIM7KO cells transfected with SARS-CoV-2 N protein or empty vector and treated with Staurosporine (STS) *indicates cleaved form of N. c) weight loss of WT female mice infected intranasal with SARS-CoV-2 WT treated intraperitoneal with caspase-6 inhibitor or vehicle and lung collected at day 3 post-infection. mocks (n=6 each) vehicle (n=5) or Z-VEID-FMK (n=6) d) weight loss Trim7−/− female mice as in (c) vehicle mocks (n=5 each) infected vehicle (n=4) or Z-VEID-FMK (n=6). e) lung viral titers. f) IFN-β mRNA and (g) ISG54mRNA expression levels in lung. h) scheme of the multiple functions of TRIM7 during SARS-CoV-2 infection. Data are depicted as Mean ± SEM. a) is presentative data of at least 2 independent experiments in triplicates, 2-way ANOVA Tukey’s multiple comparisons. c-d) are representative data of 2 independent experiments 2-way ANOVA Tukey’s multiple comparisons and e-f) one-way ANOVA Tukey’s multiple comparisons. p < 0.001 **, p < 0.0001 ***, p < 0.00001 ****.

References

    1. Lamers M. M. & Haagmans B. L. SARS-CoV-2 pathogenesis. Nat Rev Microbiol 20, 270–284 (2022). 10.1038/s41579-022-00713-0 - DOI - PubMed
    1. Martines R. B. et al. Pathology and Pathogenesis of SARS-CoV-2 Associated with Fatal Coronavirus Disease, United States. Emerg Infect Dis 26, 2005–2015 (2020). 10.3201/eid2609.202095 - DOI - PMC - PubMed
    1. Yan W., Zheng Y., Zeng X., He B. & Cheng W. Structural biology of SARS-CoV-2: open the door for novel therapies. Signal Transduct Target Ther 7, 26 (2022). 10.1038/s41392-022-00884-5 - DOI - PMC - PubMed
    1. Zhang Z. et al. Structure of SARS-CoV-2 membrane protein essential for virus assembly. Nat Commun 13, 4399 (2022). 10.1038/s41467-022-32019-3 - DOI - PMC - PubMed
    1. Hou Y. J. et al. SARS-CoV-2 Reverse Genetics Reveals a Variable Infection Gradient in the Respiratory Tract. Cell 182, 429–446 e414 (2020). 10.1016/j.cell.2020.05.042 - DOI - PMC - PubMed

Publication types