[Preprint]. 2024 Jun 19:2024.06.17.599171.
doi: 10.1101/2024.06.17.599171.

Hierarchical global and local auxin signals coordinate cellular interdigitation in Arabidopsis

Affiliations

Hierarchical global and local auxin signals coordinate cellular interdigitation in Arabidopsis

Patricio Pérez-Henríquez et al. bioRxiv. .

Abstract

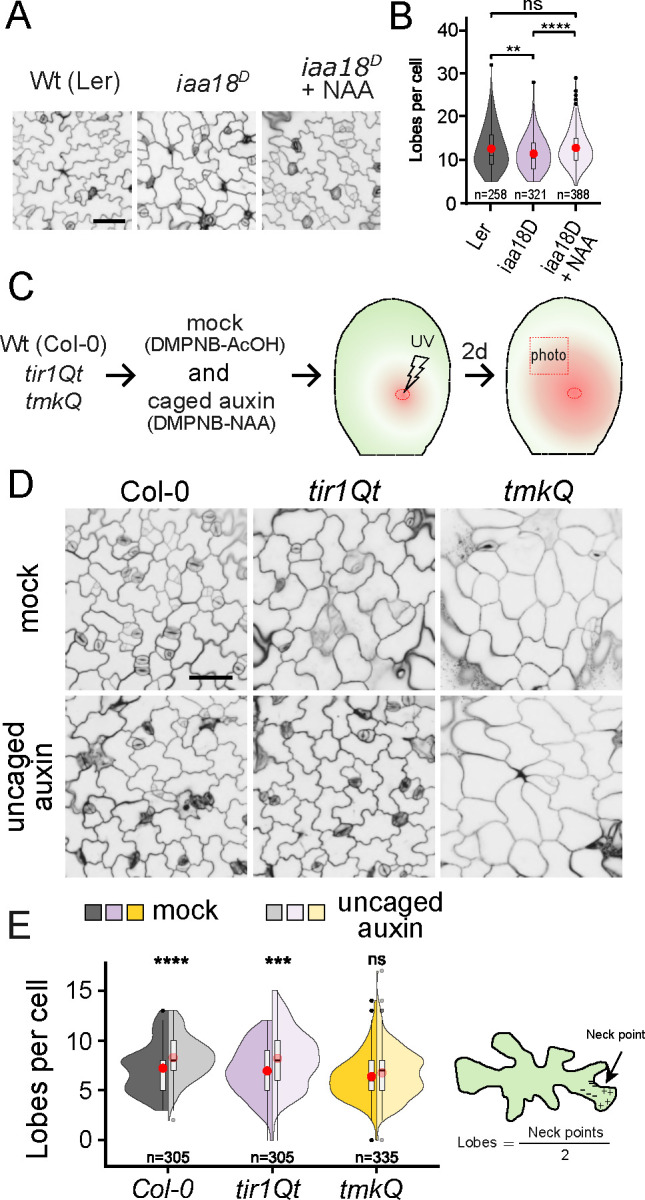
The development of multicellular tissues requires both local and global coordination of cell polarization, however, the mechanisms underlying their interplay are poorly understood. In Arabidopsis, leaf epidermal pavement cells (PC) develop a puzzle-piece shape locally coordinated through apoplastic auxin signaling. Here we show auxin also globally coordinates interdigitation by activating the TIR1/AFB-dependent nuclear signaling pathway. This pathway promotes a transient maximum of auxin at the cotyledon tip, which then moves across the leaf activating local PC polarization, as demonstrated by locally uncaged auxin globally rescuing defects in tir1;afb1;afb2;afb4;afb5 mutant but not in tmk1;tmk2;tmk3;tmk4 mutants. Our findings show that hierarchically integrated global and local auxin signaling systems, which respectively depend on TIR1/AFB-dependent gene transcription in the nucleus and TMK-mediated rapid activation of ROP GTPases at the cell surface, control PC interdigitation patterns in Arabidopsis cotyledons, revealing a mechanism for coordinating a local cellular process with the development of whole tissues.

Keywords: Cell polarity; TIR1/AFBs; TMK; auxin transport; global coordination; local coordination; pavement cell morphogenesis.


Figures

Figure 1.
Figure 1.. The progressive activation of pavement cell (PC) interdigitation follows a similar pattern of increase in auxin levels that begins at the tip of young Arabidopsis cotyledons.
(A) Schematic of PC metrics quantification for margin roughness (MR) and lobe count (Lobes). (B) Heatmap of MR shows that PC interdigitation first occurs in the tip and progressively spreads to the middle and basal regions of expanding cotyledons. At the indicated hours after plating (HAP), wild-type (Col-0) cotyledon PCs were imaged using laser scanning confocal microscopy, and the degree of MR was computed per cell and color-coded as shown in the color scale. Scale bars = 50 μm. Yellow dashed lines separate the top and bottom half of the early expanding cotyledons. (C) Quantification of MR of pavement cells at the cotyledon’s base and tip, defined as the top and bottom half of early expanding cotyledons, analyzed with the software PaCeQuant . Cell borders were obtained by staining with propidium iodide. Cotyledons were dissected before imaging: swollen seed (0 HAP), ruptured seed testa (24 HAP), emerged radicle (36 HAP), greening cotyledons (48 HAP), green opening cotyledons (60 HAP) and green open flat globular cotyledons (72 HAP). Box plot inside each violin plot depicts four quartiles and the median. Red dot depicts the average. n=231–368 cells, t-test ***p<0.001. (D) GUS histochemical assay in the cotyledons of a DR5::GUS line suggests an apparent tip-high auxin maximum at 24 HAP, a clear apical margin-high maximum at 36 HAP, and a conspicuous tip-high maximum at 48 and 60 HAP. Scale bar = 150 μm. (E) This is confirmed by GUS activity quantification in cotyledons at the same developmental time points shown in D by fluorometric detection of 4-methylumbelliforone (4-MU), n=24 cotyledons, t-test, *p<0.05, **p<0.01, ****p<0.0001. Note that GUS activity at 24 HAP was significantly higher than at 0 HAP. (F) Representative images from a time-lapse of cotyledons in plants expressing DII-Venus (upper row) or mDII-Venus (lower row, a mutation in DII that makes it insensitive to auxin). (G) Quantitative analysis of Venus signal intensity in cells on the tip, middle, and base of cotyledons, defined as shown by the dashed boxes in F, 18 HAP. In DII-Venus (DII) cotyledons, tip cells (black) show a reduction in signal intensity as early as 22 HAP. Reduction of signal intensity was then observed in cells in the middle (gray) and, finally, in the base (white). In contrast, signal intensity was unchanged in mDII-Venus (mDII) cotyledon for all regions. Plot shows mean + standard error. n=20–22 cotyledons, each from different seedlings from 3 experimental replicates.
Figure 2.
Figure 2.. Ectopic local auxin maximum globally activates PC interdigitation.
(A) Auxin uncaging reaction. UV light breaks caged DMPNB-NAA/IAA into uncaged active auxin and the cage, see also Figure S2C. UV treatment of DMPNB-AcOH (mock) allows the release of acetic acid to emulate auxin acidity without auxin response. (B) Schematic representation of auxin uncaging experiment testing the efficacy of uncaging in the UV-treated area and the adjacent, and more distal areas. (C) Efficacy of auxin uncaging by quantification of the auxin reporter R2D2 fluorescence after UV irradiation as shown in B. Nuclear signal intensity in channels for DII-Venus and mDII-ntTomato was measured from cotyledon areas UV-treated (UV) and non-UV-treated (adjacent and distal). n = 28 cells per zone from 4 cotyledons. Representative results from 4 experimental replicates. Plot shows mean (dots) + SEM (dashed lines). (D) Schematic representation of auxin uncaging experiment to investigate the induction of pavement cell interdigitation by uncaged auxin in the region outside of the uncaging site (red square box). UV light indicates the site of uncaging (red oval). This experiment was conducted in 3.5-day-old seedlings overexpressing ARR20-OX to suppress the production of endogenous auxin. (E) Pavement cell phenotypes outside of the UV-treated area, as indicated by a red square box in D, were imaged. Scale bar = 50 μm. (F) Quantitative analysis of pavement cell phenotype shown in E. Violin plot of lobe number per cell (Left) and margin roughness (Right). Box plot inside each violin plot depicts four quartiles and the median. Red dot depicts the mean value. Raw images were auto segmented and analyzed with PaCeQuant. Eight different cotyledons, each from different seedlings, were analyzed in each treatment. n = 157 cells in mock, n = 187 cells in auxin uncaged. Similar results were obtained in 3 experimental replicates. t-test, ****p<0.0001.
Figure 3.
Figure 3.. Auxin-induced PC interdigitation in the absence of TIR1/AFBs-based auxin signaling.
(A) Exogenous auxin rescues PC interdigitation defects in tir1Qt but not in tmkQ. Shown are representative images of pavement cells from Col-0, tir1Qt, and tmkQ seedlings cultured in liquid media with either 0.01% DMSO (mock) or 20 nM auxin NAA (auxin) for 5 days after planting seeds. Scale bar = 50 μm. (B) Quantification of lobe number per cell from images in A. Split violins for each genotype show values obtained from mock (opaque) and NAA-treated (translucent) cotyledons. Box plot inside each violin plot depicts four quartiles and the median. Red dot depicts the average. n is indicated below each plot, with data from at least 8 different cotyledons, each from a different seedling. Similar results were obtained in 5 independent experiments. t-test, ns = non-significance, ****p<0.0001. (C) Single-cell tracking experiment showing exogenous auxin-induced lobing in tir1Qt seedlings treated with Auxinole. Cotyledons from 3-day-old tir1Qt seedlings with existing lobes (blue arrowheads) were treated with 20 μM for 0.5 h before being transferred to a new liquid medium with either 20 μM Auxinole or 20 μM Auxinole +100 nM auxin NAA. The same cells were imaged at the time of mock or NAA treatment and 2.5 days later. Auxin-induced new lobes are indicated with orange arrowheads. (D) Quantitative analysis of PC interdigitation for the single cell tracking experiment described in D. Shown is lobe number per cell before (3 days after plating (DAP), light gray) and after treatment (+2.5 days, dark gray). t-test, *p<0.05, ****p<0.0001. (E) Schematic view of the hierarchical auxin system where TIR1/AFBs-dependent auxin synthesis acts as the source for the auxin perceived by TMK-dependent cell-surface auxin signaling.
Figure 4.
Figure 4.. Local auxin uncaging globally rescues defects in pavement cell interdigitation resulting from disruption of the TIR1/AFB signaling pathway.
(A) Exogenous auxin treatments restore defects in PC interdigitation observed in iaa18D. The gain-of-function mutant iaa18D results from a point mutation in domain II of AUX/IAA protein causing their stabilization and inhibition of auxin transcriptional responses. Seedlings were grown in the absence or presence of 20 nM NAA for 4 days. Scale bars = 50 μm. (B) Quantitative analysis of the PC interdigitation phenotype in iaa18D mutant as shown in panel B. Statistical analysis showed that the mean lobe number per cell in wild-type cotyledon PCs was significantly greater than in iaa18D PCs (purple opaque) but not different from iaa18D PCs treated with NAA (purple translucid). n=250–388 cells from 8 different cotyledons, each from different seedlings. Results representative from 4 experimental replicates. (C) Schematics of the local auxin uncaging protocol. 3.5-days-old seedlings were soaked in either caged-mock (100 μM DMPNB-AcOH) or caged auxin (100 μM DMPNB-NAA) for 5 h. Then, seedlings were UV-treated for 30 sec (25% laser, 60 mW) and placed back in semi-solid medium to grow for 2 days. Cotyledons were then excised and stained to analyze cell shape outside of the UV-treated area. (D) Local auxin uncaging globally induced lobing in tir1Qt but not in tmkQ mutants. Representative images from seedlings treated as shown in C. Scale bar = 50 μm. (E) Quantitative analysis of PC interdigitation as shown in D. Lobe number per cell is shown. For each genotype, split violins show the mock (opaque) and NAA treatment (translucent) values. Box plot inside each violin plot depicts four quartiles and the median. Red dot depicts the average. n = 305–335 cells from 8 different cotyledons, each from different seedlings. Similar results were obtained in 5 independent experiments. t-test, ***p<0.001, ****p<0.001.
Figure 5.
Figure 5.. The TIR1/AFB-based nuclear pathway is required for the expression of the IBR auxin-biosynthetic genes that contribute to auxin maxima at the tip of cotyledons.
(A) Induction of ECH2 and IBR10 gene expression by auxin was compromised in tir1Qt. Auxin treatment and qRT-PCR analysis of ECH2 and IBR10 expression in wild type Col-0 and tir1Qt III as described in Methods. The graph informs 3 biological replicates, each reaction is performed with 3 technical replicates. t-test, *p<0.05. (B) Tip-high DR5::GUS expression in 48 HAP cotyledons was greatly reduced in the ech2−/−;ibr10−/− double mutant. (C) Auxin restored the PC interdigitation defect in the ech2−/−;ibr10−/− mutant. Seedlings were grown for 4 days in 20 nM NAA. Scale bar = 50 μm. (D) Lobes per cell of cotyledons shown in C. Split violins show mock (opaque) and NAA treatment (translucent) values, for each genotype. Box plot inside each violin plot depicts four quartiles and the median. Red dot depicts the average. Split violins for each genotype show values obtained from mock (opaque) and NAA-treated (translucent) cotyledons. n = 298–569 cells from 10 cotyledons. t-test, ****p<0.0001.
Figure 6.
Figure 6.. Auxin-induced PC interdigitation is decoupled from cell expansion-induced mechanical stress
(A) PC interdigitation does not correlate with mechanical stress or cell size in early-developing cotyledons. Shown are correlation plots between margin roughness (MR) and the largest empty circle (LEC, upper graph), which is indicative of the mechanical stress 7 and between MR and cell size/area (lower panel) at 0 HAP, 24 HAP and 48 HAP and at different positions (tip, base, middle) in the cotyledon. Green line is the linear model. Gray shadows display the 95% confidence interval. R2 = correlation coefficient. (B) Cell expansion without PC interdigitation. 24 HAP wild-type seedlings were either mock-treated or treated with 1 μM auxin NAA or 1 μM brassinolide for 4 days. Then, cotyledons were stained and imaged by confocal microscopy for posterior analysis with PaCeQuant. Growth for 1 day before treatment is crucial to avoid auxin-induced inhibition of germination. (C) Violin plot of cell size (left) and margin roughness (right) computed from images as shown in B. n > 51–109 cells from 9 cotyledons. Box plot inside each violin plot depicts four quartiles and the median. Red dot depicts the mean value. Wilcox test, *p<0.05, ****p<0.0001. (D) Auxin-induced de novo lobe formation without increasing cell size in single cell tracking experiments. Cotyledons (3 DAP) with formed lobes (blue arrowheads) were mock-treated (diluted DMSO) or treated with 20 nM auxin NAA for 2.5 days and analyzed as described in Figure 3C. (E) Percentage variation (Δ) in cell size (top) and margin roughness (bottom) calculated with pre/post treatment pairwise images. n = 15 cells, from 5 cotyledons each from different seedlings. Same results were obtained in 3 independent experiments. t-test, ** p<0.01, ns = non-significance. (F) A model for a hierarchical global and local auxin signaling systems underlying the PC interdigitation pattern. A basal level of auxin, which self-amplifies via TIR1/AFB1-dependent auxin signaling to activate IBR-dependent auxin synthesis genes (purple dots). This is counteracted by cytokinin signaling, restricting auxin maxima (increased red color) to the tip of cotyledons. The auxin maxima act as a global signal by emanating to the remaining regions of the cotyledon epidermis (wavy black arrow) presumably via diffusion through the apoplastic space, which locally increases the level of auxin for a specific cell. The resultant local auxin (red dots) then triggers TMK/ROP-dependent cell polarization and cell-cell coordination by activating the feedback loop and the complementary ROP2/ROP6 pathways to coordinate lobe and indentation formation ,,,.

References

    1. Aw W.Y., and Devenport D. (2017). Planar cell polarity: global inputs establishing cellular asymmetry. Curr. Opin. Cell Biol. 10.1016/j.ceb.2016.08.002. - DOI - PMC - PubMed
    1. Torban E., and Sokol S.Y. (2021). Planar cell polarity pathway in kidney development, function and disease. Nat. Rev. Nephrol. 17, 369–385. 10.1038/s41581-021-00395-6. - DOI - PMC - PubMed
    1. Butler M.T., and Wallingford J.B. (2017). Planar cell polarity in development and disease. Nat. Rev. Mol. Cell Biol. 18, 375–388. 10.1038/nrm.2017.11. - DOI - PMC - PubMed
    1. Angers S., and Moon R.T. (2009). Proximal events in Wnt signal transduction. Nat. Rev. Mol. Cell Biol. 10, 468–477. 10.1038/nrm2717. - DOI - PubMed
    1. Friml J. (2022). Fourteen stations of auxin. Cold Spring Harb. Perspect. Biol. 14. 10.1101/cshperspect.a039859. - DOI - PMC - PubMed

Publication types

LinkOut - more resources