

This is a preprint.
Heterogeneity of morphometric similarity networks in health and schizophrenia
- PMID: 38948832
- PMCID: PMC11212887
- DOI: 10.1101/2024.03.26.586768
Heterogeneity of morphometric similarity networks in health and schizophrenia
Update in
-
Heterogeneity of morphometric similarity networks in health and schizophrenia.Schizophrenia (Heidelb). 2025 Apr 24;11(1):70. doi: 10.1038/s41537-025-00612-2. Schizophrenia (Heidelb). 2025. PMID: 40274815 Free PMC article.
Abstract
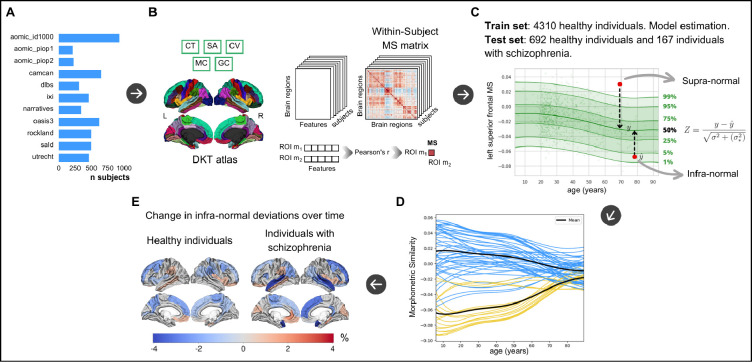
Introduction: Morphometric similarity is a recently developed neuroimaging phenotype of inter-regional connectivity by quantifying the similarity of a region to other regions based on multiple MRI parameters. Altered average morphometric similarity has been reported in psychotic disorders at the group level, with considerable heterogeneity across individuals. We used normative modeling to address cross-sectional and longitudinal inter-individual heterogeneity of morphometric similarity in health and schizophrenia.
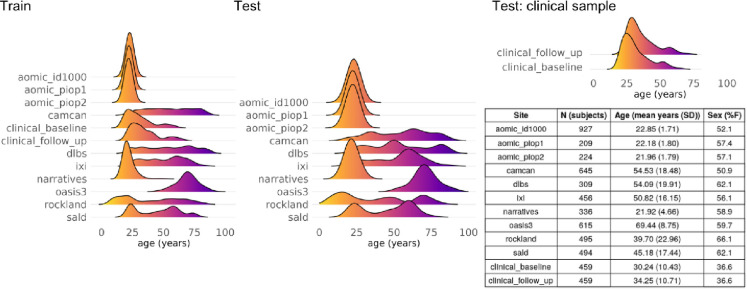
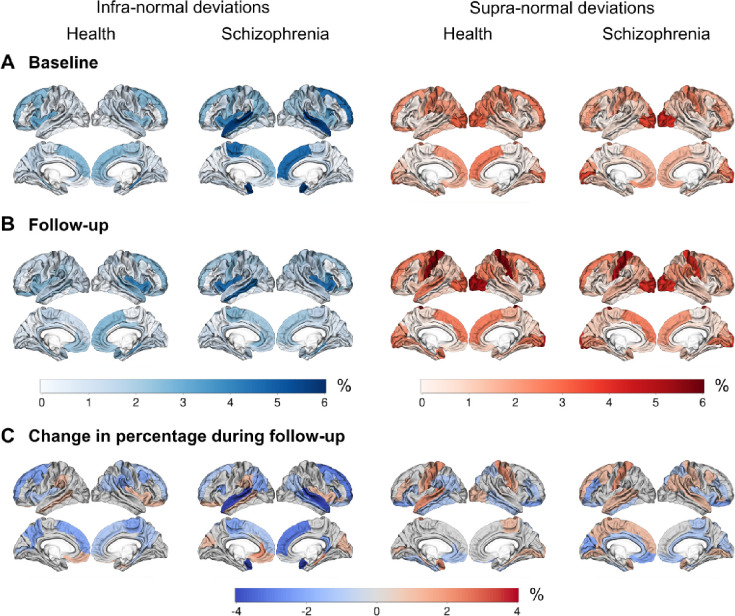
Methods: Morphometric similarity for 62 cortical regions was obtained from baseline and follow-up T1-weighted scans of healthy individuals and patients with chronic schizophrenia. Cortical regions were classified into seven predefined brain functional networks. Using Bayesian Linear Regression and taking into account age, sex, image quality and scanner, we trained and validated normative models in healthy controls from eleven datasets (n = 4310). Individual deviations from the norm (z-scores) in morphometric similarity were computed for each participant for each network and region at both timepoints. A z-score ≧ than 1.96 was considered supra-normal and a z-score ≦ -1.96 infra-normal. As a longitudinal metric, we calculated the change over time of the total number of infra- or supra-normal regions per participant.
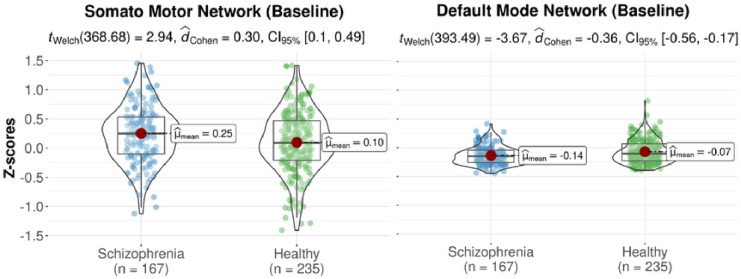
Results: At baseline, patients with schizophrenia had decreased morphometric similarity of the default mode network and increased morphometric similarity of the somatomotor network when compared with healthy controls. The percentage of patients with infra- or supra-normal values for any region at baseline and follow-up was low (<6%) and did not differ from healthy controls. Mean intra-group changes over time in the total number of infra- or supra-normal regions were small in schizophrenia and healthy control groups (<1) and there were no significant between-group differences.
Conclusions: In a case-control setting, a decrease of morphometric similarity within the default mode network may be a robust finding implicated in schizophrenia. However, normative modeling suggests that significant reductions and changes over time of regional morphometric similarity are evident only in a minority of patients.
Conflict of interest statement
Disclosures Dr. Díaz-Caneja has received honoraria from Angelini and Viatris. Dr. Arango has been a consultant to or has received honoraria or grants from Acadia, Angelini, Gedeon Richter, Janssen-Cilag, Lundbeck, Otsuka, Roche, Sage, Servier, Shire, Schering-Plough, Sumitomo Dainippon Pharma, Sunovion, and Takeda. Dr. Cahn has received unrestricted research grants from or served as an independent symposium speaker or consultant for Eli Lilly, Bristol-Myers Squibb, Lundbeck, Sanofi-Aventis, Janssen-Cilag, AstraZeneca, and Schering-Plough. The other authors report no financial relationships with commercial interests.
Figures
Similar articles
-
Prescription of Controlled Substances: Benefits and Risks.2025 Jul 6. In: StatPearls [Internet]. Treasure Island (FL): StatPearls Publishing; 2025 Jan–. 2025 Jul 6. In: StatPearls [Internet]. Treasure Island (FL): StatPearls Publishing; 2025 Jan–. PMID: 30726003 Free Books & Documents.
-
Sertindole for schizophrenia.Cochrane Database Syst Rev. 2005 Jul 20;2005(3):CD001715. doi: 10.1002/14651858.CD001715.pub2. Cochrane Database Syst Rev. 2005. PMID: 16034864 Free PMC article.
-
Falls prevention interventions for community-dwelling older adults: systematic review and meta-analysis of benefits, harms, and patient values and preferences.Syst Rev. 2024 Nov 26;13(1):289. doi: 10.1186/s13643-024-02681-3. Syst Rev. 2024. PMID: 39593159 Free PMC article.
-
The effect of sample site and collection procedure on identification of SARS-CoV-2 infection.Cochrane Database Syst Rev. 2024 Dec 16;12(12):CD014780. doi: 10.1002/14651858.CD014780. Cochrane Database Syst Rev. 2024. PMID: 39679851 Free PMC article.
-
Nutritional interventions for survivors of childhood cancer.Cochrane Database Syst Rev. 2016 Aug 22;2016(8):CD009678. doi: 10.1002/14651858.CD009678.pub2. Cochrane Database Syst Rev. 2016. PMID: 27545902 Free PMC article.
References
-
- Alnæs D, Kaufmann T, van der Meer D, Córdova-Palomera A, Rokicki J, Moberget T, Bettella F, Agartz I, Barch DM, Bertolino A, Brandt CL, Cervenka S, Djurovic S, Doan NT, Eisenacher S, Fatouros-Bergman H, Flyckt L, Di Giorgio A, Haatveit B, Jönsson EG, Kirsch P, Lund MJ, Meyer-Lindenberg A, Pergola G, Schwarz E, Smeland OB, Quarto T, Zink M, Andreassen OA, Westlye LT, Karolinska Schizophrenia Project Consortium. 2019. Brain Heterogeneity in Schizophrenia and Its Association With Polygenic Risk. JAMA Psychiatry 76:739–748. doi: 10.1001/jamapsychiatry.2019.0257 - DOI - PMC - PubMed
-
- Barbora Rehák Bučková, Charlotte Fraza, Rastislav Rehák, Marián Kolenič, Christian Beckmann, Filip Španiel, Andre Marquand, Jaroslav Hlinka. 2024. Using normative models pre-trained on cross-sectional data to evaluate longitudinal changes in neuroimaging data. bioRxiv 2023.06.09.544217. doi: 10.1101/2023.06.09.544217 - DOI
-
- Barth C, Kelly S, Nerland S, Jahanshad N, Alloza C, Ambrogi S, Andreassen OA, Andreou D, Arango C, Baeza I, Banaj N, Bearden CE, Berk M, Bohman H, Castro-Fornieles J, Chye Y, Crespo-Facorro B, de la Serna E, Díaz-Caneja CM, Gurholt TP, Hegarty CE, James A, Janssen J, Johannessen C, Jönsson EG, Karlsgodt KH, Kochunov P, Lois NG, Lundberg M, Myhre AM, Pascual-Diaz S, Piras F, Smelror RE, Spalletta G, Stokkan TS, Sugranyes G, Suo C, Thomopoulos SI, Tordesillas-Gutiérrez D, Vecchio D, Wedervang-Resell K, Wortinger LA, Thompson PM, Agartz I. 2023. In vivo white matter microstructure in adolescents with early-onset psychosis: a multi-site mega-analysis. Mol Psychiatry 28:1159–1169. doi: 10.1038/s41380-022-01901-3 - DOI - PMC - PubMed
-
- Bedford SA, Lai M-C, Lombardo MV, Chakrabarti B, Ruigrok A, Suckling J, Anagnostou E, Lerch JP, Taylor M, Nicolson R, Stelios G, Crosbie J, Schachar R, Kelley E, Jones J, Arnold PD, Courchesne E, Pierce K, Eyler LT, Campbell K, Barnes CC, Seidlitz J, Alexander-Bloch AF, Bullmore ET, Baron-Cohen S, Bethlehem RAI, MRC AIMS Consortium and Lifespan Brain Chart Consortium. 2023. Brain-charting autism and attention deficit hyperactivity disorder reveals distinct and overlapping neurobiology. MedRxiv Prepr Serv Health Sci 2023.12.06.23299587. doi: 10.1101/2023.12.06.23299587 - DOI
-
- Bethlehem R a I, Seidlitz J, White SR, Vogel JW, Anderson KM, Adamson C, Adler S, Alexopoulos GS, Anagnostou E, Areces-Gonzalez A, Astle DE, Auyeung B, Ayub M, Bae J, Ball G, Baron-Cohen S, Beare R, Bedford SA, Benegal V, Beyer F, Blangero J, Blesa Cábez M, Boardman JP, Borzage M, Bosch-Bayard JF, Bourke N, Calhoun VD, Chakravarty MM, Chen C, Chertavian C, Chetelat G, Chong YS, Cole JH, Corvin A, Costantino M, Courchesne E, Crivello F, Cropley VL, Crosbie J, Crossley N, Delarue M, Delorme R, Desrivieres S, Devenyi GA, Di Biase MA, Dolan R, Donald KA, Donohoe G, Dunlop K, Edwards AD, Elison JT, Ellis CT, Elman JA, Eyler L, Fair DA, Feczko E, Fletcher PC, Fonagy P, Franz CE, Galan-Garcia L, Gholipour A, Giedd J, Gilmore JH, Glahn DC, Goodyer IM, Grant PE, Groenewold NA, Gunning FM, Gur RE, Gur RC, Hammill CF, Hansson O, Hedden T, Heinz A, Henson RN, Heuer K, Hoare J, Holla B, Holmes AJ, Holt R, Huang H, Im K, Ipser J, Jack CR, Jackowski AP, Jia T, Johnson KA, Jones PB, Jones DT, Kahn RS, Karlsson H, Karlsson L, Kawashima R, Kelley EA, Kern S, Kim KW, Kitzbichler MG, Kremen WS, Lalonde F, Landeau B, Lee S, Lerch J, Lewis JD, Li J, Liao W, Liston C, Lombardo MV, Lv J, Lynch C, Mallard TT, Marcelis M, Markello RD, Mathias SR, Mazoyer B, McGuire P, Meaney MJ, Mechelli A, Medic N, Misic B, Morgan SE, Mothersill D, Nigg J, Ong MQW, Ortinau C, Ossenkoppele R, Ouyang M, Palaniyappan L, Paly L, Pan PM, Pantelis C, Park MM, Paus T, Pausova Z, Paz-Linares D, Pichet Binette A, Pierce K, Qian X, Qiu J, Qiu A, Raznahan A, Rittman T, Rodrigue A, Rollins CK, Romero-Garcia R, Ronan L, Rosenberg MD, Rowitch DH, Salum GA, Satterthwaite TD, Schaare HL, Schachar RJ, Schultz AP, Schumann G, Schöll M, Sharp D, Shinohara RT, Skoog I, Smyser CD, Sperling RA, Stein DJ, Stolicyn A, Suckling J, Sullivan G, Taki Y, Thyreau B, Toro R, Traut N, Tsvetanov KA, Turk-Browne NB, Tuulari JJ, Tzourio C, Vachon-Presseau É, Valdes-Sosa MJ, Valdes-Sosa PA, Valk SL, van Amelsvoort T, Vandekar SN, Vasung L, Victoria LW, Villeneuve S, Villringer A, Vértes PE, Wagstyl K, Wang YS, Warfield SK, Warrier V, Westman E, Westwater ML, Whalley HC, Witte AV, Yang N, Yeo B, Yun H, Zalesky A, Zar HJ, Zettergren A, Zhou JH, Ziauddeen H, Zugman A, Zuo XN, 3R-BRAIN, AIBL, Alzheimer’s Disease Neuroimaging Initiative, Alzheimer’s Disease Repository Without Borders Investigators, CALM Team, Cam-CAN, CCNP, COBRE, cVEDA, ENIGMA Developmental Brain Age Working Group, Developing Human Connectome Project, FinnBrain, Harvard Aging Brain Study, IMAGEN, KNE96, Mayo Clinic Study of Aging, NSPN, POND, PREVENT-AD Research Group, VETSA, Bullmore ET, Alexander-Bloch AF. 2022. Brain charts for the human lifespan. Nature 604:525–533. doi: 10.1038/s41586-022-04554-y - DOI - PMC - PubMed
Publication types
Grants and funding
LinkOut - more resources
Full Text Sources
Research Materials