[Preprint]. 2024 Jun 19:2024.06.19.599662.
doi: 10.1101/2024.06.19.599662.

Top-Down Proteomics Identifies Plasma Proteoform Signatures of Liver Cirrhosis Progression

Affiliations

Top-Down Proteomics Identifies Plasma Proteoform Signatures of Liver Cirrhosis Progression

Eleonora Forte et al. bioRxiv. .

Update in

Abstract

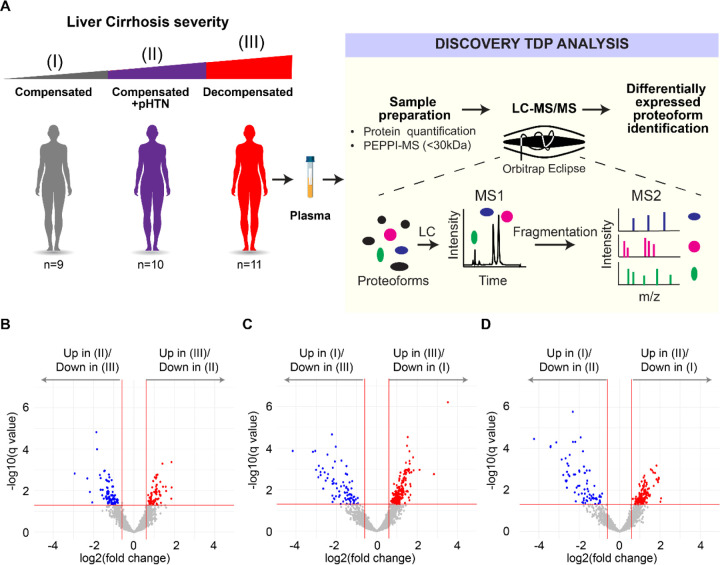
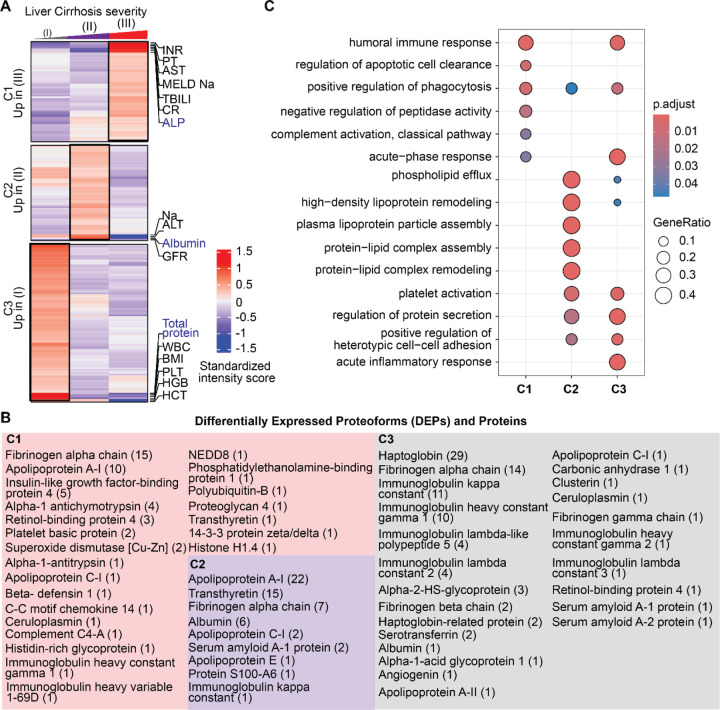
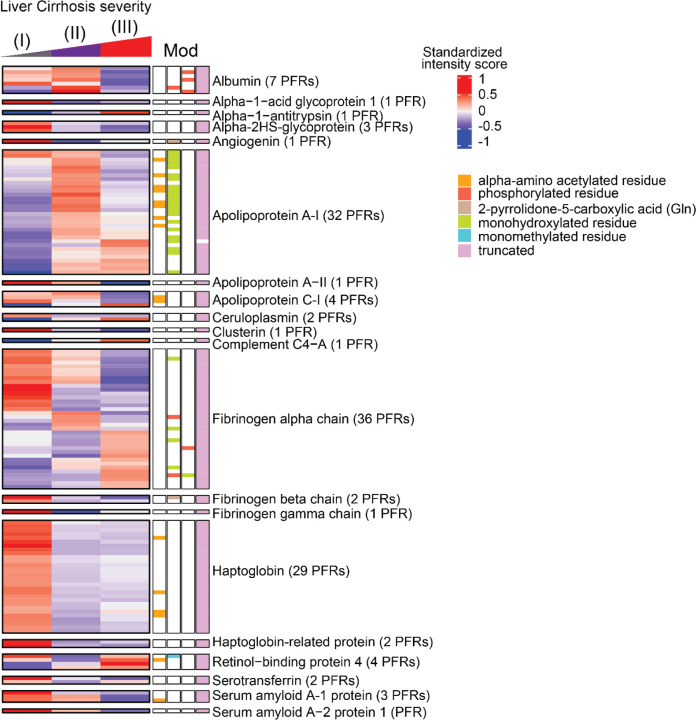
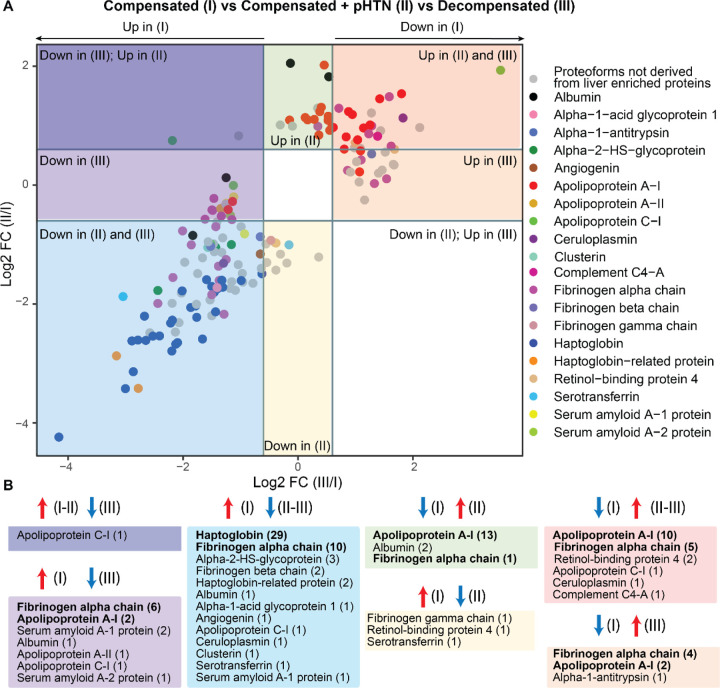
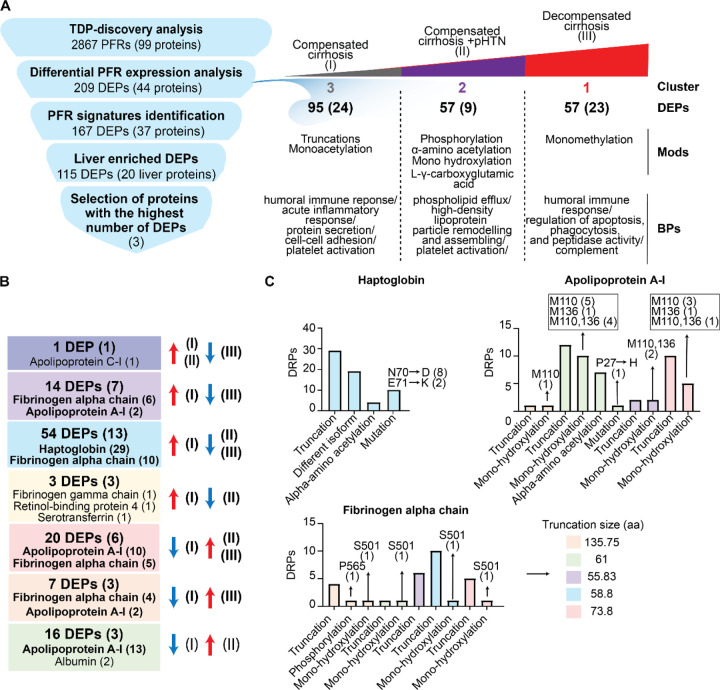
Cirrhosis, advanced liver disease, affects 2-5 million Americans. While most patients have compensated cirrhosis and may be fairly asymptomatic, many decompensate and experience life-threatening complications such as gastrointestinal bleeding, confusion (hepatic encephalopathy), and ascites, reducing life expectancy from 12 to less than 2 years. Among patients with compensated cirrhosis, identifying patients at high risk of decompensation is critical to optimize care and reduce morbidity and mortality. Therefore, it is important to preferentially direct them towards specialty care which cannot be provided to all patients with cirrhosis. We used discovery Top-down Proteomics (TDP) to identify differentially expressed proteoforms (DEPs) in the plasma of patients with progressive stages of liver cirrhosis with the ultimate goal to identify candidate biomarkers of disease progression. In this pilot study, we identified 209 DEPs across three stages of cirrhosis (compensated, compensated with portal hypertension, and decompensated), of which 115 derived from proteins enriched in the liver at a transcriptional level and discriminated the three stages of cirrhosis. Enrichment analyses demonstrated DEPs are involved in several metabolic and immunological processes known to be impacted by cirrhosis progression. We have preliminarily defined the plasma proteoform signatures of cirrhosis patients, setting the stage for ongoing discovery and validation of biomarkers for early diagnosis, risk stratification, and disease monitoring.


Conflict of interest statement

Conflict-of-interest statement: NLK is involved in entrepreneurial activities in top-down proteomics and consults for Thermo Fisher Scientific. RDM is a current Thermo Fisher Scientific employee. The other authors have declared that no conflict of interest exists.

Figures

Figure 1.
Figure 1.. Workflow used to identify differentially expressed proteoforms (DEPs) in patients with cirrhosis.
A) Plasma was extracted from cirrhosis patients with three stages of disease— compensated (I), compensated with portal hypertension (II), and decompensated cirrhosis (III). 30kDa fractions of plasma were then subjected to Top-Down Proteomics (TDP) to identify DEPs across disease stages. B-D) Volcano plots showing differentially expressed proteoforms (DEPs) in the plasma from patients with B) decompensated cirrhosis (III) vs compensated cirrhosis with portal hypertension (II), C) decompensated cirrhosis (III) vs compensated cirrhosis (I), and D) compensated cirrhosis with portal hypertension (II) vs compensated cirrhosis (I). A false discovery rate (FDR) threshold of 5% for differential expression was used.
Figure 2.
Figure 2.. Proteoforms found to be differentially expressed across stages of cirrhosis.
A) Cluster distribution of differentially expressed proteoforms (DEPs) and currently used clinical markers of disease severity. Clinical markers highlighted in blue are significantly different between stages. Cluster 1 (C1) included DEPs upregulated in Stage III disease, C2 included DEPs upregulated in stage II disease, and C3 included DEPs upregulated in Stage I disease. B) Proteins from which DEPs derived are shown within each cluster. The number of proteoforms of a given protein is shown in parentheses beside the protein name. For example, in C1 the fibrinogen alpha chain protein had 15 DEPs identified. C) Biological process enrichment analyses on proteins identified in each cluster. The level of significance is represented by the color of the bar with scale while the gene ratio is indicated by the diameter of the circle.
Figure 3.
Figure 3.. Heatmaps of quantified proteoforms of proteins enriched in the liver at transcriptional level.
Associated proteoform modifications are shown and defined by the figure legend. The proteins and number of identified proteoforms derived from each protein are shown to figure right. Abbreviations: PFR (proteoform), MOD (Modification).
Figure 4.
Figure 4.. Display of proteoforms stratified by expression in each stage of cirrhosis
A) Differentially expressed proteoforms (DEPs) in Stages II and III disease with Stage I disease (compensated) used as the reference. Proteoforms upregulated in Stage II and III (red square), upregulated only in Stage III (orange square), downregulated in Stages II and III (blue square), downregulated in Stage III only (light purple square), downregulated in Stage III but upregulated in Stage II (dark purple square), upregulated only in Stage II (green square), and downregulated only in Stage II (yellow square). Proteoforms deriving from proteins enriched in liver are highlighted and grouped by color according to the figure legend. B) Profiles of proteoforms upregulated in Stages I and II and downregulated in III (dark purple), upregulated in I and downregulated in III (light purple), upregulated in I and downregulated in II and II (light blue), downregulated in I and upregulated in II (green), upregulated in I and downregulated in II (yellow), downregulated in I and upregulated in II and III (red), and downregulated in I and upregulated in III (orange). The proteins from which DEPs derive and the relative number of proteoforms (in parenthesis) are shown. Proteins with the highest number of DEPs for each group are shown in bold.
Figure 5.
Figure 5.. Summary of quantitative TDP analysis of plasma proteoforms in patients with cirrhosis.
A) Strategy used to identify potential candidate proteoform biomarkers of liver cirrhosis and summary of the differential PFR expression analysis. Differentially expressed proteoforms (DEPs) were classified in clusters based on their upregulation in 1) compensated cirrhosis (Stage I- Cluster 3), 2) compensated cirrhosis with portal hypertension (Stage II- Cluster 2), and 3) decompensated cirrhosis (Stage III- Cluster 1). For each cluster, the number of upregulated DEPs with their relative proteins (in parenthesis), modifications, and biological processes are reported. B) Composition of the identified liver derived DEP signatures. Proteins from which the DEPs derive are shown in parenthesis. Proteins with the highest number of DEPs for each group are also reported and shown in bold. DEPs are grouped by color based on their upregulation or downregulation in disease stages as performed in Figure 4. For example, in the red group 20 DEPs deriving from 6 proteins were upregulated in Stages II and III of the disease as compared to Stage I disease. 10 of these DEPs derived from apolipoprotein A-I and 5 derived from fibrinogen alpha chain. C) DEPs relative to Haptoglobin, Apolipoprotein A-I, and Fibrinogen alpha chain, which are the 3 plasma proteins with the highest number of detected DEPs, are reported together with their modifications. Colors indicate the signature groups in B and C. Abbreviations: PFR (proteoform), DEP (Differentially expressed proteoform), Mod (Modification) BP (biological process), aa (amino acids).

References

    1. Mokdad A. A.; Lopez A. D.; Shahraz S.; Lozano R.; Mokdad A. H.; Stanaway J.; Murray C. J.; Naghavi M. Liver cirrhosis mortality in 187 countries between 1980 and 2010: a systematic analysis. BMC Med 2014, 12, 145. DOI: 10.1186/s12916-014-0145-y. - DOI - PMC - PubMed
    1. Xu J.; Murphy S. L.; Kochanek K. D.; Bastian B.; Arias E. Deaths: Final Data for 2016. Natl Vital Stat Rep 2018, 67 (5), 1–76. - PubMed
    1. Collaborators G. B. D. C. The global, regional, and national burden of cirrhosis by cause in 195 countries and territories, 1990–2017: a systematic analysis for the Global Burden of Disease Study 2017. Lancet Gastroenterol Hepatol 2020, 5 (3), 245–266. DOI: 10.1016/S2468-1253(19)30349-8. - DOI - PMC - PubMed
    1. Guo A.; Mazumder N. R.; Ladner D. P.; Foraker R. E. Predicting mortality among patients with liver cirrhosis in electronic health records with machine learning. PLoS One 2021, 16 (8), e0256428. DOI: 10.1371/journal.pone.0256428. - DOI - PMC - PubMed
    1. Ladner D. P.; Gmeiner M.; Hasjim B. J.; Mazumder N.; Kang R.; Parker E.; Stephen J.; Polineni P.; Chorniy A.; Zhao L.; et al. Increasing prevalence of cirrhosis among insured adults in the United States, 2012–2018. PLoS One 2024, 19 (2), e0298887. DOI: 10.1371/journal.pone.0298887. - DOI - PMC - PubMed

Publication types

LinkOut - more resources