[Preprint]. 2024 Jun 18:2024.06.18.599583.
doi: 10.1101/2024.06.18.599583.

The transcriptomic and spatial organization of telencephalic GABAergic neuronal types

Affiliations

The transcriptomic and spatial organization of telencephalic GABAergic neuronal types

Cindy T J van Velthoven et al. bioRxiv. .

Update in

  • Transcriptomic and spatial organization of telencephalic GABAergic neurons.
    van Velthoven CTJ, Gao Y, Kunst M, Lee C, McMillen D, Chakka AB, Casper T, Clark M, Chakrabarty R, Daniel S, Dolbeare T, Ferrer R, Gloe J, Goldy J, Guzman J, Halterman C, Ho W, Huang MJ, James K, McCue R, Nguy B, Cardenas T, Ronellenfitch K, Thomas ED, Torkelson A, Pagan CM, Kruse L, Dee N, Ng L, Waters J, Smith KA, Tasic B, Yao Z, Zeng H. van Velthoven CTJ, et al. Nature. 2025 Nov;647(8088):143-156. doi: 10.1038/s41586-025-09296-1. Epub 2025 Nov 5. Nature. 2025. PMID: 41193843 Free PMC article.

Abstract

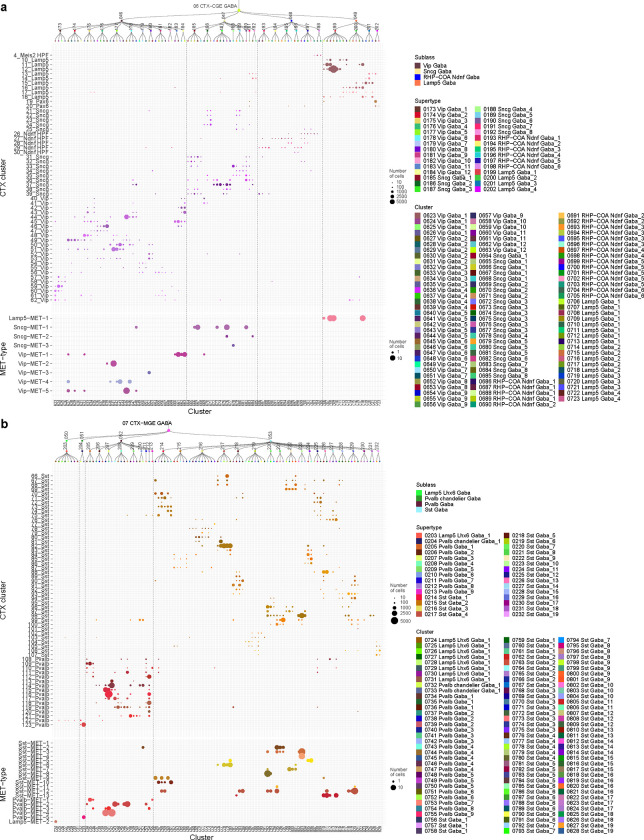
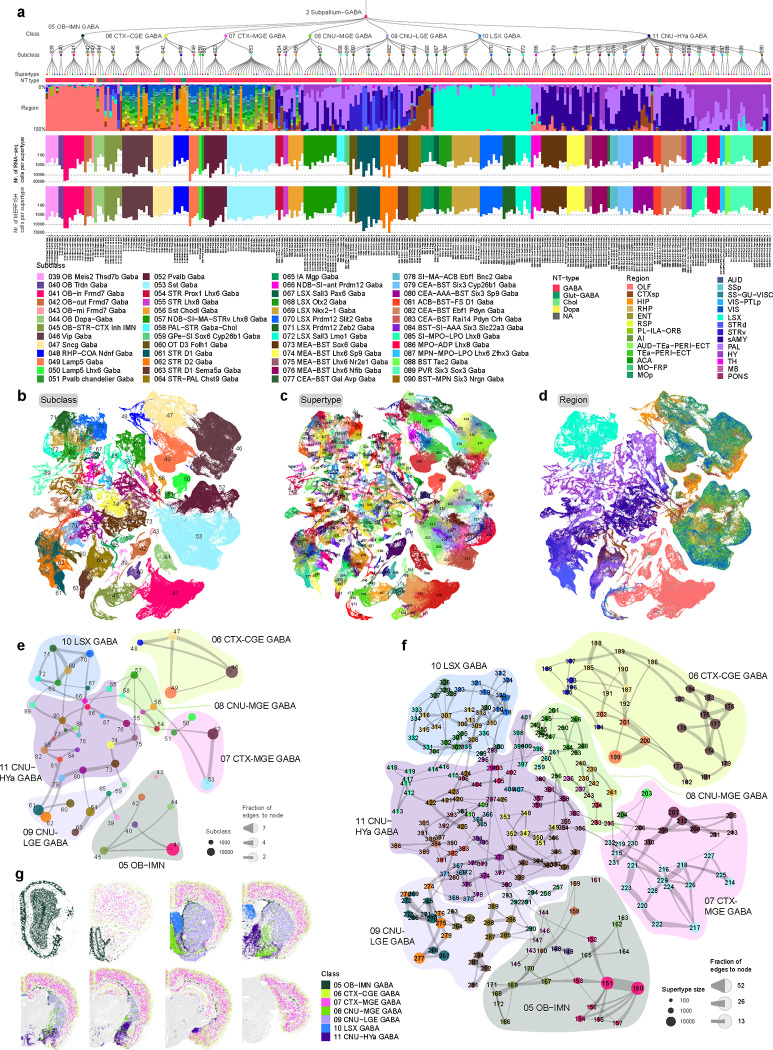
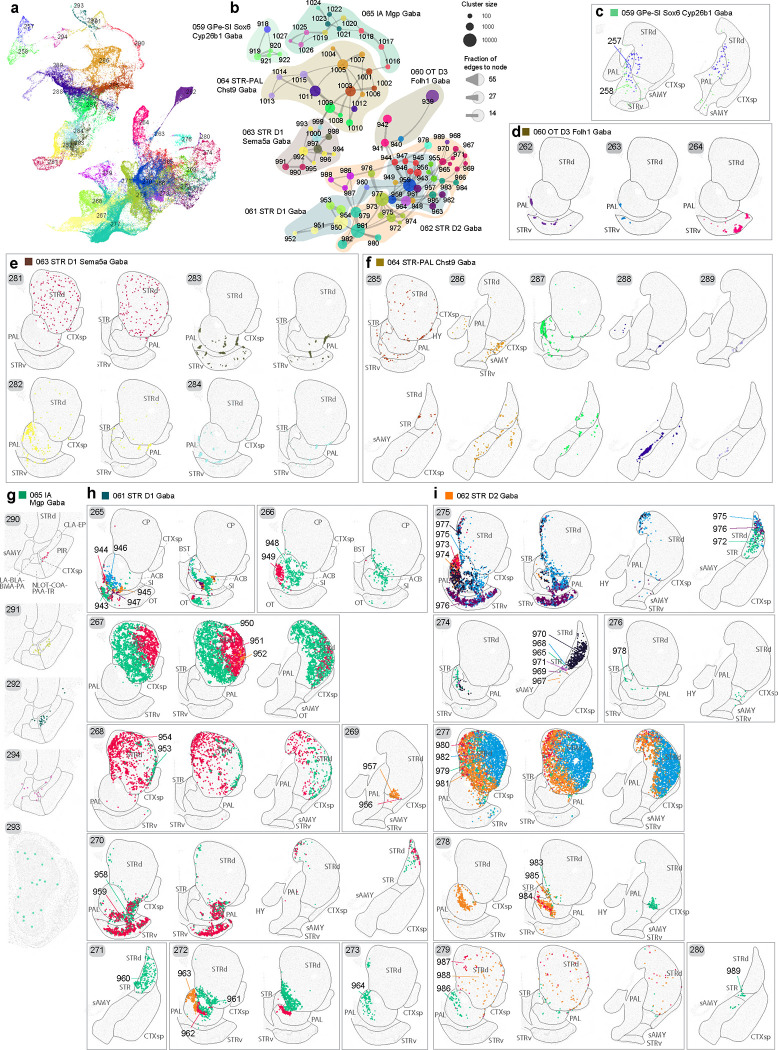
The telencephalon of the mammalian brain comprises multiple regions and circuit pathways that play adaptive and integrative roles in a variety of brain functions. There is a wide array of GABAergic neurons in the telencephalon; they play a multitude of circuit functions, and dysfunction of these neurons has been implicated in diverse brain disorders. In this study, we conducted a systematic and in-depth analysis of the transcriptomic and spatial organization of GABAergic neuronal types in all regions of the mouse telencephalon and their developmental origins. This was accomplished by utilizing 611,423 single-cell transcriptomes from the comprehensive and high-resolution transcriptomic and spatial cell type atlas for the adult whole mouse brain we have generated, supplemented with an additional single-cell RNA-sequencing dataset containing 99,438 high-quality single-cell transcriptomes collected from the pre- and postnatal developing mouse brain. We present a hierarchically organized adult telencephalic GABAergic neuronal cell type taxonomy of 7 classes, 52 subclasses, 284 supertypes, and 1,051 clusters, as well as a corresponding developmental taxonomy of 450 clusters across different ages. Detailed charting efforts reveal extraordinary complexity where relationships among cell types reflect both spatial locations and developmental origins. Transcriptomically and developmentally related cell types can often be found in distant and diverse brain regions indicating that long-distance migration and dispersion is a common characteristic of nearly all classes of telencephalic GABAergic neurons. Additionally, we find various spatial dimensions of both discrete and continuous variations among related cell types that are correlated with gene expression gradients. Lastly, we find that cortical, striatal and some pallidal GABAergic neurons undergo extensive postnatal diversification, whereas septal and most pallidal GABAergic neuronal types emerge simultaneously during the embryonic stage with limited postnatal diversification. Overall, the telencephalic GABAergic cell type taxonomy can serve as a foundational reference for molecular, structural and functional studies of cell types and circuits by the entire community.


Conflict of interest statement

Competing Interests H.Z. is on the scientific advisory board of MapLight Therapeutics, Inc. The other authors declare no competing interests.

Figures

Extended Data Figure 1.
Extended Data Figure 1.. GABAergic neuronal type composition in different regions of the telencephalon.
(a) Heatmap showing the proportion of cells in each broad region of the telencephalon per GABAergic supertype. (b) Heatmap showing the proportion of cells in each supertype from 06 CTX-CGE GABA and 07 CTX-MGE GABA classes in each cortical layer and substructure of the hippocampal formation.
Extended Data Figure 2.
Extended Data Figure 2.. Neuropeptide gene expression in telencephalic GABAergic neuronal types.
(a-e) Dot plot showing gene expression level of differentially expressed neuropeptides in each cluster across classes 6 CTX-CGE GABA and 7 CTX-MGE GABA (a), 8 CNU-MGE GABA and 9 CNU-LGE GABA (b), 5 OB-IMN GABA (c), 10 LSX GABA (d), and 11 CNU-HYa GABA (e). Dot size and color indicate proportion of expressing cells and average expression level in each cluster, respectively.
Extended Data Figure 3.
Extended Data Figure 3.. GABAergic and immature neuronal cell types of olfactory bulbs.
UMAP representation of GABAergic and immature neuronal types in olfactory bulbs colored by supertype (a). (b) Constellation plot of OB-IMN GABA clusters using UMAP coordinates shown in b. Nodes are colored by supertype and grouped in bubbles by subclass. (c) Dendrogram of OB-IMN GABA supertypes followed by bar graphs showing major neurotransmitter type and region distribution of profiled cells, followed by dot plot showing marker gene expression in each supertype from the 10xv3 dataset. Dot size and color indicate proportion of expressing cells and average expression level in each supertype, respectively. (d) Schematic drawing of anatomical structure in MOB (left) and AOB (right). Abbreviations: RMS, rostral migratory stream; GrO, granular layer; IPl, internal plexiform layer; Mi, mitral layer; EPl, external plexiform layer; Gl, glomerular layer. (e-k) Representative MERFISH sections showing the location of OB subclasses 39 MOB Meis2 Gaba (e), 40 OB Trdn Gaba (f), 42 OB-out Frmd7 Gaba (g), 43 OB-mi Frmd7 Gaba (h), 44 OB Dopa-Gaba (i), 41OB-in Frmd7 Gaba (j), and 45 OB-STR-CTX Inh IMN (k). Cells are colored and labelled by supertype.
Extended Data Figure 4.
Extended Data Figure 4.. Correspondence between the current transcriptomic taxonomy of OB-IMN GABA and CNU-LGE GABA classes and previously published ones.
Correspondence was determined by mapping cells from previously published datasets to the current taxonomy as described before. (a,b) Mapping of Tepe et al., 201821 (a) and Cebrian-Silla et al., 202118 (b) to the OB-IMN GABA class. (c,d) Mapping of Stanley et al., 202034 (c) and Chen et al., 202133 (d) to the CNU-LGE GABA class.
Extended Data Figure 5.
Extended Data Figure 5.. CGE-derived GABAergic neuronal types in the cerebral cortex.
(a) UMAP representation of all CGE clusters colored by supertype. (b) Constellation plot of CGE clusters using UMAP coordinates shown in a. Nodes are colored by supertype and grouped in bubbles by subclass. (c) Dendrogram of CGE supertypes followed by bar graphs showing major neurotransmitter type, region distribution of profiled cells, dominant region, and number of cells within supertype, followed by dot plot showing marker gene expression in each supertype from the 10xv3 dataset. The dominant region was assigned if more than 70% of cells are from the assigned region. For the gene expression dot plot, dot size and color indicate proportion of expressing cells and average expression level in each supertype, respectively. (d-g) Representative MERFISH sections showing the location of supertypes in CGE subclasses 46 Vip Gaba (d), 47 Sncg Gaba (e), 48 RHP-COA Ndnf Gaba (f), and 49 Lamp5 Gaba (g). Cells are colored and labelled by supertype.
Extended Data Figure 6.
Extended Data Figure 6.. Correspondence of CGE and MGE GABAergic neuronal types with previously published cell-type taxonomies.
(a-b) CGE (a) and MGE (b) GABAergic cell types identified in this study are compared to cell types in CTX-HPF study and VISp Patch-seq study. Size of the dots corresponds to the number of overlapping cells in corresponding taxonomies. Columns are separated by supertypes, and rows are separated manually based on subclass in corresponding dataset.
Extended Data Figure 7.
Extended Data Figure 7.. LGE-derived GABAergic cell types of the cerebral nuclei.
(a) Dendrogram of CNU-LGE supertypes followed by bar graphs showing major neurotransmitter type and region distribution of profiled cells, followed by dot plot showing marker gene expression in each supertype from the 10xv3 dataset. Dot size and color indicate proportion of expressing cells and average expression level in each supertype, respectively. (b-i) Based on the gene modules (blue and purple) identified in Figure 5g–h, a cumulative gene score was calculated using UCell. UMAPs showing CNU-LGE GABAergic neurons (b,c,f,g), and representative MERFISH sections (d,e,h,i) colored by blue gene module score for STR D1 (b,d) and STR D2 (c,e) types or colored by purple gene module score for STR D1 (f,h) and STR D2 (g,i) types.
Extended Data Figure 8.
Extended Data Figure 8.. GABAergic cell types of the lateral septum.
(a-b) UMAP representation of all LSX clusters colored by subclass (a) or supertype (b). (c) Constellation plot of LSX clusters using UMAP coordinates shown in b. Nodes are colored by supertype and grouped in bubbles by subclass. (d) Dendrogram of LSX supertypes followed by tiles showing major neurotransmitter type, followed by a heatmap showing the region distribution of profiled cells, then followed by dot plot showing marker gene expression in each supertype from the 10xv3 dataset. Dot size and color indicate proportion of expressing cells and average expression level in each supertype, respectively. (e-j) Representative MERFISH sections showing the location of the LSX subclasses 67 LSX Sall3 Pax6 Gaba (e), 68 LSX Otx2 Gaba (f), 69 LSX Nkx2-1 Gaba (g), 70 LSX Prdm12 ve Gaba (h), 71 LSX Prdm12 do Gaba (i), and 72 LSX Sall3 Lmo1 Gaba (j).
Extended Data Figure 9.
Extended Data Figure 9.. GABAergic cell types of the CNU and anterior hypothalamus (HYa).
(a-b) UMAP representation of all CNU-HYa clusters colored by subclass (a) or supertype (b). (c) Constellation plot of CNU-HYa supertypes using UMAP coordinates shown in b. Nodes are colored by supertype and grouped in bubbles by subclass. (d) Dendrogram of CNU-HYa supertypes followed by tiles showing major neurotransmitter type, followed by a heatmap showing the region distribution of profiled cells, then followed by dot plot showing marker gene expression in each supertype from the 10xv3 dataset. Dot size and color indicate proportion of expressing cells and average expression level in each supertype, respectively.
Extended Data Figure 10.
Extended Data Figure 10.. Correspondence between the current transcriptomic taxonomy of the CNU-HYa class and previously published ones.
Correspondence was determined by mapping cells from previously published datasets to the current taxonomy as described before. (a-b) Mapping of Knoedler et al., 2022 (a) and Hochgerner et al., 2023 (b) to supertypes in the CNU-HYa class or the entire telencephalic GABAergic taxonomy.
Extended Data Figure 11.
Extended Data Figure 11.. Distribution of basal forebrain cholinergic neurons.
(a) UMAP representation of all telencephalic GABAergic neurons as in Figure 1b–d, cells in background are colored classes that contain cholinergic neurons and foreground cells are colored by supertype. The insert shows the cholinergic neurons belonging to the CNU GABA class colored by cluster. (b-d) Representative MERFISH sections showing cholinergic neurons colored by cluster for supertypes 259 PAL-STR Gaba-Chol_1 (b), 260 PAL-STR Gaba-Chol_2 (c), and 307 LSX Nkx2-1 Gaba_2 (d). (e) Dot plot showing marker gene expression in each cholinergic cluster from the 10xv3 dataset. Dot size and color indicate proportion of expressing cells and average expression level in each cluster, respectively.
Extended Data Figure 12.
Extended Data Figure 12.. Laminar distribution of MGE GABAergic neurons in cortex and hippocampal formation.
(a) Heatmap showing the proportion of cells in each layer or region of the isocortex and HPF for supertypes in the MGE-CTX GABA class. (b,c) Representative MERFISH sections showing the distribution of neurons across cortex and hippocampal formation in select supertypes from subclasses 42 Pvalb Gaba (b) and 43 Sst Gaba (c). (d,e) Dot plot showing expression level of genes driving the gene expression gradient along the cortical depth for supertypes (ordered from superficial to deep) within the Pval Gaba (d) and Sst Gaba (e) subclasses. Dot size and color indicate proportion of expressing cells and average expression level in each supertype, respectively. (f, g) Representative examples of genes that drive the laminar gene expression gradient, plotted on the same MERFISH section as in panels b and c, shown for the 42 Pvalb Gaba (f) and 43 Sst Gaba (g) subclasses.
Extended Data Figure 13.
Extended Data Figure 13.. Spatial gradients in LSX.
(a) Heatmap showing expression of genes that drive the spatial gradients among subclasses in LSX. Top five gene modules containing genes that are both up- and down-regulated along the spatial gradients. We calculated the gene signature score for these modules for every cell and colored the scRNA-seq UMAP representation (b) and representative MERFISH sections (c) by gene score.
Extended Data Figure 14.
Extended Data Figure 14.. Transcription factor expression marking developmental lineages.
(a) UMAP representation of all cells across E11-E14, P0, P14 and P56 time points colored by expression level of major lineage marker genes. The colored dots next to each gene name show the classes that express that gene. (b) Representative MERFISH sections showing expression of key transcription factors in GABAergic neurons. Genes marked with parentheses show expected spatial gene expression pattern based on imputed data (see Methods).
Extended Data Figure 15.
Extended Data Figure 15.. Developmental trajectory of CGE- and MGE-derived neurons.
(a-c) UMAP representation of all neurons at E11.5-E14.5, P0, and P14 that will form the 06 CTX-CGE GABA, 07 CTX-MGE GABA, and 08 CNU-MGE GABA classes colored by age (a), class (b), or subclass (c). (d,e) Constellation plots showing all clusters using UMAP coordinates. Nodes are colored by subclass (d), or proportion of age group (e). (f) UMAPs showing expression of genes that link the Lamp5 Lhx6 subclass to both CGE and MGE origins.
Extended Data Figure 16.
Extended Data Figure 16.. Developmental trajectory of CNU LGE-derived neurons.
(a-b) UMAP representation of all neurons at E11.5-E14.5, P0, and P14 that are derived from LGE and will populate the OB-IMN and CNU-LGE classes. UMAPs are colored by age (a) or subclass (b). (c) Constellation plot showing all developmental clusters using UMAP coordinates from panel a. Nodes are colored by supertype and bubbles behind constellation are colored by subclass. (d-e) UMAP representation of all neurons at E11.5-E14.5, P0, and P14 that will form the CNU-LGE class. UMAPs are colored by subclass (d) or age (e). (f) Heatmap showing differentially expressed genes in the STR D1 and STR D2 lineages across time. Twelve gene modules were identified that show various modes of expression along and between subclasses over time. (g-j) Gene module scores marking different stages along the maturation path of D1 and D2 neurons. Gene modules 2 and 1 highlight immature STR D1 (g) and immature STR D2 (h) neurons respectively, while gene modules 12 and 8 mark mature STR D1 (i) and mature STR D2 (j) neurons respectively. (k-n) UMAP representation like in panels d-e colored by major lineage markers. (o-q) Gene module 6 contains genes highlighting the delayed maturation of STR D2 vs STR D1 neurons (o), such as two exemplar genes Hs6st2 (p) and Pam (q). (r-t) Gene module 7 contains genes whose expressions converge along the maturation trajectory of STR D1 and STR D2 neurons (r), such as two exemplar genes Tnr (s) and Arid5b (t). (u) Violin plot showing the transcriptomic distance between STR D1 and STR D2 subclass transcriptomes across the time course.
Extended Data Figure 17.
Extended Data Figure 17.. Developmental trajectory of LSX and CNU-HYa GABAergic neurons.
(a-c) UMAP representation of all neurons at E11.5-E14.5, P0, and P14 that will form the 10 LSX GABA and 11 CNU-HYa GABA classes colored by class (a), subclass (b), and age (c). (d) UMAP representation as in panels a-c colored by expression level of subclass marker genes. The colored dots next to each gene name show the subclasses expressing that gene.
Figure 1.
Figure 1.. Transcriptomic taxonomy of telencephalic GABAergic neuronal types in the mouse.
(a) The transcriptomic taxonomy of 285 supertypes organized in a dendrogram (10xv2: n = 271,656 cells; 10xv3 n = 343,761 cells). From top down, the bar plots represent subclass, major neurotransmitter (NT) type, region distribution of profiled cells, number of RNA-seq cells, and number of MERFISH cells per supertype. (b-d) UMAP representation of all cell types colored by subclass (b), supertype (c), and dissection region (d). (e) Constellation plot of the global relatedness between subclasses. Each subclass is represented by a disk, labeled by the subclass ID, and positioned at the subclass centroid in UMAP coordinates shown in panel b. The size of the disk corresponds to the number of cells within each subclass, and the edge weights correspond to the fraction of shared neighbors (see Methods) between subclasses. (f) Constellation plot as in panel e but showing relatedness between supertypes. Each supertype is colored by the subclass it belongs to. Bubbles drawn around supertypes outline the major classes. (g) Representative MERFISH sections of adult mouse brain across forebrain structures colored by cell class. Each class is labelled by its ID and shown in the same color in the dendrogram and bubbles in the constellation plot.
Figure 2.
Figure 2.. MGE-derived GABAergic cell types in the cerebral cortex and cerebral nuclei.
(a-c) UMAP representation of all MGE clusters colored by subclass (a), supertype (b), or broad brain region (c). (d) Constellation plot of MGE clusters using UMAP coordinates shown in b. Nodes are colored by supertype and grouped in bubbles by subclass. Lines around the bubbles denote the class the nodes belong to. (e) Dendrogram of MGE supertypes followed by bar graphs showing major neurotransmitter type, region distribution of profiled cells, dominant region, and number of cells within supertype, followed by dot plot showing marker gene expression in each supertype from the 10xv3 dataset. The dominant region was assigned if more than 70% of cells are from the OLF-HPF-CTXsp regions. For the gene expression dot plot, dot size and color indicate proportion of expressing cells and average expression level in each supertype, respectively. (f-n) Representative MERFISH sections showing the location of supertypes in MGE subclasses 50 Lamp5 Lhx6 Gaba (f), 51 Pvalb chandelier Gaba (g), 52 Pvalb Gaba (h), 53 Sst Gaba (i), 54 STR Prox1 Lhx6 Gaba (j), 55 STRv Lhx8 Gaba (k), 56 Sst Chodl Gaba (l), 57 NDB–SI–MA–STRv Lhx8 Gaba (m), 58 PAL–STR Gaba–Chol (n). Cells are colored and labelled by supertype.
Figure 3.
Figure 3.. LGE-derived GABAergic cell types of the cerebral nuclei.
(a) UMAP representation of all LGE clusters colored by supertype. (b) Constellation plot of LGE clusters using UMAP coordinates shown in a. Nodes are colored by supertype and grouped in bubbles by subclass. (c-g) Representative MERFISH sections showing the location of LGE subclasses, 58 GPe Sox6 Cyp26b1 Gaba (c), 60 OT D3 Folh1 Gaba (d), 63 STR D1 Sema5a Gaba (e), 64 STR–PAL Chst9 Gaba (f), 65 IA Mgp Gaba (g). Cells are colored and labelled by supertype. (h-i) Representative MERFISH sections showing the location of CNU-LGE subclasses, 61 STR D1 Gaba (h) and 62 STR D1 Gaba (i). Each box contains one supertype and cells are labelled and colored by cluster to highlight the diversity.
Figure 4.
Figure 4.. Organization of GABAergic neuronal types across striatum-like amygdalar nuclei and bed nuclei of the stria terminalis.
(a) Representative MERFISH sections showing the location of subclasses belonging to the CNU-HYa neuronal class. Cells are colored by the subclass they belong to and labelled by its ID. (b-c) Representative MERFISH sections showing the locations of cells belonging to the MEA-BST subclasses (b) and CEA-BST subclasses (c). Each row shows one subclass, and cells are colored and labelled by supertype identity. For each subclass the location in both MEA and BST (b) or CEA and BST (c) are shown, indicating the existence of the same cell types in these locations. (d-f) Spatial domain clustering within BST neurons using Banksy. The alluvial plot (d) shows the relation between subclasses present in BST and the spatial domains. Representative MERFISH images show the location of the spatial domains, with cells colored by spatial domain identity (e) and the area covered by each domain (f).
Figure 5.
Figure 5.. Gene signatures defining shared gradients in D1 and D2 medium spiny neurons.
(a) Constellation plot of clusters showing the pairs of most similar clusters between 61 STR D1 Gaba and 62 STR D2 Gaba subclasses. Clusters are represented by a disk colored by cluster, labeled by cluster ID, and disks with a colored border are highlighted exemplars in panels b to f. (b-f) Representative MERFISH sections showing five examples of STR D1 and STR D2 pairs from panel a, and their spatial distribution patterns. Sections are colored by cluster identity. (g-h) Gene expression dot plots of two major gene modules driving the spatial gradient among STR D1 (g) and STR D2 (h) clusters. Dot size and color indicate proportion of expressing cells and average expression level in each cluster, respectively. Underneath the dot plot a violin plot of the medial-lateral (x) coordinate for each MERFISH cell per cluster is shown.
Figure 6.
Figure 6.. Transcription factor expression in telencephalic GABAergic neurons.
(a) The supertype dendrogram from Figure 1, followed by a heatmap showing the expression of key transcription factors in each supertype in the taxonomy tree. (b-e) UMAP representation of all cell types across the developmental time course, E11.5-E14.5, P0, P14, and P56, colored by age (b), class (c), P56 subclass (d), and major developmental lineage gene markers (e).

References

    1. Wang Q. et al. The Allen Mouse Brain Common Coordinate Framework: A 3D Reference Atlas. Cell 181, 936–953 e20 (2020). - PMC - PubMed
    1. Swanson L. W. Brain Architecture: Understanding the Basic Plan. (Oxford University Press, 2012).
    1. Hu J. S., Vogt D., Sandberg M. & Rubenstein J. L. Cortical interneuron development: a tale of time and space. Development 144, 3867–3878 (2017). - PMC - PubMed
    1. Lim L., Mi D., Llorca A. & Marín O. Development and Functional Diversification of Cortical Interneurons. Neuron 100, 294–313 (2018). - PMC - PubMed
    1. Flames N. et al. Delineation of multiple subpallial progenitor domains by the combinatorial expression of transcriptional codes. J. Neurosci. 27, 9682–9695 (2007). - PMC - PubMed

Publication types

LinkOut - more resources