[Preprint]. 2024 Nov 11:2024.06.21.600153.
doi: 10.1101/2024.06.21.600153.

A genome resource for the marine annelid Platynereis dumerilii

Affiliations

A genome resource for the marine annelid Platynereis dumerilii

Kevin Nzumbi Mutemi et al. bioRxiv. .

Update in

  • A genome resource for the marine annelid Platynereis spp.
    Mutemi KN, Simakov O, Pan L, Santangeli L, Null RW, Handberg-Thorsager M, Vellutini BC, Peterson KJ, Fromm B, Larsson T, Savage E, Lopez MO, Hercog R, Provaznik J, Ordoñez-Rueda D, Azevedo N, Gazave E, Vervoort M, Tomancak P, Tan W, Winkler S, Benes V, Hui J, Helm C, Özpolat BD, Arendt D. Mutemi KN, et al. BMC Genomics. 2025 Jul 14;26(1):665. doi: 10.1186/s12864-025-11727-2. BMC Genomics. 2025. PMID: 40660120 Free PMC article.

Abstract

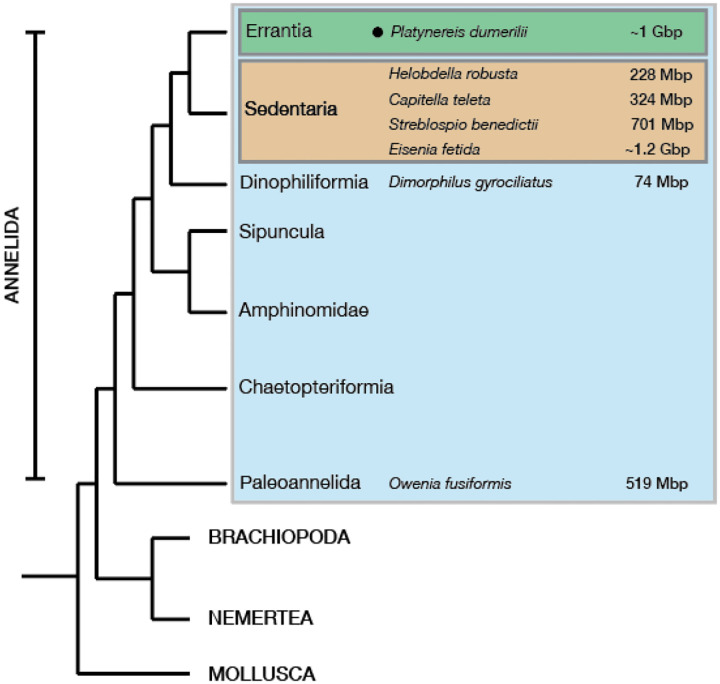
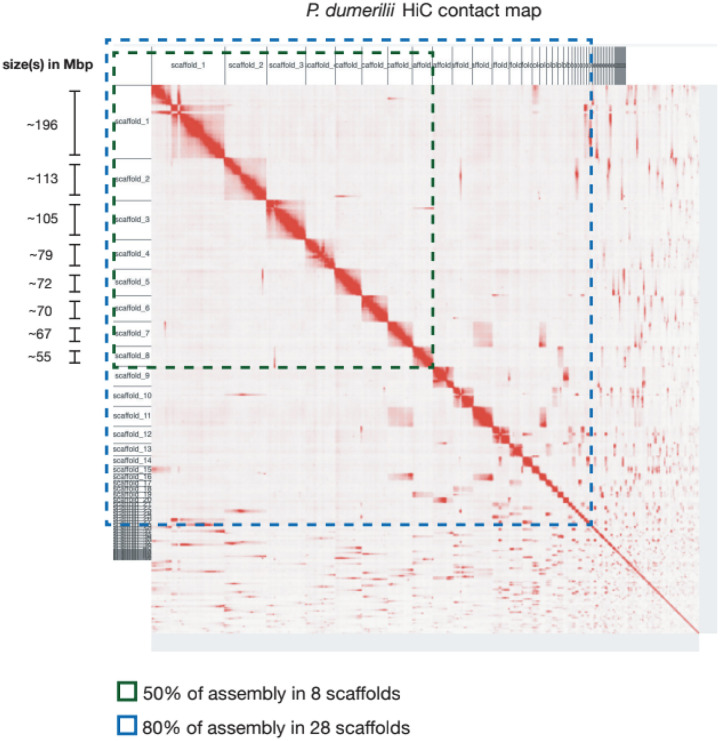
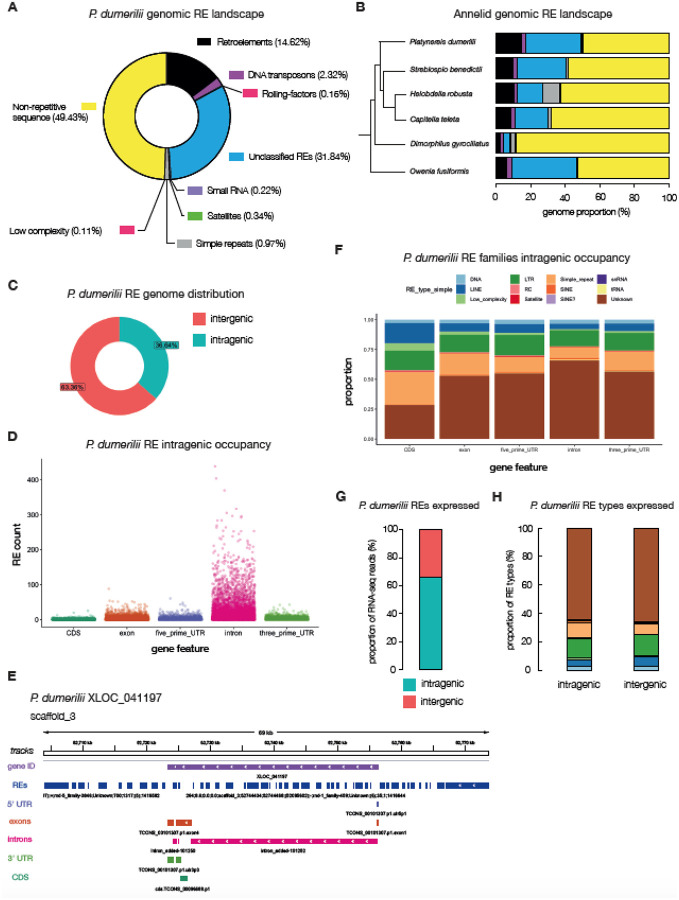
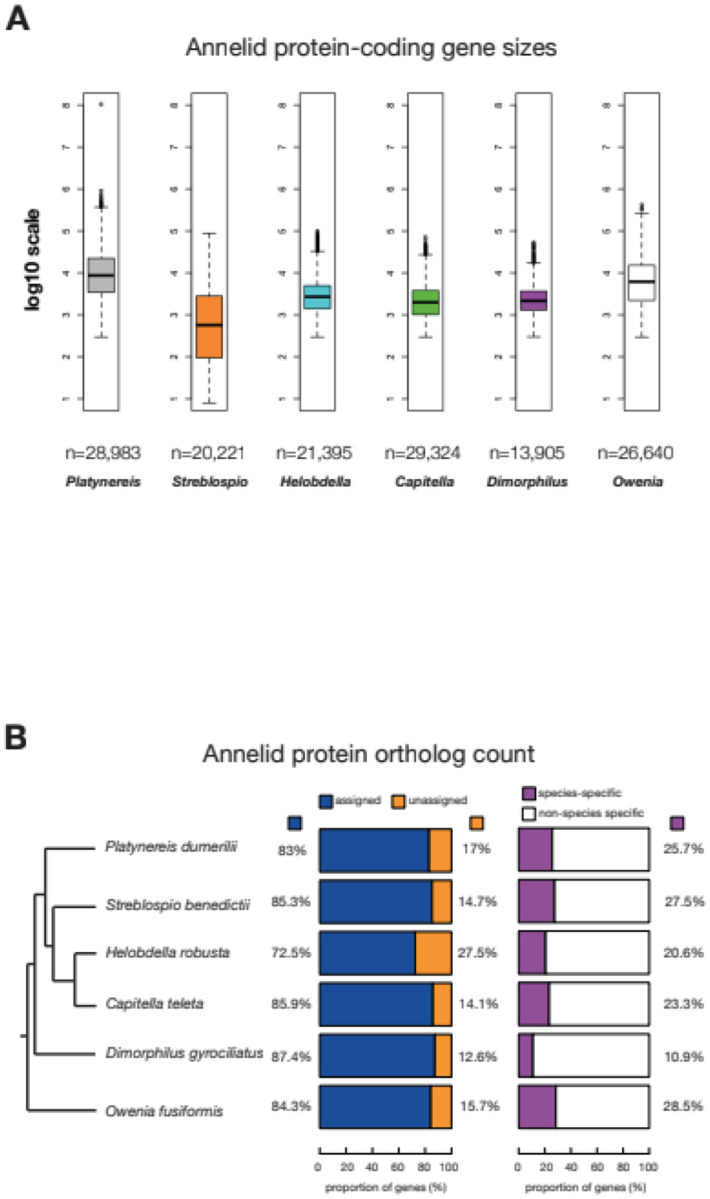
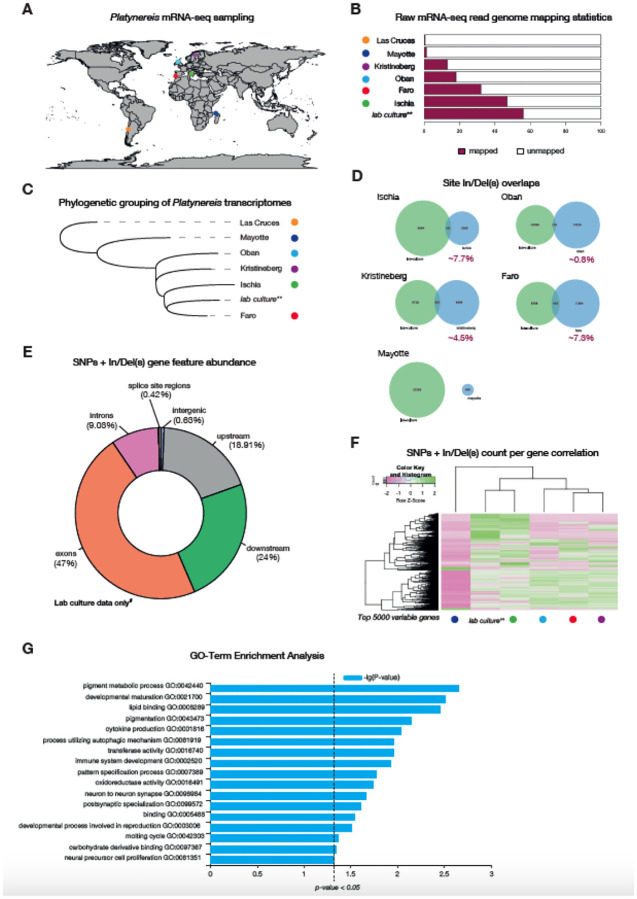
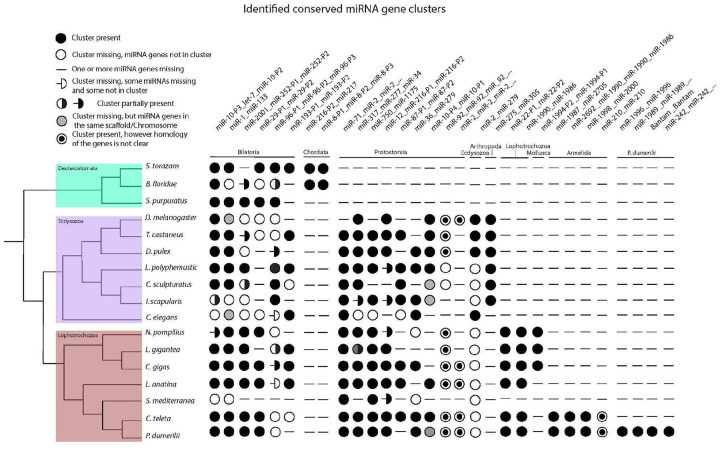
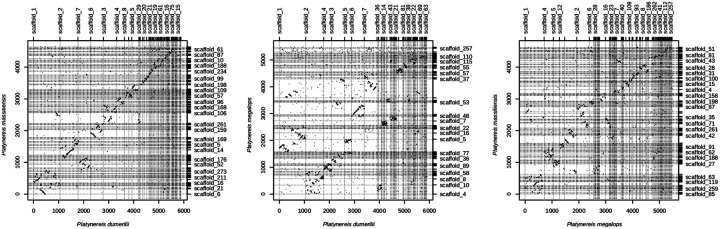
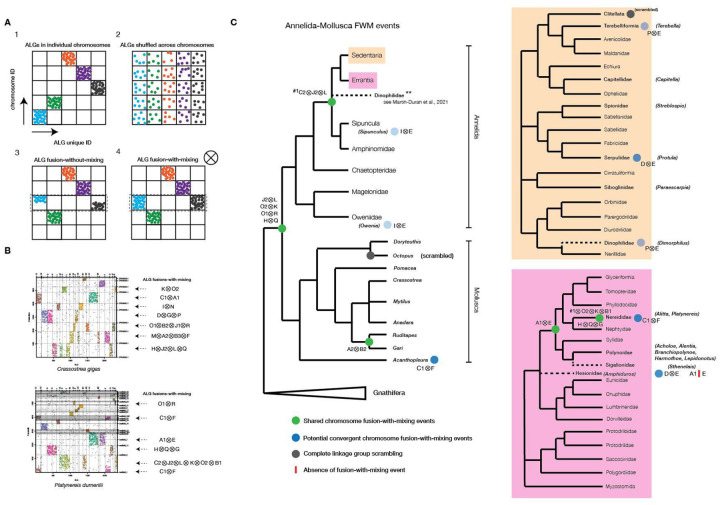
The marine annelid Platynereis dumerilii is a model organism used in many research areas including evolution and development, neurobiology, ecology and regeneration. Here we present the genomes of P. dumerilii (laboratory culture reference and a single individual assembly) and of the closely related P. massiliensis and P. megalops (single individual assembly) to facilitate comparative genomic approaches and help explore Platynereis biology. We used long-read sequencing technology and chromosomal-conformation capture along with extensive transcriptomic resources to obtain and annotate a draft genome assembly of ~1.47 Gbp for P. dumerilii, of which more than half represent repeat elements. We predict around 29,000 protein-coding genes, with relatively large intron sizes, over 38,000 non-coding genes, and 105 miRNA loci. We further explore the high genetic variation (~3% heterozygosity) within the Platynereis species complex. Gene ontology reveals the most variable loci to be associated with pigmentation, development and immunity. The current work sets the stage for further development of Platynereis genomic resources.

Keywords: Platynereis; Platynereis dumerilii; Spiralia; annelid; evo-devo; genome; model organism.


Figures

Figure 1.
Figure 1.. Platynereis dumerilii genome within Spiralia.
A phylogenetic tree of major Spiralia/Lophotrochozoa groups, with the sequenced and ‘annotated’ annelid genome size estimates highlighted. The genome sizes are based off genome assemblies or DNA nuclei staining methods. The Platynereis dumerilii genome size numbers from (Jha et al., 1995), Helobdella robusta and Capitella teleta values were taken from (Simakov et al., 2013), the Eisenia fetida genome size estimates were taken from (Bhambri et al., 2018; Zwarycz et al., 2015), the Streblospio benedictii measurements were taken from (Zakas et al., 2022), the Dimorphilus gyrociliatus genome size from (Martín-Durán et al., 2021) and the Owenia fusiformis’ from (Liang et al., 2022).
Figure 2.
Figure 2.. A chromosomal scale P. dumerilii genome assembly.
A Hi-C contact map of all 330 P. dumerilii scaffolds. Highlighted in green are the 8 scaffolds that make up 50% of the assembly and in blue are the 28 scaffolds amounting to 80% of the assembly.
Figure 3.
Figure 3.. The repeat-element landscape in P. dumerilii.
A, a doughnut plot illustrating the percentages of repeat and non-repeat elements found in the P. dumerilii genome. Percentages are of the total assembly (i.e. 49.43% of the entire genome is annotated as non-repetitive; yellow). B, annelids – whose relationships are shown in a phylogenetic tree – genomic repeat-element landscape. C, the distribution of intra – vs – inter-genic P. dumerilii repeat elements. D, counts of repeat elements represented as scatterplots within annotated intragenic regions of the P. dumerilii genome. E, an example gene locus (XLOC_041197) and its flanking regions on scaffold_3 highlighting repeat-element tracks (dark-blue) with the 5’ and 3’ UTRs (light-purple and green tracks respectively), exons (dark-orange track), introns (pink tracks) and the CDS (green tracks). F, proportion of repeat-element families and their occupancy at different intragenic regions. G, proportion of repeat-element specific RNA-seq reads mapping to intra – vs – inter-genic sites in P. dumerilii. H, proportion of RNA-seq reads mapping to intra – vs – inter-genic sites within specific RE types, colored according to the same legend in panel F.
Figure 4.
Figure 4.. The protein coding repertoire in annelids.
A, Annelid protein coding gene sizes plotted in log10 scale. The n values represent the total number of protein-coding genes that were measured for gene size, spanning the actual gene locus i.e. exons, introns and UTRs. The longest isoforms per gene were selected for the analysis. B, Proportion of annelid protein-coding genes in orthogroups.
Figure 5.
Figure 5.. Genomic and transcriptomic variation analyses on wild sampled P. dumerilii.
A, global map of sites of P. dumerilii mRNA sampling. B, histogram of raw mRNA-seq genome mapping percentages. C, phylogenetic grouping/sorting of wild sampled Platynereis transcriptomes via OrthoFinder. D, proportion of In/Del overlaps identified from the different Platynereis samples. E, gene feature abundance/occupancy of SNPs and In/Dels from mRNA-seq reads accessed from P. dumerilii lab cultures. F, SNP and In/Del counts from the same position on the genome correlation for the top 5,000 most variable genes (i.e. genes that showed the most variation in SNP and In/Del counts across the different sites). G, GO-term enrichment analysis of the top 5,000 variable genes.
Figure 6.
Figure 6.
This scheme shows the distribution of phylogenetically conserved miRNA gene clusters in selected bilaterian phyla from the MirGeneDB database. Species are listed on the left, with P. dumerilii shown at the bottom. The tree, next to the species names, reflects state of the art of the lophotrochozoan clade phylogeny, with the branching taken from Marlétaz et al. (2019). The names of the miRNA clusters are defined by the comprised miRNA genes, separated by underscores (_), and are listed at the top of the figure. Since the order of miRNA genes in genomic clusters can vary between different species, the nomenclature follows three hierarchical criteria: 1. The gene order in the P. dumerilii genome; 2. The most common arrangement in the analysed species 3. Alphabetical order, when the first two criteria cannot be fulfilled. When the same miRNA gene name is repeated in the cluster, it indicates the presence of multiple copies, with uncertain homology, of the correspondent gene family. If the cluster name ends with three dots (…) more copies of the last listed gene are present. The number of copies can vary between species. miRNA clusters are grouped and ordered according to their phylogenetic conservation, with the respective clades indicated just below the clusters. Here follows the description of the symbols. Full circle: the cluster listed above is present in the corresponding specie, with all genes included in the cluster. Empty circle: miRNA genes are found in the genome but not clustered together. Hyphen (−): corresponding miRNA genes are not found in the genome. Including when only one member of a two-gene cluster is missing. For clusters composed of three or more genes, there are three additional scenarios with respective symbols: 1. Hyphen followed by an empty half-circle: some miRNA genes are absent in the genome, while others are present but not clustered; 2. Circle half full: some miRNA genes are clustered, while others are not. 3. Hyphen followed by a full half-circle: some genes are clustered, while others are not present in the genome. Grey-filled circle: genes are not clustered but are found in the same genomic scaffold or chromosome. Circle with a filled center: indicates the presence of a cluster composed of gene copies with uncertain homology.
Figure 7.
Figure 7.. Comparison of three Platynereis species.
Oxford dotplot comparison of the three Platynereis species genome assemblies. White homologies of most of the scaffolds can be identified, within scaffold inversions are common and present in all species.
Figure 8.
Figure 8.. Bilaterian Ancestral Linkage Group (bALG) fusion-with-mixing events towards and within Errantia.
A, potential linkage group evolutionary patterns described in animals. B, example annotation of bALGs and fusion-with-mixing (FWM) events detected in scaffolds or annotated chromosomes of C.gigas and P. dumerilii (this study). C, mapping of FWM events detected in this study onto the most up-to-date annelid-mollusc tree. Highlighted are the FWM events detected in annelid species belonging to specific groups within Sedentaria (orange) and Errantia (pink).

References

    1. Alves P. R., Halanych K. M., & Santos C. S. G. (2020). The phylogeny of Nereididae (Annelida) based on mitochondrial genomes. Zoologica Scripta, 49(3), 366–378. 10.1111/zsc.12413 - DOI
    1. AMBROS V., BARTEL B., BARTEL D. P., BURGE C. B., CARRINGTON J. C., CHEN X., DREYFUSS G., EDDY S. R., GRIFFITHS-JONES S., MARSHALL M., MATZKE M., RUVKUN G., & TUSCHL T. (2003). A uniform system for microRNA annotation. RNA, 9(3), 277–279. 10.1261/rna.2183803 - DOI - PMC - PubMed
    1. Audouin J. V., & Milne Edwards H. (1833). [Part 3.] Classification des Annélides et description de celles qui habitent les côtes de la France. Annales Des Sciences Naturelles, Paris. https://biodiversitylibrary.org/page/6044727
    1. Bartel D. P. (2018). Metazoan MicroRNAs. Cell, 173(1), 20–51. 10.1016/j.cell.2018.03.006 - DOI - PMC - PubMed
    1. BASKERVILLE S., & BARTEL D. P. (2005). Microarray profiling of microRNAs reveals frequent coexpression with neighboring miRNAs and host genes. RNA, 11(3), 241–247. 10.1261/rna.7240905 - DOI - PMC - PubMed

Publication types