. 2024 Jul 1;134(13):e175560.
doi: 10.1172/JCI175560.

Primary cilia formation requires the Leigh syndrome-associated mitochondrial protein NDUFAF2

Affiliations

Primary cilia formation requires the Leigh syndrome-associated mitochondrial protein NDUFAF2

Chien-Hui Lo et al. J Clin Invest. .

Abstract

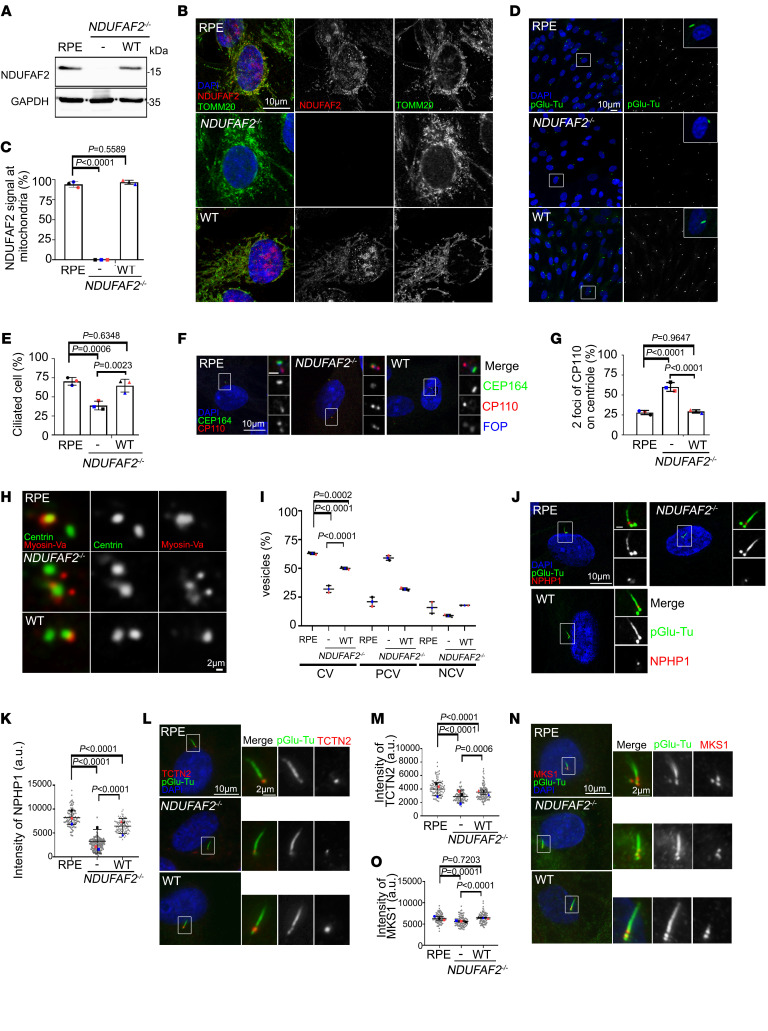
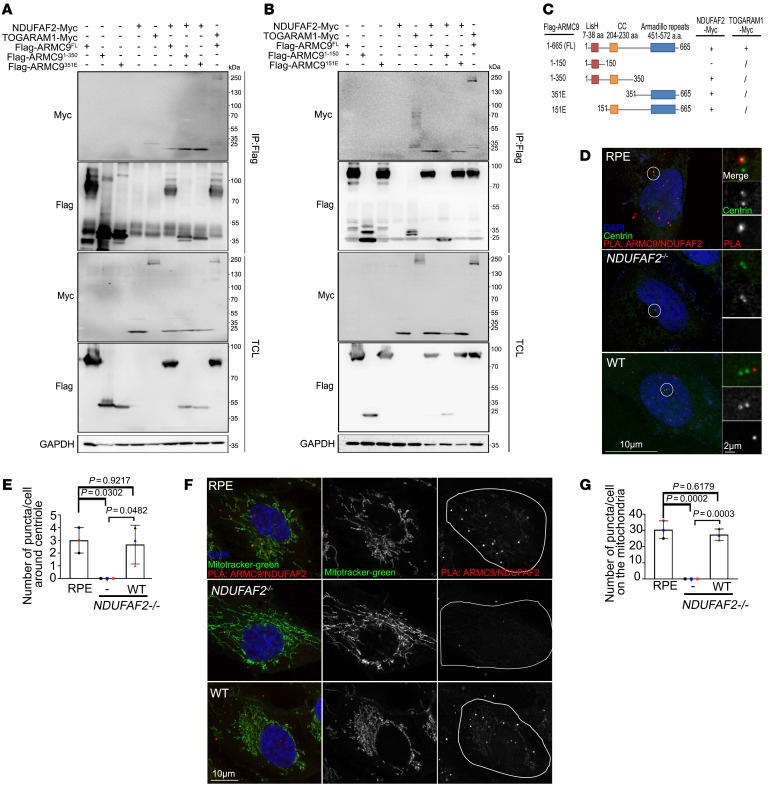
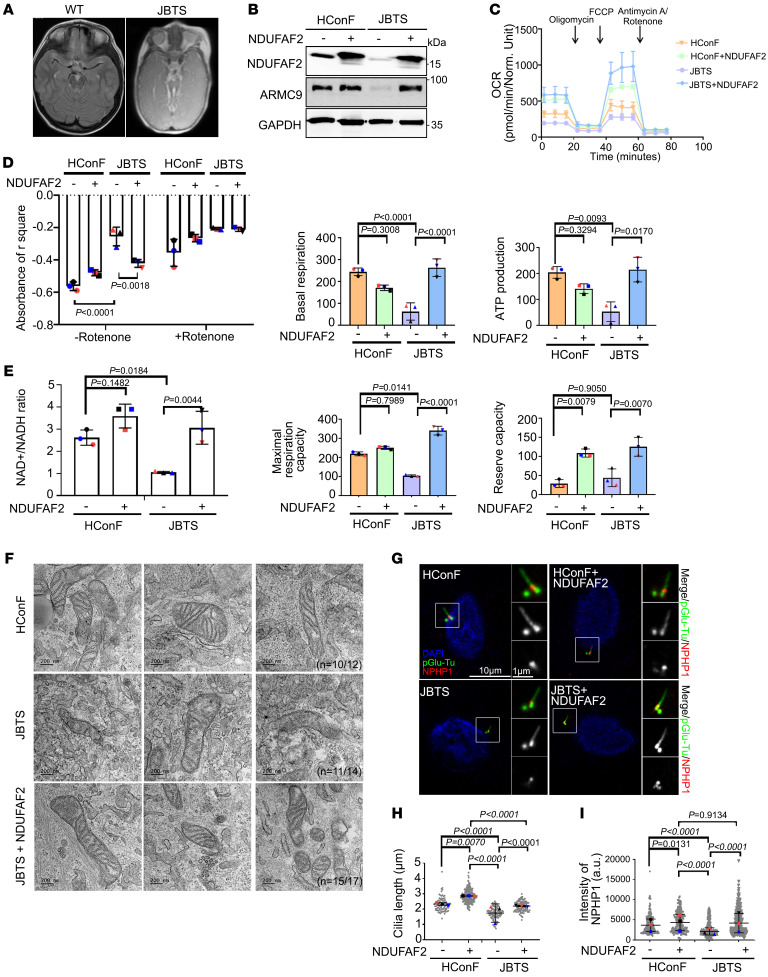
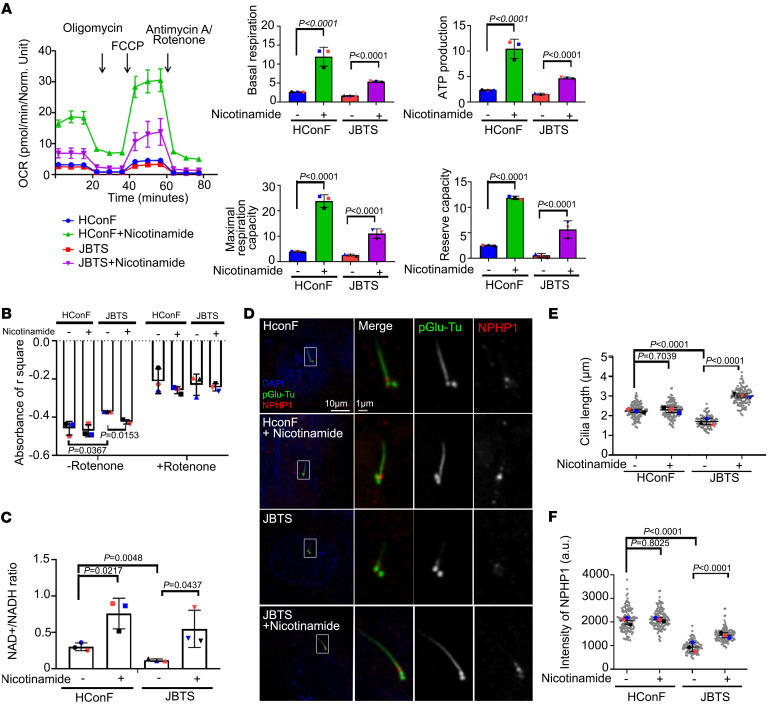
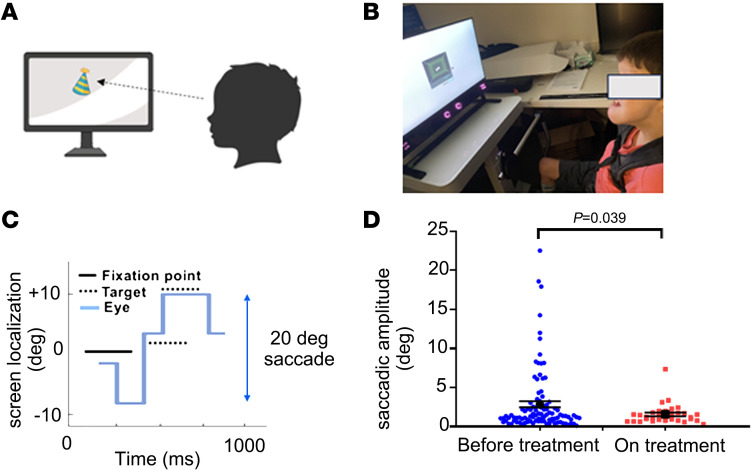
Mitochondria-related neurodegenerative diseases have been implicated in the disruption of primary cilia function. Mutation in an intrinsic mitochondrial complex I component NDUFAF2 has been identified in Leigh syndrome, a severe inherited mitochondriopathy. Mutations in ARMC9, which encodes a basal body protein, cause Joubert syndrome, a ciliopathy with defects in the brain, kidney, and eye. Here, we report a mechanistic link between mitochondria metabolism and primary cilia signaling. We discovered that loss of NDUFAF2 caused both mitochondrial and ciliary defects in vitro and in vivo and identified NDUFAF2 as a binding partner for ARMC9. We also found that NDUFAF2 was both necessary and sufficient for cilia formation and that exogenous expression of NDUFAF2 rescued the ciliary and mitochondrial defects observed in cells from patients with known ARMC9 deficiency. NAD+ supplementation restored mitochondrial and ciliary dysfunction in ARMC9-deficient cells and zebrafish and ameliorated the ocular motility and motor deficits of a patient with ARMC9 deficiency. The present results provide a compelling mechanistic link, supported by evidence from human studies, between primary cilia and mitochondrial signaling. Importantly, our findings have significant implications for the development of therapeutic approaches targeting ciliopathies.

Keywords: Cell biology; Neurodegeneration; Neurological disorders; Ophthalmology; Retinopathy.


Conflict of interest statement

Conflict of interest: YS and CHL have the following patent: “Novel treatments of ciliopathies” (patent application 63/579,94).

Figures

Figure 1
Figure 1. Loss of NDUFAF2 in RPE cells results in primary cilia defects.
(A) NDUFAF2WT was stably expressed in NDUFAF2–/– cells. Western blot analysis was performed with antibodies against NDUFAF2 and GAPDH. (B) Cells stained with TOMM20 (green) and NDUFAF2 (red) antibodies. DNA stained with DAPI (blue). Scale bar: 10 μm. (C) NDUFAF2 staining of mitochondria in wild-type, NDUFAF2–/–, and NDUFAF2WT-re-expressing RPE1 cells. (D) Cells stained with polyglutamylated tubulin (green) antibodies. DNA stained with DAPI (blue). Scale bar: 10 μm. (E) Percentage of ciliated cells after serum starving for 2 days; >150 cells analyzed for each independent experiment. (F) Immunofluorescent analysis of cells serum-starved for 2 days. Cells stained with CP110 (red), CEP164 (green), and FOP (FGFR1 oncogene partner; blue) antibodies. DNA stained with DAPI (blue). Scale bars: 10 μm. (G) Graph shows percentage of serum-starved cells with two CP110 dots at the centrioles; >150 cells analyzed for each independent experiment. (H) Immunofluorescent analysis of cells serum-starved for 6 hours. Cells were stained with myosin-Va (red) and centrin (green) antibodies. DNA stained with DAPI (blue). Scale bar: 2 μm. (I) Percentage of cells with ciliary vesicles demonstrated by an antibody against myosin-Va after serum starving for 6 hours (CV, ciliary vesicle; NCV, no ciliary vesicle; PCV, preciliary vesicle); >150 cells analyzed for each independent experiment. (J) Immunostaining of cells serum-starved for 2 days. Scale bars: 10 μm. (K) Quantification of NPHP1 signal intensity at the centrioles; >100 cells analyzed for each independent experiment. (L) Immunofluorescent analysis of cells serum-starved for 2 days. Cells stained with TCTN2 (red) and pGlu-Tu (green) antibodies. DNA stained with DAPI (blue). Scale bars: 10 μm, 2 μm. (M) Quantification of TCTN2 signal intensity at the centrioles; >50 cells analyzed for each independent experiment. (N) Immunofluorescent analysis of cells serum-starved for 2 days. Cells stained with MKS1 (red) and pGlu-Tu (green) antibodies. DNA stained with DAPI (blue). Scale bars: 10 μm, 2 μm. (O) Quantification of MKS1 signal intensity at the centrioles; >50 cells analyzed for each independent experiment. Bars represent mean ± SD, n = 3. Exact P values are indicated. ANOVA followed by Tukey-Kramer multiple-comparison test.
Figure 2
Figure 2. Zebrafish ndufaf2 morpholino–injected mutants exhibit a ciliopathy phenotype.
(A) Protein levels of control morpholino (MO)–injected, ndufaf2 morpholino–injected, and p53 morpholino–injected embryos and ndufaf2 morpholino–injected embryos re-expressing NDUFAF2WT. Western blot analysis was performed with antibodies against NDUFAF2 and GAPDH. (B) Transmitted light images of body shape in control MO–, ndufaf2 morpholino–, and p53 morpholino–injected zebrafish larvae and ndufaf2 morpholino–injected zebrafish larvae re-expressing NDUFAF2WT, at 5 days post-fertilization (dpf). (C) Quantification of body curve in control MO–, ndufaf2 morpholino–, and p53 morpholino–injected zebrafish larvae and ndufaf2 morpholino–injected zebrafish larvae re-expressing NDUFAF2WT, at 5 dpf; >30 larvae analyzed for each independent experiment. (D) Transmitted light images of heart in control MO–, ndufaf2 morpholino–, and p53 morpholino–injected zebrafish larvae and ndufaf2 morpholino–injected zebrafish larvae re-expressing NDUFAF2WT, at 5 dpf. Arrows indicate the heart. (E) Quantification of heart failure in control MO–, ndufaf2 morpholino–, and p53 morpholino–injected zebrafish larvae and ndufaf2 morpholino–injected zebrafish larvae re-expressing NDUFAF2WT, at 5 dpf; >30 larvae analyzed for each independent experiment. (F) Confocal images of Kupffer’s vesicle (KV) cells labeled with cilia markers, Arl13b (green) and pGlu-Tu (red), in control MO–, ndufaf2 morpholino–, and p53 morpholino–injected zebrafish larvae and ndufaf2 morpholino–injected zebrafish larvae re-expressing NDUFAF2WT, at 8 somite stage. Scale bar: 20 μm. (G) Quantification of KV cilia number in control MO–, ndufaf2 morpholino–, and p53 morpholino–injected zebrafish larvae and ndufaf2 morpholino–injected zebrafish larvae re-expressing NDUFAF2WT; >30 larvae analyzed for each independent experiment. (H) TEM images of ndufaf2-mutant zebrafish showing shortened and disorganized photoreceptor outer segments at 5 dpf. Representative images of control MO– and ndufaf2 morpholino–injected zebrafish larvae and ndufaf2 morpholino–injected zebrafish larvae re-expressing NDUFAF2WT, at 5 dpf. Boxes show areas of enlarged mitochondria. M,  mitochondria; M*, swollen mitochondria; OS*, shorter  outer segment of photoreceptor. Scale bars: 2 μm. The bars in each graph represent mean ± SD. Exact P values are indicated. ANOVA followed by Tukey-Kramer multiple-comparison test.
Figure 3
Figure 3. ARMC9 interacts with NDUFAF2 via its C-terminal region, and their interaction is required for localization of mitochondria and centrosome.
(A and B) 293T cells transfected with various expression constructs analyzed by immunoprecipitation followed by Western blots with indicated antibodies. (C) Analysis of 293T cells transfected with various expression constructs by immunoprecipitation followed by Western blots. Schematic diagram showing various ARMC9 mutants tagged with FLAG. The ability of each construct to interact with NDUFAF2 is also indicated. CC, mean coiled-coil domain; LisH, mean predicted lissencephaly type 1–like homology motif. (D) Cells were incubated with a centriole marker (centrin, green) and with anti-ARMC9 and anti-NDUFAF2 antibodies and then probed using PLA Minus anti-ARMC9 and Plus anti-NDUFAF2 (red). Scale bars: 10 μm, 2 μm. (E) Quantification of puncta around centrioles in wild-type, NDUFAF2–/–, and NDUFAF2WT-re-expressing RPE1 cells. (F) Cells were incubated with a mitochondrial marker (green) and with anti-ARMC9 and anti-NDUFAF2 antibodies and then probed using PLA (red). Scale bar: 10 μm. (G) Quantification of puncta on mitochondria in wild-type, NDUFAF2–/–, and NDUFAF2WT-re-expressing RPE1 cells. The bars in each graph represent mean ± SD. Exact P values are indicated. ANOVA followed by Tukey-Kramer multiple-comparison test.
Figure 4
Figure 4. NDUFAF2 rescues the mitochondrial defects in Joubert syndrome patient–derived cells.
(A) Brain MRI T1 sequence of a JB patient demonstrating molar tooth sign (MTS) in midbrain. (B) NDUFAF2 is stably expressed in human conjunctival fibroblasts (HConF) and Joubert syndrome patient–derived cells (JBTS), with compound heterozygous mutation in ARMC9. Western blot analysis performed with antibodies against NDUFAF2, ARMC9, and GAPDH. (C) Oxygen consumption rate (OCR) of HConF cells and JBTS cells measured by Seahorse Analyzer. (D) Analysis of mitochondrial complex I activity in HConF cells, JBTS cells, and both cell lines overexpressing NDUFAF2. (E) Analysis of the NAD+/NADH ratio in HConF cells and JBTS cells. (F) TEM images of HConF cells, JBTS cells, and JBTS cells overexpressing NDUFAF2. Eleven JBTS cells display tube-like cristae in stack and onion shapes. The total number of mitochondria in HConF cells, JBTS cells, and JBTS cells overexpressing NDUFAF2 is 12, 14, and 17, respectively. Ten of 12 mitochondria are normal in HConF cells; 11 of 14 mitochondria display onion shapes in JBTS cells; 15 of 17 mitochondria are normal in JBTS cells overexpressing NDUFAF2. Scale bars: 200 nm. (G) Immunostaining of cells serum-starved for 2 days. Scale bars: 10 μm, 1 μm. (H) Quantification of cilia length in HConF cells, JBTS cells, and both cell lines overexpressing NDUFAF2. (I) Quantification of NPHP1 signal intensity at the centrioles; >50 cells analyzed for each independent experiment. The bars in each graph represent mean ± SD. Exact P values are indicated. ANOVA followed by Tukey-Kramer multiple-comparison test.
Figure 5
Figure 5. NAD+ supplementation rescues defective ciliogenesis in JBTS patient-derived cells.
(A) OCR measured by Seahorse Analyzer of HConF cells and JBTS cells with or without nicotinamide treatment. (B) Analysis of mitochondrial complex I activity in HConF cells, JBTS cells, and both cell lines overexpressing NDUFAF2. (C) Analysis of the NAD+/NADH ratio in HConF cells and JBTS cells. (D) Immunostaining of cells serum-starved for 2 days. Scale bars: 10 μm, 1 μm. (E) Quantification of cilia length in HConF cells and JBTS cells treated with nicotinamide; >50 cells analyzed for each independent experiment. (F) Quantification of NPHP1 signal intensity at the centrioles; >100 cells analyzed for each independent experiment. The bars in each graph represent mean ± SD. Exact P values are indicated. ANOVA followed by Tukey-Kramer multiple-comparison test.
Figure 6
Figure 6. Improvement in saccadic amplitude in Joubert syndrome patient upon nicotinamide supplementation.
(A) Schematic of eye tracking design. (B) Joubert syndrome patient undergoing examination. (C) Representative image of target, fixation point, and eye positions for eye tracking exam. (D) Saccadic amplitude and SEM for the last 2 sessions (101 trials) before and on treatment with nicotinamide (oral 250 mg daily for 2 months) (8,707 saccades, before-treatment group, vs. 3,359 saccades, on-treatment group). Exact P values are indicated. One-tailed Student’s t test.

References

    1. Wang WJ, et al. De novo centriole formation in human cells is error-prone and does not require SAS-6 self-assembly. Elife. 2015;4:e10586. doi: 10.7554/eLife.10586. - DOI - PMC - PubMed
    1. Izquierdo D, et al. Stabilization of cartwheel-less centrioles for duplication requires CEP295-mediated centriole-to-centrosome conversion. Cell Rep. 2014;8(4):957–965. doi: 10.1016/j.celrep.2014.07.022. - DOI - PMC - PubMed
    1. Bisgrove BW, Yost HJ. The roles of cilia in developmental disorders and disease. Development. 2006;133(21):4131–4143. doi: 10.1242/dev.02595. - DOI - PubMed
    1. Gerdes J. The vertebrate primary cilium in development, homeostasis, and disease. Cell. 2009;137(1):32–45. doi: 10.1016/j.cell.2009.03.023. - DOI - PMC - PubMed
    1. Vincensini L, et al. 1001 model organisms to study cilia and flagella. Biol Cell. 2011;103(3):109–130. doi: 10.1042/BC20100104. - DOI - PubMed

MeSH terms

Supplementary concepts