. 2024 Sep 2;223(9):e202311126.
doi: 10.1083/jcb.202311126. Epub 2024 Jul 1.

A fluorogenic complementation tool kit for interrogating lipid droplet-organelle interaction

Affiliations

A fluorogenic complementation tool kit for interrogating lipid droplet-organelle interaction

Xiao Li et al. J Cell Biol. .

Abstract

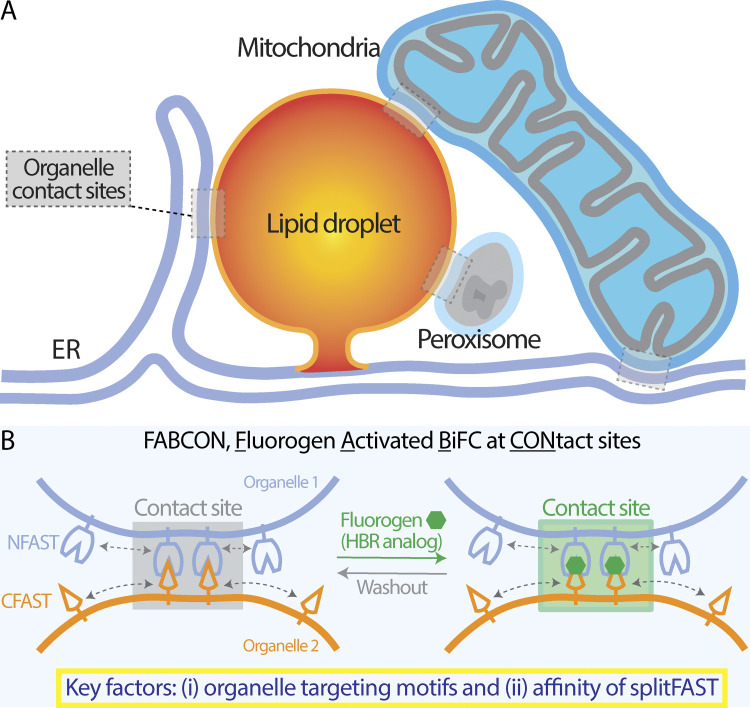
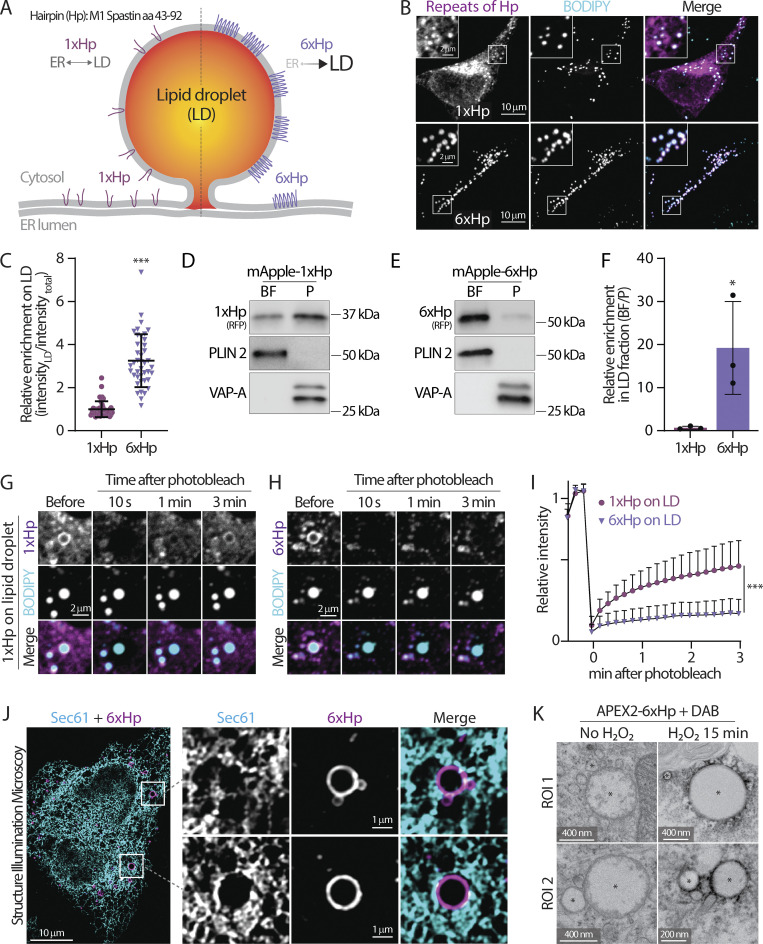
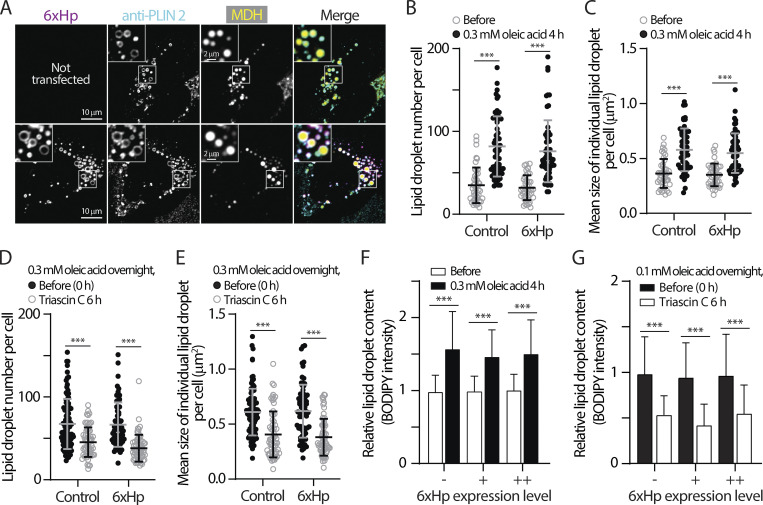
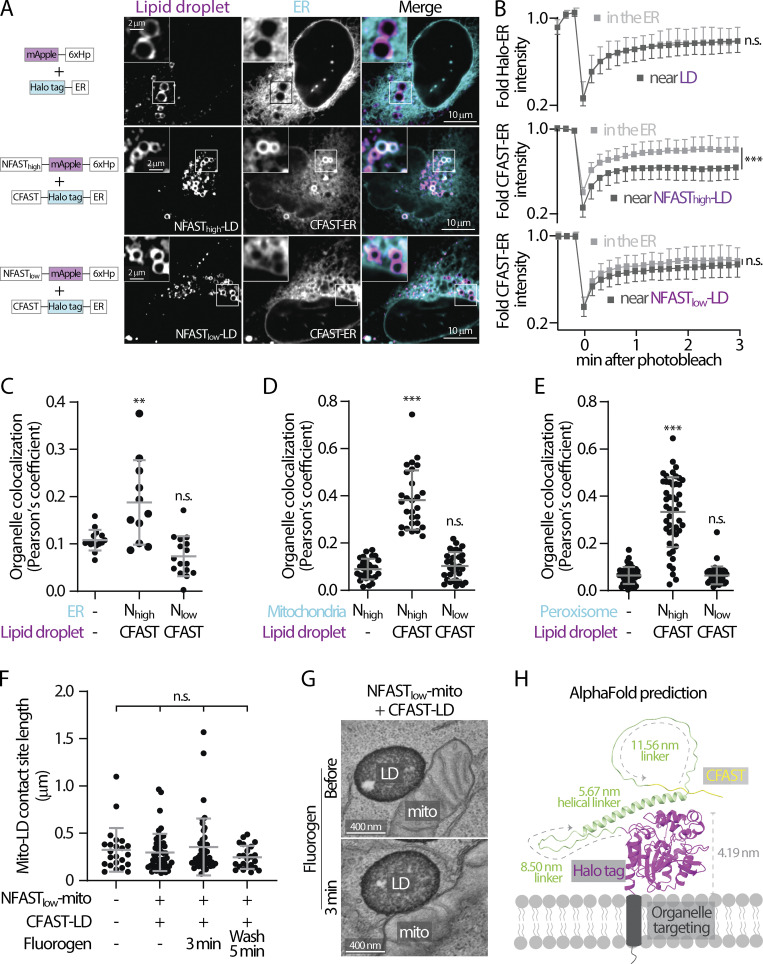
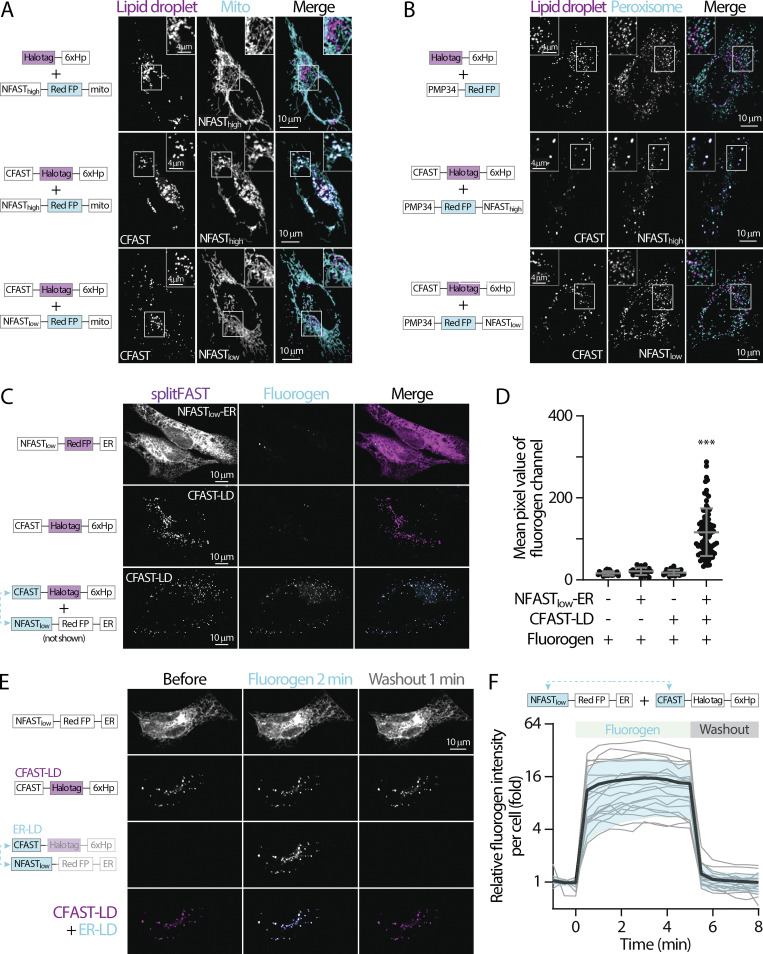
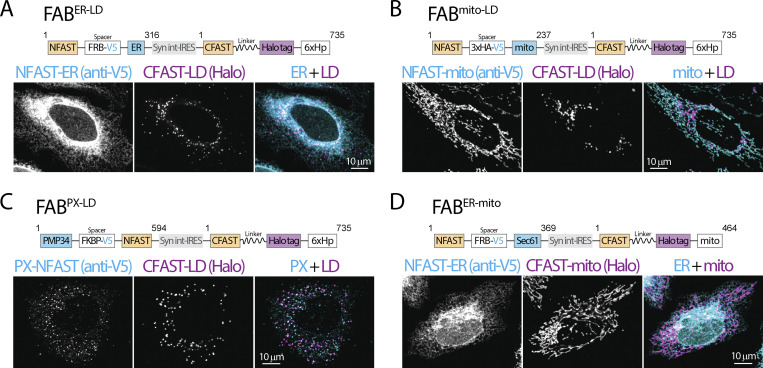
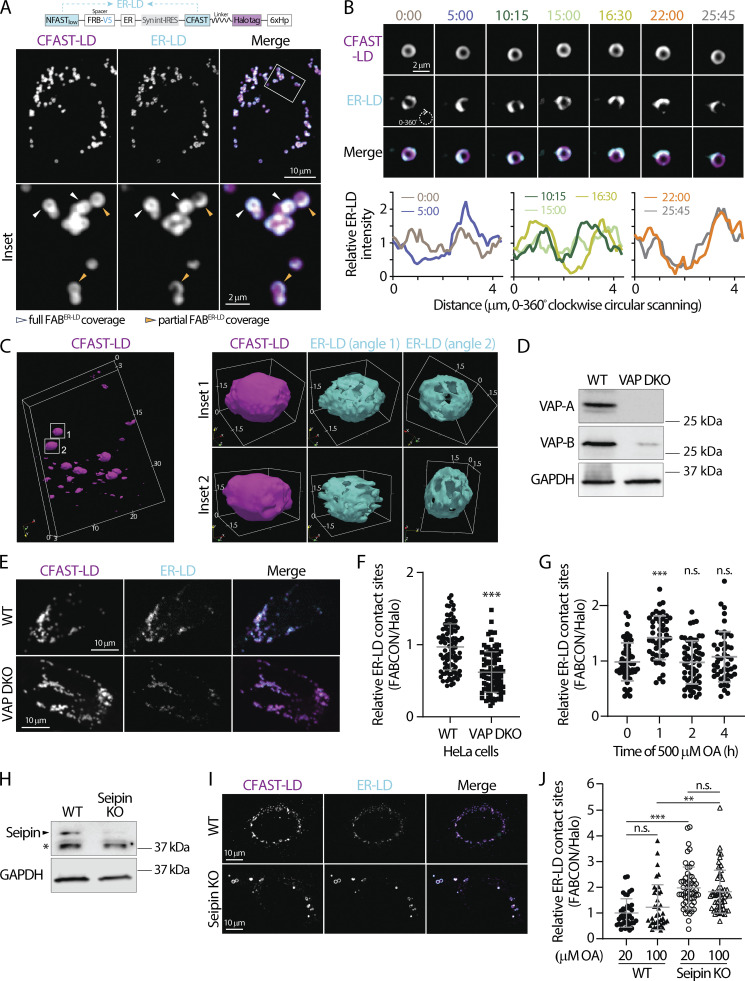
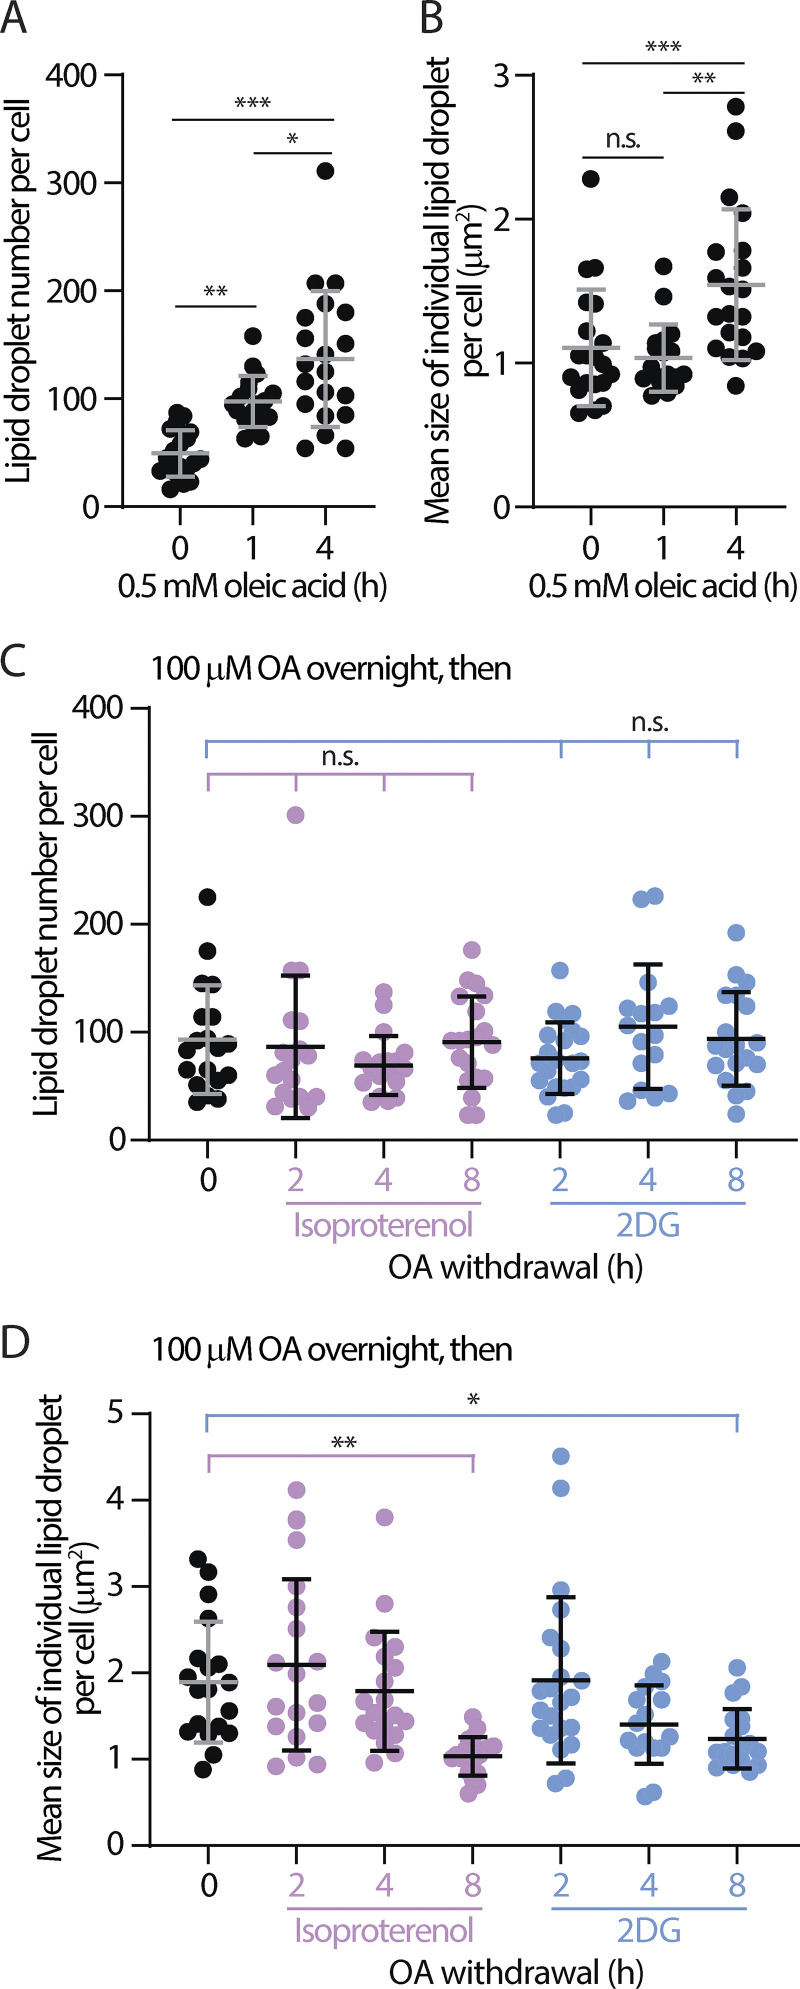
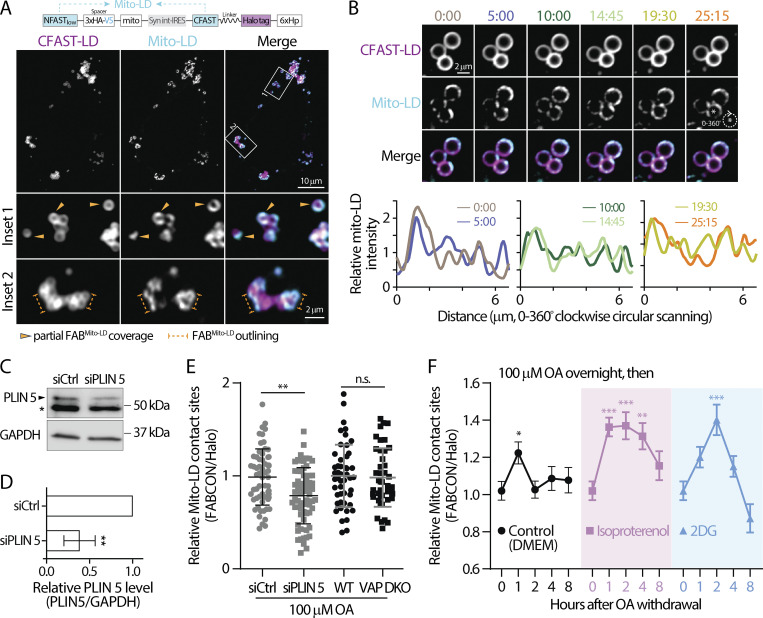
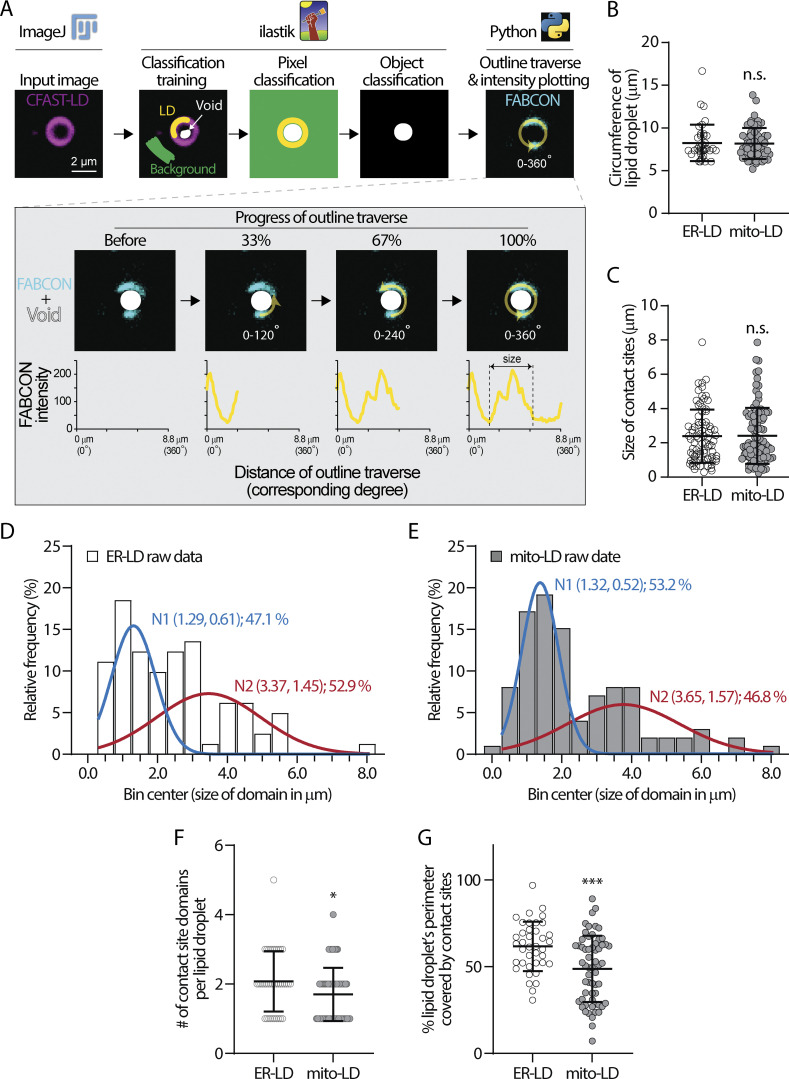
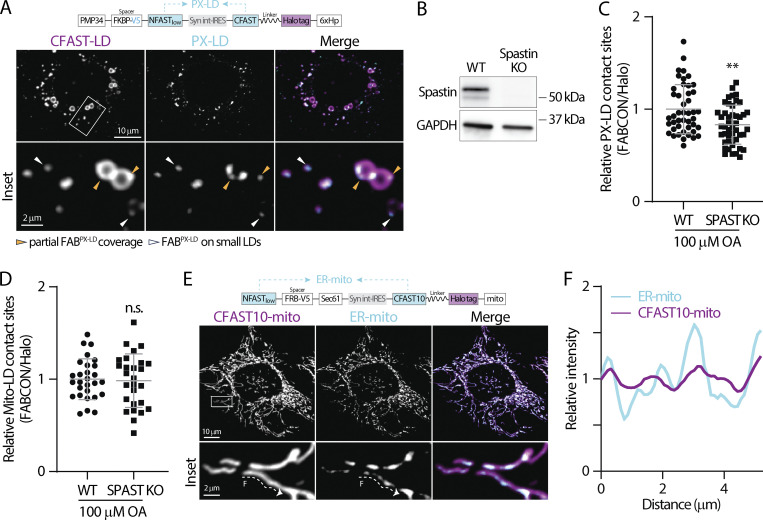
Contact sites between lipid droplets and other organelles are essential for cellular lipid and energy homeostasis upon metabolic demands. Detection of these contact sites at the nanometer scale over time in living cells is challenging. We developed a tool kit for detecting contact sites based on fluorogen-activated bimolecular complementation at CONtact sites, FABCON, using a reversible, low-affinity split fluorescent protein, splitFAST. FABCON labels contact sites with minimal perturbation to organelle interaction. Via FABCON, we quantitatively demonstrated that endoplasmic reticulum (ER)- and mitochondria (mito)-lipid droplet contact sites are dynamic foci in distinct metabolic conditions, such as during lipid droplet biogenesis and consumption. An automated analysis pipeline further classified individual contact sites into distinct subgroups based on size, likely reflecting differential regulation and function. Moreover, FABCON is generalizable to visualize a repertoire of organelle contact sites including ER-mito. Altogether, FABCON reveals insights into the dynamic regulation of lipid droplet-organelle contact sites and generates new hypotheses for further mechanistical interrogation during metabolic regulation.


Conflict of interest statement

Disclosures: All authors have completed and submitted the ICMJE Form for Disclosure of Potential Conflicts of Interest. A. Tebo reported a patent to US20220169682A1 pending. No other disclosures were reported.

Figures

Figure 1.
Figure 1.
Visualization of lipid droplet-organelle contact sites using splitFAST-based FABCON. (A) Organelle contact sites between the endoplasmic reticulum (ER) and lipid droplets (LDs), mitochondria and LDs, peroxisome and LDs, and ER and mitochondria. (B) Diagram depicting the implementation of FABCON using a reversible split reporter (splitFAST) and fluorogenic hydroxybenzylidene rhodanine (HBR) analog for detecting organelle contact sites.
Figure 2.
Figure 2.
The design and validation of a synthetic lipid droplet targeting motif. (A) Diagram depicting the ER and lipid droplet (LD) distribution of 1xHp (hairpin; amino acids 43–92 from human M1 Spastin) and 6xHp. (B) Localization of BODIPY 493/503-labeled LDs and mApple-1xHp or mApple-6xHp in HeLa cells treated with 100 µM oleic acid (OA) overnight. Maximal intensity projected (MIP) confocal images from six axial slices (1.8 µm in total thickness) are shown. (C) Quantification of relative enrichment of 1xHp and 6xHp on LDs from B. Raw data and mean ± SD are shown (53–56 cells from three independent experiments). ***P ≤ 0.001, assessed by two-tailed t test. (D and E) Distribution of mApple-1xHp or mApple-6xHp, LD marker perilipin 2 (PLIN 2), and an ER membrane marker, VAP-A, in sucrose-gradient cellular fractionations from HepG2 cells treated with 200 μM OA. BF, buoyant fraction; P, membrane pellet. (F) Quantification of the enrichment of mApple-1xHp or mApple-6xHp in the BF relative to the P fraction in D and E. Data are from three independent experiments (*P ≤ 0.05, assessed by two-tailed t test). (G and H) Fluorescence recovery after photobleaching (FRAP) of 1xHp (G) and 6xHp (H) on LDs in OA-treated U2OS cells labeled with BODIPY monitored by confocal microscopy. (I) Quantification of FRAP of G and H. Mean ± SD are shown (22–37 cells from three or four independent experiments). ***P ≤ 0.001, assessed by two-tailed t test. (J) Subcellular localization of Halo-6xHp relative to ER marker mEmerald-Sec61β in an OA-treated HeLa cell monitored via structured illumination microscopy. MIP images from 10 axial slices (∼2 µm in total thickness) are shown. (K) Electron micrographs of LDs in U2OS cells expressing APEX2-6xHp incubated with diaminobenzidine (DAB) in the absence or presence of H2O2. * indicates representative LDs. Source data are available for this figure: SourceData F2.
Figure 3.
Figure 3.
Minimal perturbation of 6xHp on lipid droplets’ properties. (A) Colocalization of Halo-6xHp and endogenous lipid droplet (LD) protein periplipin 2 (PLIN 2) in an oleic acid (OA)-treated U2OS cell stained with MDH (LD marker) monitored by confocal microscopy. Representative images from a single axial plane (0.3 µm) are shown. (B and C) Number and size of LDs in control HeLa cells or in cells overexpressing Halo-6xHp before and after 0.3 mM OA treatment for 4 h. Mean ± SD are shown (43–59 cells from three or four independent experiments). ***P ≤ 0.001, assessed by one-way ANOVA. (D and E) Number and size of LDs in OA-loaded HeLa cells with or without Halo-6xHp overexpression before and after 10 µM Triacsin C treatment for 6 h. Mean ± SD are shown (62–96 cells from three or four independent experiments). ***P ≤ 0.001, assessed by one-way ANOVA. (F) Relative LD content in HeLa cells overexpressing Halo-6xHp under control conditions or treated with 0.3 mM OA for 4 h. Mean ± SD are shown (98–217 cells from three independent experiments). “−” indicates absence of 6xHp expression. “+” and “++” indicate low and moderate expression of 6xHp, respectively. ***P ≤ 0.001, assessed by one-way ANOVA. (G) Relative LD content in OA-loaded HeLa cells overexpressing Halo-6xHp under control conditions or incubated with 10 µM Triacsin C for 6 h. Mean ± SD is shown (169–499 cells from three independent experiments). “−” indicates absence of 6xHp expression. “+” and “++” indicate low and moderate expression of 6xHp, respectively. ***P ≤ 0.001, assessed by one-way ANOVA.
Figure 4.
Figure 4.
Low affinity splitFAST is suitable for implementing FABCON. (A) Distribution of mApple-6xHp and Halo-ER (top), NFASThigh-mApple-6xHp and CFAST-Halo-ER (middle), and NFASTlow-mApple-6xHp and CFAST-Halo-ER (bottom) in an oleic acid (OA)-treated U2OS cell. Representative images from a single axial plane are shown. (B) Quantification of fluorescence recovery after photobleaching of Halo-ER in the endoplasmic reticulum (ER) and near lipid droplets (LDs); or CFAST-Halo-ER in the ER and near NFASThigh- or NFASTlow-decorated LDs. Mean ± SD is shown (20–25 regions from three independent experiments). n.s. = not significant, ***P ≤ 0.001, unpaired t test, two-tailed. (C) Quantification of the Pearson’s colocalization coefficient of LDs and ER described in A. Raw data and mean ± SD are shown (11–16 cells from three independent experiments). **P ≤ 0.01, assessed by one-way ANOVA. (D) Quantification of the Pearson’s colocalization coefficient of LDs and mitochondria (mito) in cells expressing Halo-6xHp and NFASThigh-mApple-mito, CFAST-Halo-6xHp and NFASThigh-mApple-mito, or CFAST-Halo-6xHp and NFASTlow-mApple-mito (see Fig. S1 A). Raw data and mean ± SD are shown (29–32 cells from three independent experiments). ***P ≤ 0.001, assessed by one-way ANOVA. (E) Quantification of the Pearson’s colocalization coefficient of LDs and peroxisomes described in cells producing Halo-6xHp and PMP34-mApple, CFAST-Halo-6xHp and PMP34-mApple-NFASThigh, or CFAST-Halo-6xHp and PMP34-mApple-NFASTlow (see Fig. S1 B). Raw data and mean ± SD are shown (44–51 cells from three independent experiments). ***P ≤ 0.001, assessed by one-way ANOVA. (F) Quantification of the length of mito-LD contact sites detected by scanning transmission electron microscopy (STEM) in control HeLa cells or cells expressing FABmito-LD in the absence, 3 min after the addition, and 5 min after the washout of 3 µM HBR-2,5DOM. Raw data and mean ± SD are shown (n = 23 in control; n = 50 in Nlow+CFAST without dye; n = 43 in Nlow+CFAST with dye; n = 23 in Nlow+CFAST after washout). n.s. = not significant, assessed by one-way ANOVA. (G) Representative electron micrographs of mito-LD contact sites detected by STEM in HeLa cells expressing FABmito-LD in the absence and presence of 3 µM HBR-2,5DOM for 3 min. (H) AlphaFold structure prediction of CFAST-linker-Halo displayed on a membrane bilayer. The size of Halo tag and length of flexible and helical linkers are indicated.
Figure S1.
Figure S1.
splitFAST remains reversible at organelle contact sites without detectable fluorescence leakiness. (A) Distribution of lipid droplets (LDs) and mitochondria (mito) in oleic acid (OA)-treated HeLa cells overexpressing Halo-6xHp and NFASThigh-mApple-mito, CFAST-Halo-6xHp and NFASThigh-mApple-mito, or CFAST-Halo-6xHp and NFASTlow-mApple-mito monitored using confocal microscopy. Maximal intensity projected images from six axial slices (1.8 µm in total thickness) are shown. (B) Distribution of LDs and peroxisomes in OA-treated HeLa cells overexpressing Halo-6xHp and PMP34-mApple, CFAST-Halo-6xHp and PMP34-mApple-NFASThigh, or CFAST-Halo-6xHp and PMP34-mApple-NFASTlow. (C) Confocal images of HeLa cells expressing NFASTlow-mApple-ER (top), CFAST-Halo-6xHp (middle), and NFASTlow-mApple-ER plus CFAST-Halo-6xHp (bottom) in the presence of HBR-2,5DOM. (D) Quantification of fluorogen intensity of C and in control HeLa cells. Raw data and mean ± SD are shown (22–82 cells). ***P ≤ 0.001, assessed by one-way ANOVA. (E) Distribution NFASTlow-mApple-ER, CFAST-Halo-6xHp, and endoplasmic reticulum (ER)-LD contact site labeled in Hela cells in the absence, 2 min after the addition, and 1 min after the washout of HBR-2,5DOM. (F) Relative fluorogen intensity described in E following HBR-2,5DOM addition and washout monitored by confocal microscopy. Raw data (gray traces) and mean (bold black trace) ± SD (shaded blue) are shown (19 or 20 cells).
Figure S2.
Figure S2.
Diagram and validation of FABCON lentiviruses. (A–D) Diagram (top) and organelle distribution of cognate FABCON halves (bottom) of FABER-LD (A), FABmito-LD (B), FABPX-LD (C), and FABER-mito (D) monitored by confocal microscopy. NFAST fused organelle marker were immunostained with anti-V5 antibody. Maximal intensity projected images from three axial slices (∼1 µm in total thickness) are shown. Numbers of amino acids are indicated. Syn int-IRES, synthetic intron-internal ribosome entry site.
Figure 5.
Figure 5.
Dynamic regulation of ER-LD contact sites revealed via FABER-LD. (A) Detection of lipid droplets (LDs) and endoplasmic reticulum (ER)-LD contact sites in oleic acid (OA)-treated HeLa cells producing FABER-LD (top) monitored by confocal microscopy. Representative maximal intensity projected images from three axial slices (∼1 µm in total thickness) are shown in bottom panels. (B) Dynamics of ER-LD contact sites on an LD in OA-treated U2OS cell producing FABER-LD monitored by confocal microscopy over time (top). Relative intensity profiles of ER-LD contact sites measured by clockwise circular scanning are shown in bottom panels. (C) 3D rendering of LDs and ER-LD contact site in U2OS cells imaged via LLSM. LDs labeled by CFAST-LD from a whole cell are shown on the left. Box volume is 24.6 × 16.8 × 2.67 µm. Two individual LDs and their ER-LD contact sites are shown on the right. Box volumes are 3.10 × 2.35 × 2.52 µm (top row) and 3.28 × 2.40 × 2.82 µm (bottom row). Numbers indicate distance (µm). (D) Protein levels of VAP-A and VAP-B in wild-type (WT) and VAP double knockout (DKO) HeLa cells detected by Western blot. (E) ER-LD contact sites in WT and VAP DKO HeLa cells producing FABER-LD monitored by confocal microscope. Representative maximal intensity projected images from three axial slices (∼1 µm in total thickness) are shown. (F) Quantification of the relative levels of ER-LD contact sites in control and VAP DKO HeLa cells. Raw data and mean ± SD are shown (96 cells for each condition from three independent experiments) ***P ≤ 0.001, assessed by two-tailed t test. (G) Relative levels of ER-LD contact sites HeLa cells pulsed with 500 μM of OA over time. Raw data and mean ± SD are shown (47–58 cells from three independent experiments). n.s. = not significant, ***P ≤ 0.001, assessed by one-way ANOVA and Dunnett’s multiple comparisons test with 0 h as the control group. (H) Protein level of Seipin in WT and Seipin KO SUM159 cells detected by Western blot. * indicates non-specific band of detection. (I) ER-LD contact sites in oleic acid (OA)-treated WT and Seipin KO SUM159 cells producing FABER-LD monitored using confocal microscopy. Representative maximal intensity projected images from three axial slices (∼1 µm in total thickness) are shown. (J) Relative levels of ER-LD contact sites in WT and Seipin KO SUM159 cells producing FABER-LD and treated with 20 or 100 µM OA overnight. Raw data and mean ± SD are shown (37–55 cells from four independent experiments). n.s. = not significant, ***P ≤ 0.001, assessed by one-way ANOVA. Source data are available for this figure: SourceData F5.
Figure S3.
Figure S3.
Number and size of LDs following oleic acid (OA) addition and withdrawal. (A and B) Quantification of lipid droplet (LD) number (A) and size (B) in HeLa cells pulsed with 500 μM of OA over time. Raw data and mean ± SD are shown (18–20 cells from three independent experiments). *P ≤ 0.05, **P ≤ 0.01, ***P ≤ 0.001, assessed by one-way ANOVA and Tukey’s multiple comparisons test. (C and D) Number (C) and size (D) of LDs in OA-treated HeLa cells following OA withdrawal in DMEM and in DMEM with 10 µM of isoproterenol or 4 mM 2DG. Mean ± SD is shown (16–22 cells from three independent experiments). Statistical significance was compared to time zero. n.s. = not significant, *P ≤ 0.05, **P ≤ 0.01, assessed by one-way ANOVA and Tukey’s multiple comparisons test.
Figure 6.
Figure 6.
Dynamic regulation of mito-LD contact sites revealed via FABmito-LD. (A) Detection of lipid droplets (LDs) and mitochondria (mito)-LD contact sites in oleic acid (OA)-treated HeLa cells producing FABmito-LD (top) monitored via confocal microscopy. Representative maximal intensity projected images from two axial slices (0.6 µm in total thickness) are shown in bottom panels. (B) Dynamics of mito-LD contact sites on a LD in OA-treated U2OS cell producing FABmito-LD monitored by confocal microscopy over time (top). Relative intensity profiles of mito-LD measured by clockwise circular scanning are shown in the bottom panels. (C) Perilipin 5 (PLIN 5) levels in HeLa cells transfected with scramble (siCtrl) or PLIN 5 siRNA detected by Western blot. * indicates non-specific band. (D) Quantification of relative PLIN 5 level described in C. Data are from three independent experiments (**P ≤ 0.01, unpaired t test, two-tailed). (E) Relative levels of mito-LD contact sites in OA-treated HeLa cells transfected with scramble or PLIN 5 siRNA. Raw data and mean ± SD are shown (61–63 cells from three independent experiments). n.s. = not significant, **P ≤ 0.01, assessed by two-tailed t test. (F) The temporal dynamics of mito-LD contact sites in OA-treated HeLa cells following OA withdrawal in DMEM and in DMEM with 10 µM of isoproterenol or 4 mM 2DG. Mean ± SE are shown (37–58 cells from three or four independent experiments). Statistical significance was compared to time zero by one-way ANOVA. **P ≤ 0.01; ***P ≤ 0.001. Source data are available for this figure: SourceData F6.
Figure 7.
Figure 7.
COSIMA analysis of ER-LD and mito-LD contact sites. (A) A flowchart describing the COSIMA pipeline. (B) Circumference of lipid droplets (LDs) analyzed by COSIMA in the endoplasmic reticulum (ER)-LD and mitochondria (mito)-LD group. Raw data and mean ± SD are shown (39–60 LDs). n.s. = not significant, assessed by two-tailed t test. (C) Size of ER-LD and mito-LD contact sites measured by COSIMA. Raw data and mean ± SD are shown (81–99 contact sites). n.s. = not significant, assessed by two-tailed t test. (D and E) Population distribution of domain size of ER-LD (D) and mito-LD (E) contact sites. Bar graphs show raw data and traces represent fitted bi-modal Gaussian distributions (N). Each N is shown as (mean, SD); % of raw data. (F) Number of ER-LD and mito-LD contact sites on each LD. Raw data and mean ± SD are shown (39–60 LDs). *P ≤ 0.05, assessed by two-tailed t test. (G) Fraction of LD’s perimeter covered by ER-LD and mito-LD contact sites. Raw data and mean ± SD are shown (39–60 LDs). ***P ≤ 0.001, assessed by two-tailed t test.
Figure 8.
Figure 8.
Detection of PX-LD and ER-mito contact sites using FABCON. (A) Detection of lipid droplets (LDs) and peroxisome (PX)-LD contact sites in oleic acid (OA)-treated U2OS cells producing FABPX-LD (top) monitored via confocal microscopy. Representative maximal intensity projected (MIP) images from three axial slices (∼1 µm in total thickness) are shown. (B) Spastin (SPAST) protein levels from wild-type (WT) and SPAST knockout (KO) U2OS cells detected by Western blot. (C) Relative levels of PX-LD contact sites in WT and SPAST KO U2OS cells. Raw data and mean ± SD are shown (45 cells for each condition from three independent experiments, **P ≤ 0.01, unpaired t test, two-tailed). (D) Relative levels of mitochondria (mito)-LD contact sites in WT and SPAST KO U2OS cells. Raw data and mean ± SD are shown (26–24 cells from three independent experiments, n.s. = not significant, unpaired t test, two-tailed). (E) Detection of endoplasmic reticulum (ER)-mito contact sites in HeLa cells producing FABER-mito (top) monitored by confocal microscopy. Representative MIP images from three axial slices (∼1 µm in total thickness) are shown. (F) Intensity profiles of CFAST10-mito and ER-mito from the dashed line in E. Source data are available for this figure: SourceData F8.

Update of

Similar articles

Cited by

References

    1. Abrisch, R.G., Gumbin S.C., Wisniewski B.T., Lackner L.L., and Voeltz G.K.. 2020. Fission and fusion machineries converge at ER contact sites to regulate mitochondrial morphology. J. Cell Biol. 219:e201911122. 10.1083/jcb.201911122 - DOI - PMC - PubMed
    1. Alford, S.C., Ding Y., Simmen T., and Campbell R.E.. 2012. Dimerization-dependent green and yellow fluorescent proteins. ACS Synth. Biol. 1:569–575. 10.1021/sb300050j - DOI - PMC - PubMed
    1. Banaszynski, L.A., Liu C.W., and Wandless T.J.. 2005. Characterization of the FKBP.rapamycin.FRB ternary complex. J. Am. Chem. Soc. 127:4715–4721. 10.1021/ja043277y - DOI - PubMed
    1. Bauler, M., Roberts J.K., Wu C.C., Fan B., Ferrara F., Yip B.H., Diao S., Kim Y.I., Moore J., Zhou S., et al. . 2019. Production of lentiviral vectors using suspension cells grown in serum-free media. Mol. Ther. Methods Clin. Dev. 17:58–68. 10.1016/j.omtm.2019.11.011 - DOI - PMC - PubMed
    1. Benedetti, L., Marvin J.S., Falahati H., Guillén-Samander A., Looger L.L., and De Camilli P.. 2020. Optimized Vivid-derived Magnets photodimerizers for subcellular optogenetics in mammalian cells. Elife. 9:e63230. 10.7554/eLife.63230 - DOI - PMC - PubMed

LinkOut - more resources