. 2024 Sep 3;30(17):3881-3893.
doi: 10.1158/1078-0432.CCR-24-0942.

Multiplexed Spatial Profiling of Hodgkin Reed-Sternberg Cell Neighborhoods in Classic Hodgkin Lymphoma

Affiliations

Multiplexed Spatial Profiling of Hodgkin Reed-Sternberg Cell Neighborhoods in Classic Hodgkin Lymphoma

Maryam Pourmaleki et al. Clin Cancer Res. .

Abstract

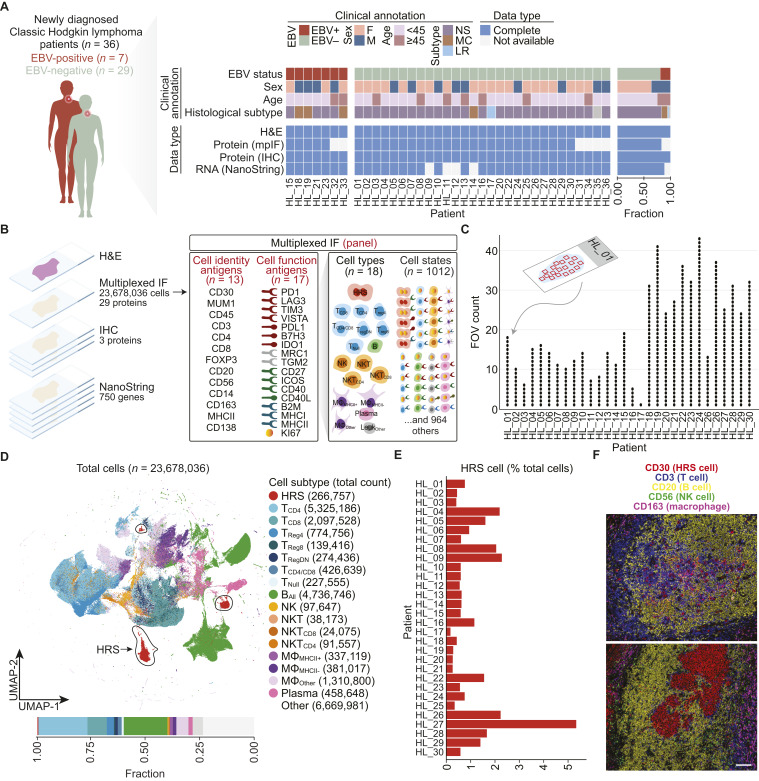
Purpose: Classic Hodgkin lymphoma (cHL) is a B-cell lymphoma that occurs primarily in young adults and, less frequently, in elderly individuals. A hallmark of cHL is the exceptional scarcity (1%-5%) of the malignant Hodgkin Reed-Sternberg (HRS) cells within a network of nonmalignant immune cells. Molecular determinants governing the relationship between HRS cells and their proximal microenvironment remain largely unknown.

Experimental design: We performed spatially resolved multiplexed protein imaging and transcriptomic sequencing to characterize HRS cell states, cellular neighborhoods, and gene expression signatures of 23.6 million cells from 36 newly diagnosed Epstein-Barr virus (EBV)-positive and EBV-negative cHL tumors.

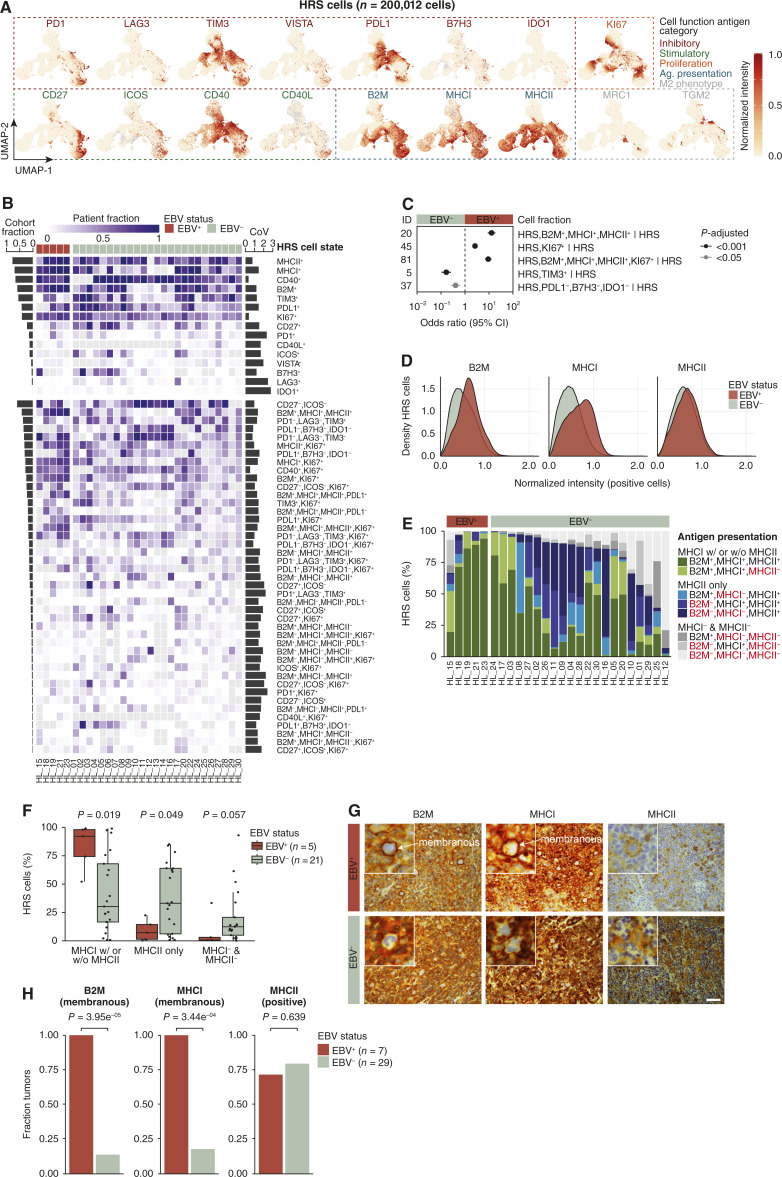
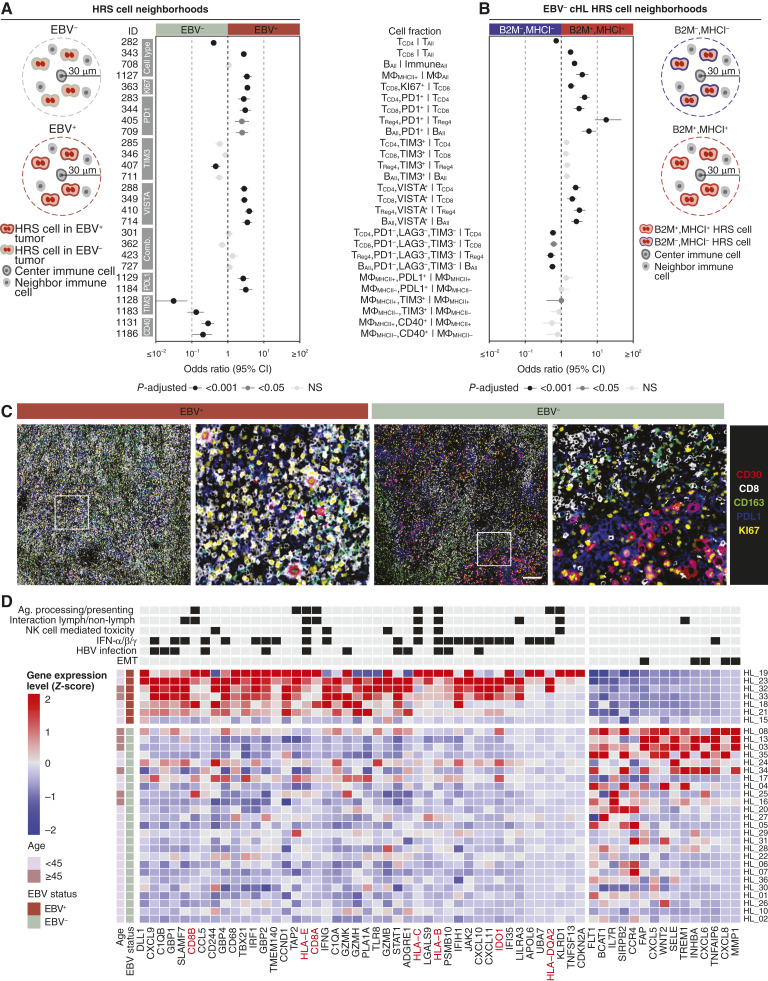
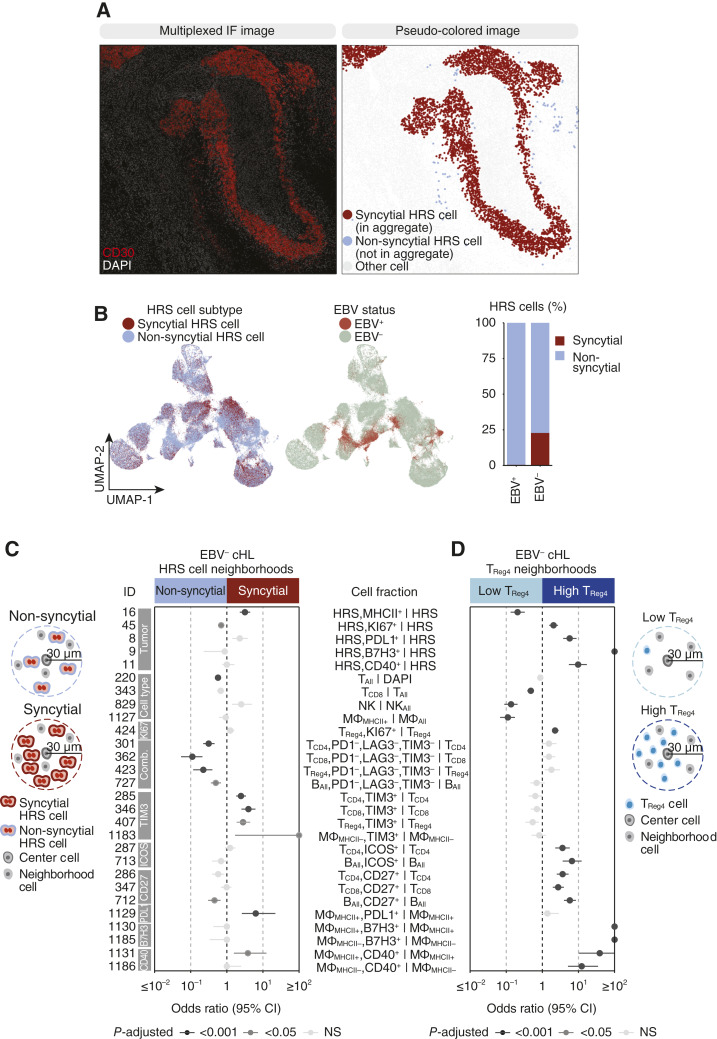
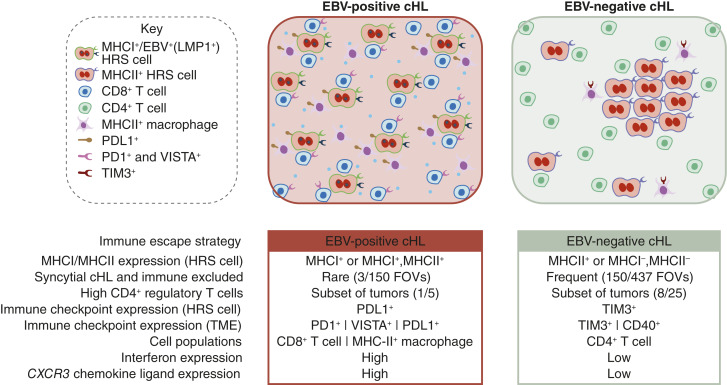
Results: We show that MHC-I expression on HRS cells is associated with immune-inflamed neighborhoods containing CD8+ T cells, MHC-II+ macrophages, and immune checkpoint expression (i.e., PD1 and VISTA). We identified spatial clustering of HRS cells, consistent with the syncytial variant of cHL, and its association with T-cell-excluded neighborhoods in a subset of EBV-negative tumors. Finally, a subset of both EBV-positive and EBV-negative tumors contained regulatory T-cell-high neighborhoods harboring HRS cells with augmented proliferative capacity.

Conclusions: Our study links HRS cell properties with distinct immunophenotypes and potential immune escape mechanisms in cHL.


Conflict of interest statement

M. Roshal reports personal fees from Auron, grants from AstraZeneca, and grants and nonfinancial support from Genentech outside the submitted work. S.P. Shah reports grants from AstraZeneca and Bristol Myers Squibb during the conduct of the study. N.D. Socci reports grants from NIH during the conduct of the study. A. Dogan reports grants from Roche and AstraZeneca outside the submitted work. I.K. Mellinghoff reports grants from General Electric, Lilly, and Roche; grants and other support from Amgen, Kazia Therapeutics, Servier, and Agios; and other support from AstraZeneca outside the submitted work. No disclosures were reported by the other authors.

Figures

Figure 1.
Figure 1.
Multidimensional molecular profiling of newly diagnosed cHL. A, Clinical characteristics of patients with cHL and their data availability. Tumors are grouped by EBV status. Gray (clinical annotation) indicates unknown characteristics. The bar graph (right) indicates the cohort-level summary. B, Study design. Derivation of cell types and cell states from cell identity and cell function antigens using mpIF. For cell type abbreviations, see Supplementary Table S3. C, Summary of FOV counts per patient. D, UMAP of all cells (n = 1,276,712 subsampled from 23,678,036) profiled by mpIF colored by cell subtype. HRS clusters are circled in the UMAP. Bar plot indicating the percentage of each cell type over total cells. E, Bar plot indicating the percentage of HRS cells over total cells in each patient. F, Representative mpIF FOVs overlaying five markers delineating major cell types from 2 patients (HL_15 FOV 14, HL_21 FOV 5). Scale bar, 100 microns. (A, Adapted from images by GraphicsRF/stock.adobe.com and wowow/stock.adobe.com). F, female; LR, lymphocyte rich; M, male.
Figure 2.
Figure 2.
Characterization of HRS cell states and their spatial heterogeneity. A, UMAP of HRS cells profiled by multiplexed immunofluorescence colored by normalized intensity of cell function antigens. B, Heatmap indicating the fraction of HRS cell states (over total HRS cells) at the patient level grouped by EBV status and ordered by decreasing cohort fraction depicted by the bar graph (left). Cell states with a minimum cohort fraction of 3% are included (except IDO1+). Gray indicates missing data. The bar graph (right) indicates the maximum CoV for each cell state for patients with a minimum of five FOVs (n = 29). See also Supplementary Table S7. C, Forest plot indicating effect size and 95% CI of statistically and biologically significant (see “Materials and Methods”) HRS cell fractions colored by P-adjusted (two-sided Wilcoxon test adjusted by Bonferroni correction) in the comparison of EBV-positive (n = 150 FOVs) and EBV-negative (n = 437 FOVs) patients. For exact P values, see Supplementary Table S8. D, Density plot indicating normalized intensity of B2M, MHC-I, and MHC-II. E, Stacked bar plot indicating percent of HRS cells positive for all combinations of B2M, MHC-I, and MHC-II. MHC-I with or without MHC-II refers to HRS cells positive for only MHC-I or both MHC-I and MHC-II. Patients with data for all three markers (n = 26) are shown. F, Box plot indicating the percent of HRS cells in three antigen presentation machinery states (two-sided Wilcoxon test). Each point represents one patient (box plot represents minimum, first quartile, median, third quartile, and maximum). G, B2M, MHC-I, and MHC-II IHC of an EBV-positive (HL_33) and EBV-negative (HL_14) tumor. Scale bar, 100 microns. H, Bar graph indicating the fraction of tumors expressing B2M, MHC-I, and MHC-II on HRS cells based on pathologist quantification of IHC staining (two-sided Fisher’s exact test). Ag, antigen; CI, confidence interval.
Figure 3.
Figure 3.
EBV-positive cHL exhibits an immune-inflamed immunotype. A, Analysis approach to defining EBV-positive and EBV-negative HRS neighborhoods. The forest plot shows the effect size and 95% CI of immune cell fractions colored by P-adjusted (two-sided Wilcoxon test adjusted by Bonferroni correction) in the comparison of EBV-positive (n = 150 FOVs) and EBV-negative (n = 437 FOVs) HRS neighborhoods. For cell type abbreviations, see Supplementary Table S3. For exact P values, see Supplementary Table S8. B, Analysis approach to defining B2M/MHC-I positive and negative HRS cell neighborhoods. The forest plot shows the effect size and 95% CI of immune cell fractions colored by P-adjusted in the comparison of B2M+/MHC-I+ and B2M/MHC-I HRS neighborhoods in EBV-negative tumors. For exact P values, see Supplementary Table S10. C, Representative mpIF FOVs overlaying five markers from an EBV-positive (HL_19 FOV 3) and an EBV-negative tumor (HL_28 FOV 13). Scale bar, 500 microns. D, Heatmap indicating the scaled RNA expression values for differentially expressed genes (P-adjusted < 0.01) in EBV-positive (n = 7) vs. EBV-negative (n = 25) tumors sorted by fraction of samples with a Z-score in the same direction within each EBV group. Genes in red are in the mpIF panel. The annotated pathways represent pathways with the highest count of differentially expressed genes. See also Supplementary Table S11. EMT, epithelial–mesenchymal transition; IFN, interferon; Lymph, lymphoid.
Figure 4.
Figure 4.
Determinants of spatial neighborhoods in EBV-negative cHL. A, FOV showing two patterns of HRS cell spatial arrangement. B, UMAP of HRS cells colored by HRS cell subtype and EBV status. Stacked bar plot indicates the percent of syncytial and non-syncytial HRS cells by EBV status. C, Analysis approach to defining syncytial and non-syncytial HRS cell neighborhoods. The forest plot shows the effect size and 95% CI of cell fractions colored by P-adjusted in the comparison of syncytial and non-syncytial HRS neighborhoods in EBV-negative tumors. D, Analysis approach to defining CD4+ Treg high and low neighborhoods. The forest plot shows the effect size and 95% CI cell fractions colored by P-adjusted in the comparison of CD4+ Treg high and CD4+ Treg low neighborhoods in EBV-negative tumors. For cell type abbreviations, see Supplementary Table S3. For exact P-values, see Supplementary Table S10.
Figure 5.
Figure 5.
A model of HRS cells and their TME in EBV-positive and EBV-negative cHL. Distinguishing features of EBV-positive and EBV-negative tumors. An FOV is characterized as syncytial cHL if it contains a minimum of one HRS aggregate.

References

    1. Connors JM, Cozen W, Steidl C, Carbone A, Hoppe RT, Flechtner HH, et al. Hodgkin lymphoma. Nat Rev Dis Primer 2020;6:61. - PubMed
    1. Brice P, de Kerviler E, Friedberg JW. Classical Hodgkin lymphoma. Lancet 2021;398:1518–27. - PubMed
    1. Wein F, Küppers R. The role of T cells in the microenvironment of Hodgkin lymphoma. J Leukoc Biol 2016;99:45–50. - PMC - PubMed
    1. Cader FZ, Schackmann RCJ, Hu X, Wienand K, Redd R, Chapuy B, et al. Mass cytometry of Hodgkin lymphoma reveals a CD4+ regulatory T-cell–rich and exhausted T-effector microenvironment. Blood 2018;132:825–36. - PMC - PubMed
    1. Aoki T, Chong LC, Takata K, Milne K, Hav M, Colombo A, et al. Single-cell transcriptome analysis reveals disease-defining T-cell subsets in the tumor microenvironment of classic Hodgkin lymphoma. Cancer Discov 2020;10:406–21. - PubMed