. 2024 Jul 1;4(7):1815-1833.
doi: 10.1158/2767-9764.CRC-23-0428.

N-Myristoytransferase Inhibition Causes Mitochondrial Iron Overload and Parthanatos in TIM17A-Dependent Aggressive Lung Carcinoma

Affiliations

N-Myristoytransferase Inhibition Causes Mitochondrial Iron Overload and Parthanatos in TIM17A-Dependent Aggressive Lung Carcinoma

Sofia Geroyska et al. Cancer Res Commun. .

Abstract

Myristoylation is a type of protein acylation by which the fatty acid myristate is added to the N-terminus of target proteins, a process mediated by N-myristoyltransferases (NMT). Myristoylation is emerging as a promising cancer therapeutic target; however, the molecular determinants of sensitivity to NMT inhibition or the mechanism by which it induces cancer cell death are not completely understood. We report that NMTs are a novel therapeutic target in lung carcinoma cells with LKB1 and/or KEAP1 mutations in a KRAS-mutant background. Inhibition of myristoylation decreases cell viability in vitro and tumor growth in vivo. Inhibition of myristoylation causes mitochondrial ferrous iron overload, oxidative stress, elevated protein poly (ADP)-ribosylation, and death by parthanatos. Furthermore, NMT inhibitors sensitized lung carcinoma cells to platinum-based chemotherapy. Unexpectedly, the mitochondrial transporter translocase of inner mitochondrial membrane 17 homolog A (TIM17A) is a critical target of myristoylation inhibitors in these cells. TIM17A silencing recapitulated the effects of NMT inhibition at inducing mitochondrial ferrous iron overload and parthanatos. Furthermore, sensitivity of lung carcinoma cells to myristoylation inhibition correlated with their dependency on TIM17A. This study reveals the unexpected connection between protein myristoylation, the mitochondrial import machinery, and iron homeostasis. It also uncovers myristoylation inhibitors as novel inducers of parthanatos in cancer, and the novel axis NMT-TIM17A as a potential therapeutic target in highly aggressive lung carcinomas.

Significance: KRAS-mutant lung carcinomas with LKB1 and/or KEAP1 co-mutations have intrinsic therapeutic resistance. We show that these tumors are sensitive to NMT inhibitors, which slow tumor growth in vivo and sensitize cells to platinum-based chemotherapy in vitro. Inhibition of myristoylation causes death by parthanatos and thus has the potential to kill apoptosis and ferroptosis-resistant cancer cells. Our findings warrant investigation of NMT as a therapeutic target in highly aggressive lung carcinomas.


Conflict of interest statement

E. Nemeth is a scientific cofounder of Intrinsic LifeSciences and Silarus Therapeutics and a consultant for Disc Medicine, GKS, Protagonist, Vifor, Ionis, Shield Therapeutics, Novo Nordisk, Chugai, and Chiesi. No disclosures were reported by the other authors.

Figures
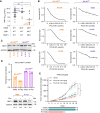
Figure 1
Figure 1
Lung carcinoma cells with LKB1 and/or KEAP1 mutations in a KRAS-mutant background are sensitive to myristoylation inhibition. A, NMTi IC50 for lung carcinoma cells with the indicated mutational status were compared. IC50 values for ICL1100013 (DDD85646) were from Genomics of Drug Sensitivity in Cancer and mutational profiles from DepMap. **, P = 0.008; *, P = 0.005; ns = not significant (Student t test). Crossbar, median. B, Viability test (CCK8) at 72 hours of PCLX-001 treatment. Optical density (OD) values were normalized to vehicle-treated samples. Error bars, SEM. C, NMT1 immunoblotting on the indicated cells. GAPDH, loading control. D, Relative viability (CCK8) of doxycycline (Dox) treated vs. untreated Tet-inducible NMT1#10 shRNA cells. Blot: NMT1 immunoblotting in cells with or without Dox. GAPDH, loading control. E, Percent change in H460 (KL/K)MUT xenograft tumor volume from mice treated with daily subcutaneous injections of vehicle control or PCLX-001 at dosages of 25 and 50 mg/kg. Treatment was indicated by the colored bars (18 days for the 25 mg/kg group and 10 days for the 50 mg/kg group). **, P = 0.008, one-way ANOVA, Tukey’s multiple comparisons test.
Figure 2
Figure 2
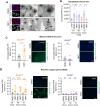
NMT inhibition causes mitochondrial ferrous iron accumulation and increases ROS in (KL/K)MUT but not (KL/K)WT lung carcinoma cells. A, TfR1 and DAPI staining on (KL/K)MUT H460 cells treated with 0.5 μmol/L DDD85646 (NMTi) or vehicle for 72 hours. Images were inverted for clarity. Right column, amplification of the area in the square in the middle column. Bar, 15 μm in left and middle columns, 5 μm in right column. (*), endocytic recycling compartment. Arrowheads, intracellular TfR1 clusters. B, Cytoplasmic ferrous iron measured using FerroOrange in H460 cells (KL/K)MUT treated with 0.5 μmol/L DDD85646 (NMTi) or vehicle for the indicated times. Two independent experiments with four technical replicates each were combined. Deferoxamine (DFO, 7 μmol/L) was used as negative control. Fluorescence was normalized to cell number and expressed as arbitrary units (a.u.). Bar, group mean; error bars, SD. **, P = 0.0014; ***, P = 0.0002; ns = not significant (Student t test). C, Mitochondrial ferrous iron (Mito-FerroGreen) measured in (KL/K)MUT and (KL/K)WT lung carcinoma cells treated with 1 μmol/L DDD85646 or vehicle for 24 hours. Signal intensity was quantified in randomly imaged fields containing at least 200 cells per condition. Bar, group mean; error bars, SEM; a.u., arbitrary units. ***, P = 0.0002; ns, not significant (Student t test). Representative images are shown. Bar, 15 μm. D, ROS detected using DCFH-DA in (KL/K)MUT and (KL/K)WT lung carcinoma cells treated with 1 μmol/L DDD85646 for the indicated times. Signal intensity was quantified in randomly imaged fields containing at least 720 cells per condition. Bars, mean; error bars, SEM; a.u., arbitrary units. *, P = 0.0202; ****; P < 0.0001, **; P = 0.0017; ns, not significant (Student t test). Representative images from 72 hours of treatment are shown. Bar, 30 μm.
Figure 3
Figure 3
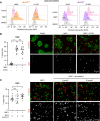
NMT inhibition increases lipid peroxidation and induces caspase-independent cell death in (KL/K)MUT lung carcinoma cells. A, Lipid peroxidation measured using Bodipy 581/591 C11 and flow cytometry in (KL/K)MUT and (KL/K)WT lung carcinoma cells treated with 1 μmol/L DDD85646 (NMTi) or vehicle control (DMSO) for 96 hours. Erastin (10 μmol/L for 24 hours) was used as positive control. Green fluorescence (oxidized probe) was normalized to control DMSO. n = 2 independent experiments. MFI, mean fluorescence intensity. B, Cell viability (Live/dead reagent) was analyzed in (KL/K)MUT cells treated for 72 hours with vehicle control or 1 μmol/L DDD85646 (NMTi) in the presence or absence of 25-μmol/L ZVAD-FMK added freshly every 24 hours. Graph: percentage of dead cells calculated from at least 5,000 cells per condition. Bar, group mean, error bars, SEM. ****, P < 0.0001; ns, not significant (Student t test). Representative images are shown. Bar, 100 μm. C, Cell viability (live/dead reagent) analyzed in (KL/K)MUT cells treated for 72 hours with vehicle control or 1 μmol/L DDD85646 (NMTi) in the presence or absence of the ferroptosis inhibitor liproxstatin (5 and 10 μmol/L). Graph: percentage of dead cells calculated from at least 5,500 cells per condition. Crossbar, group mean; error bars, SEM. *, P < 0.05; ns, not significant (Student t test). Representative images are shown. Bar, 100 μm.
Figure 4
Figure 4
NMTi treatment induces parthanatos in (KL/K)MUT lung carcinoma cells. A, Ultrastructure of (KL/K)MUT cells treated with 1 μmol/L DDD85646 (NMTi) or vehicle control for 72 hours. Bottom, Magnification of areas in the squares. Arrowheads, mitochondria. Bars, 1 μm (top) and 0.5 μm (bottom). B, Diagram of the parthanatos components. C, Detection of PARylation (PAR) by immunoblotting in lysates from (KL/K)MUT cells treated with 1 μmol/L PCLX-001 (NMTi) for 72 hours. Actin, loading control. D, Detection of PARylation (PAR) by immunoblotting in lysates from (KL/K)MUT H460 and (KL/K)WT H1437 cells expressing Tet-inducible NMT1 shRNA treated with or without Dox. GAPDH, loading control. Note that GAPDH is identical to that in Fig. 1E because the same membrane was used to stain NMT1 and PAR. E, MIF subcellular localization in (KL/K)MUT H1792 cells treated with vehicle control of 1 μmol/L PCLX-001 (NMTi) for 96 hours and processed for immunofluorescence using a MIF antibody. Representative images are shown. Bar, 5 μm in left column, 15 μm in right column. F, AIF1 immunoblotting in cytoplasmic and nuclear lysates of (KL/K)MUT H460 treated with 1 μmol/L PCLX-001 (NMTi) o vehicle for 72 hours. Tubulin and lamin staining were used to verify fraction purity. (*) non-specific band. G, AIF immunofluorescence in tumor sections from (KL/K)MUT H460 xenografts from animals treated with 25 mg/kg PCLX-001 (NMTi) or vehicle control. Arrowheads, nuclear AIF. Bar, 10 μm. H, Cell viability (live/dead reagent) in (KL/K)MUT H460 cells treated with 1 μmol/L PCLX-001 (NMTi) or vehicle control and 20 μmol/L olaparib for 72 hours. Representative fluorescent images are shown. Bar, 30 μm. Graph, percentage of dead cells calculated from at least 5,000 cells per condition. Crossbar, group mean; error bars, SEM. ****, P < 0.0001 (Student t test).
Figure 5
Figure 5
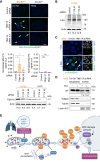
NMTi treatment activates the DNA damage response and sensitizes (KL/K)MUT lung carcinoma cells to platinum doublet chemotherapy. A, Phospho-H2A.X staining in (KL/K)MUT H460 lung cancer cells treated with 1 μmol/L PCLX-001 (NMTi) or vehicle control for 72 hours. Graph: percentage of p-H2A.X positive cells calculated from at least 400 cells per condition. Crossbar, group mean; error bars, SEM. ***, P < 0.0002 (Student t test). Representative images are shown. Arrowheads, nuclei containing p-H2A.X-positive foci. Bar, 25 μm. B, Phospho-H2A.X staining of H460 xenograft tumor sections from mice treated with 25 mg/kg PCLX-001 or vehicle control. Square, area magnified for each on the right. Arrowhead, nuclei with p-H2A.X positive foci. Bar, 100, 30, and 10 μm in the left, middle, and right columns, respectively. C, Viability test (CCK8) of (KL/K)MUT HCC44 and H1792 cells treated with PCLX-001 (NMTi) in combination with platinum-based chemotherapy. Left, Dose–response of cisplatin in combination with NMTi (50 nmol/L). Middle, Dose–response of pemetrexed in combination with NMTi (50 nmol/L). Right, Dose–response of cisplatin in combination with a single dose of pemetrexed (5 μmol/L) and a single dose of NMTi (125 nmol/L). OD was normalized to vehicle-treated samples. One representative experiment from two independent experiments with the same result is shown. Error bars, SEM. **, P < 0.0001; *, P < 0.0025, two-way ANOVA with the interaction between drug and dose level. All P values are adjusted for multiple testing using the Šídák method.
Figure 6
Figure 6
Mitochondria are a key target of NMT inhibition in (KL/K)MUT lung carcinoma cells. A, Ultrastructure of mitochondria from (KL/K)MUT H1792 lung carcinoma cells treated with control or 1 μmol/L DDD85646 (NMTi) for the indicated times. Arrowheads, mitochondria cristae. Bar, 50 nm. B, Volcano plot of mitochondrial membrane-associated proteins whose abundance was altered by NMTi treatment. Blue lines indicate thresholds for a fold-change of two or a P value of 0.05 by moderated t test. C, Diagram of the main mitochondrial import complexes: TOM, in the outer mitochondrial membrane, and TIM23, in the inner mitochondrial membrane (IMM). TIM17A or TIM17B bind TIM23 to form the main TIM23 complex channel in the IMM. D, Kaplan–Meier curve shows percent surviving (overall survival, y-axis) over time (years, x-axis) for TCGA-LUAD (n = 501, n-event = 181). High TIM17A (Red, ≥50th percentile) were compared with low TIM17A (Blue, <50th percentile; log-rank test, P = 0.014, median OS was 3.72 years in TIM17A High vs. 4.93 in TIM17A Low). Colored shading: 95% confidence interval. E, Immunoblotting for TIM17A and TIM17B in samples from (KL/K)MUT H460 cells treated with 1 μmol/L PCLX-001 (NMTi) or vehicle control for the indicated times. Numbers, band intensity normalized to actin control. F, Immunoblotting for HSP60 and TOM20 in samples from (KL/K)MUT H460 cells treated with 1 μmol/L PCLX-001 (NMTi) or vehicle control for the indicated times. Numbers, band intensity normalized to actin.
Figure 7
Figure 7
Dependency on TIM17A is a determinant of NMTi sensitivity in lung carcinoma cells. A, TIM17A immunoblotting in the indicated cells treated with 1 μmol/L PCLX-001 (NMTi) for 72 hours. Numbers, band intensity normalized to actin control. B, Boxplot showing CRISPR DepMap Score for LUAD cells (y-axis) estimated using the Chronos algorithm. Negative values suggest decreased cell viability. (KL/K)MUT (HCC44, H460, and H1792) and (KL/K)WT (H522, H1650, and H1437) lung carcinoma cells used in our study are highlighted. C, TIM17A CRISPR Chronos scores (y-axis) plotted against NMTi IC50 (x-axis; Spearman’s Correlation, P = 0.006, = −0.43). Axis scales are log-transformed, and the best-fit line (blue) was calculated using a linear model. Gray shading, standard error of the estimate. H460 was added manually based on our calculated IC50 and the publicly available dependency score. D, Cell viability (crystal violet staining) in (KL/K)MUT H1792 and (KL/K)WT H522 lung carcinoma cells transfected with a TIM17-targeting siRNA pool or a non-targeting control. Bar: average; error bars, SEM. One representative experiment from three independent experiments with similar results. ***, P = 0.0009 (Student t test). Bottom, TIM17A immunoblotting of the samples above. E, Colony assays of (KL/K)MUT H460 and (KL/K)WT H522 expressing Tet-inducible TIM17A or control non-targeting shRNA growing in the presence or absence of Dox. Top, Representative images. Bottom, TIM17A immunoblotting of lysates from the cells used for colony assays. GAPDH, loading control.
Figure 8
Figure 8
Genetic targeting of TIM17A causes mitochondrial ferrous iron accumulation and activation of parthanatos in (KL/K)MUT lung carcinoma cells. A, Mitochondrial ferrous iron detection in (KL/K)MUT and (KL/K)WT cells transfected with non-targeting control or two different TIM17A siRNAs. Quantification of signal intensity on a representative experiment out of two using randomly imaged fields containing at least 480 cells per experimental condition. Graph bars, group mean; error bars, SEM. a.u., arbitrary units. *, P = 0.0101 for control vs. #1, P = 0.0131 for control vs. #2; ns = not significant (Student t test). Representative microscope images are shown. Arrowheads, Mito-FerroGreen positive cells. Bars, 15 μm. Bottom, TIM17A immunoblotting in lysates from the cells used above. Numbers: band intensity normalized to actin control. B, Protein PARylation detection by immunoblotting in H1792 cells transfected with non-targeting control and two different TIM17A oligos for 72 hours. Numbers: band intensity normalized to actin control. C, H460 cells stably expressing a Tet-inducible TIM17A shRNA treated or not with Dox were stained with p-H2A.X and DAPI. Arrowheads, nuclei containing p-H2A.X-positive foci. Bar, 10 μm. D, AIF subcellular localization in (KL/K)MUT H460 cells stably expressing a Tet-inducible TIM17A shRNA treated or not with Dox. Cytoplasmic and nuclear lysates were separated and immunoblotted for AIF. Tubulin, TOM20, and lamin staining were used to verify fraction purity. Numbers: nuclear AIF band intensity normalized to lamin A/B. E, Summary of our findings reporting that myristoylation inhibition induces parthanatos through loss of TIM17A and mitochondrial ferrous iron overload in (KL/K)MUT lung carcinoma.

References

    1. Wright MH, Heal WP, Mann DJ, Tate EW. Protein myristoylation in health and disease. J Chem Biol 2010;3:19–35. - PMC - PubMed
    1. Duronio RJ, Reed SI, Gordon JI. Mutations of human myristoyl-CoA:protein N-myristoyltransferase cause temperature-sensitive myristic acid auxotrophy in Saccharomyces cerevisiae. Proc Natl Acad Sci U S A 1992;89:4129–33. - PMC - PubMed
    1. Giang DK, Cravatt BF. A second mammalian N-myristoyltransferase. J Biol Chem 1998;273:6595–8. - PubMed
    1. Dian C, Pérez-Dorado I, Rivière F, Asensio T, Legrand P, Ritzefeld M, et al. . High-resolution snapshots of human N-myristoyltransferase in action illuminate a mechanism promoting N-terminal Lys and Gly myristoylation. Nat Commun 2020;11:1132. - PMC - PubMed
    1. Kosciuk T, Price IR, Zhang X, Zhu C, Johnson KN, Zhang S, et al. . NMT1 and NMT2 are lysine myristoyltransferases regulating the ARF6 GTPase cycle. Nat Commun 2020;11:1067. - PMC - PubMed

Publication types

MeSH terms

Substances