. 2024 Jul 1;20(7):e1012339.
doi: 10.1371/journal.ppat.1012339. eCollection 2024 Jul.

IL-10 suppresses T cell expansion while promoting tissue-resident memory cell formation during SARS-CoV-2 infection in rhesus macaques

Affiliations

IL-10 suppresses T cell expansion while promoting tissue-resident memory cell formation during SARS-CoV-2 infection in rhesus macaques

Christine E Nelson et al. PLoS Pathog. .

Abstract

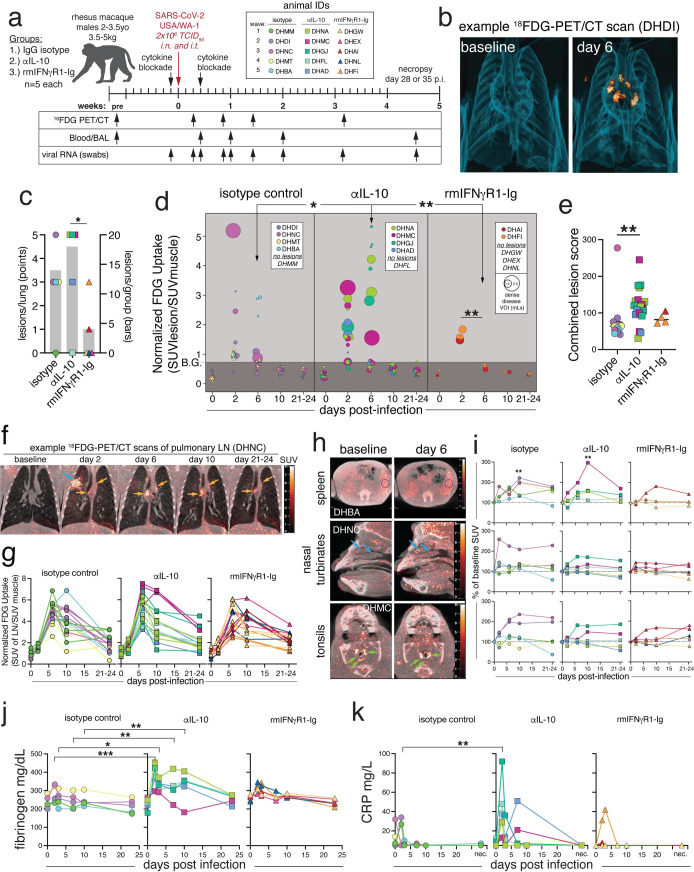
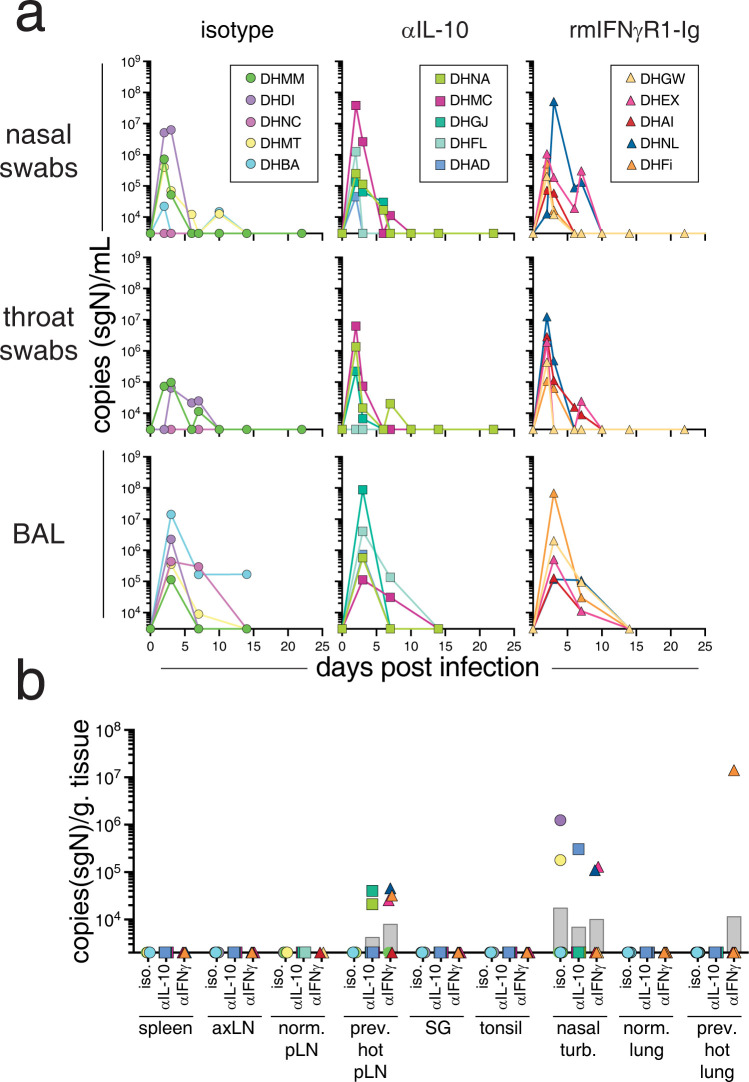
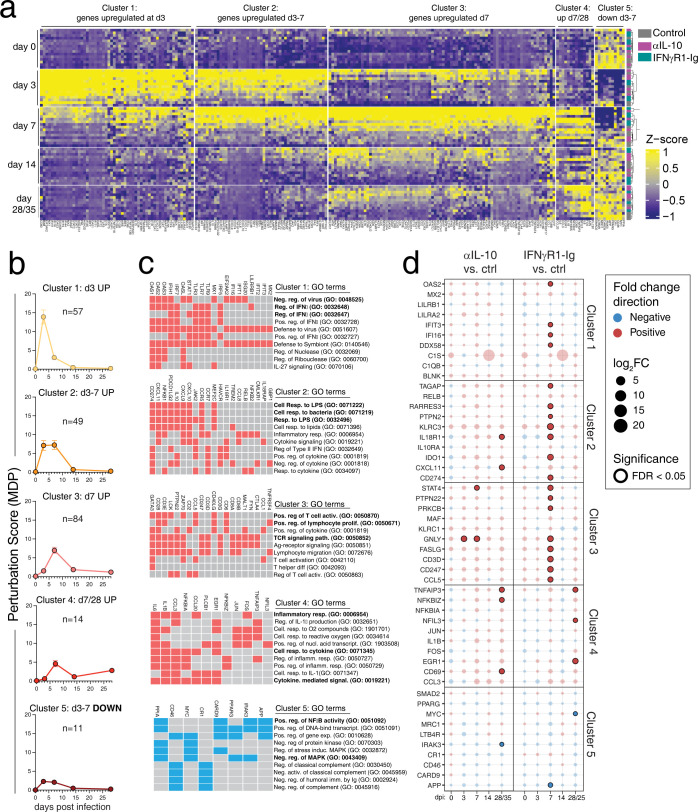
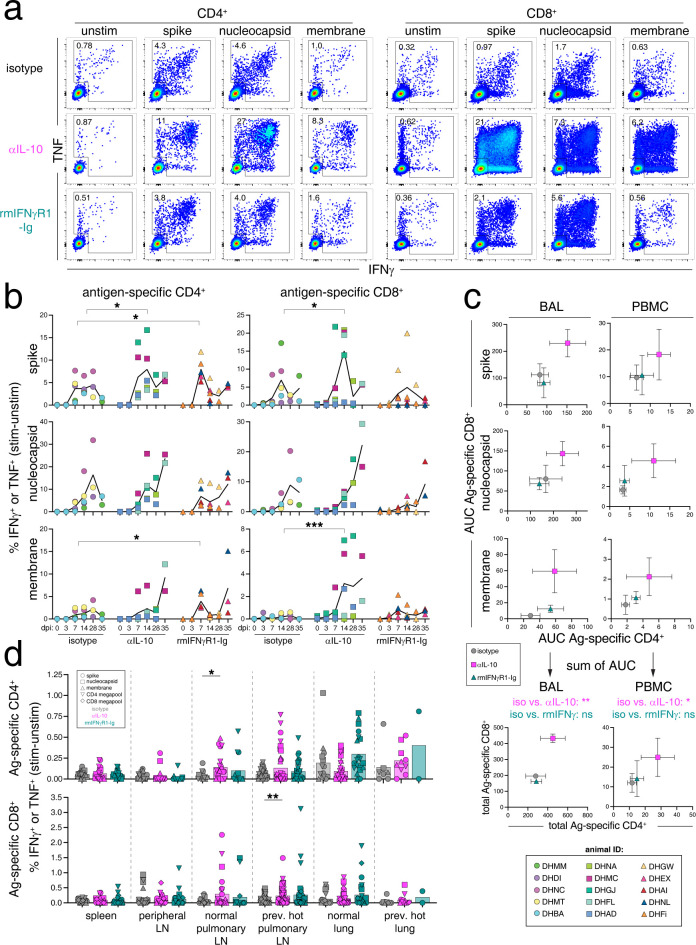
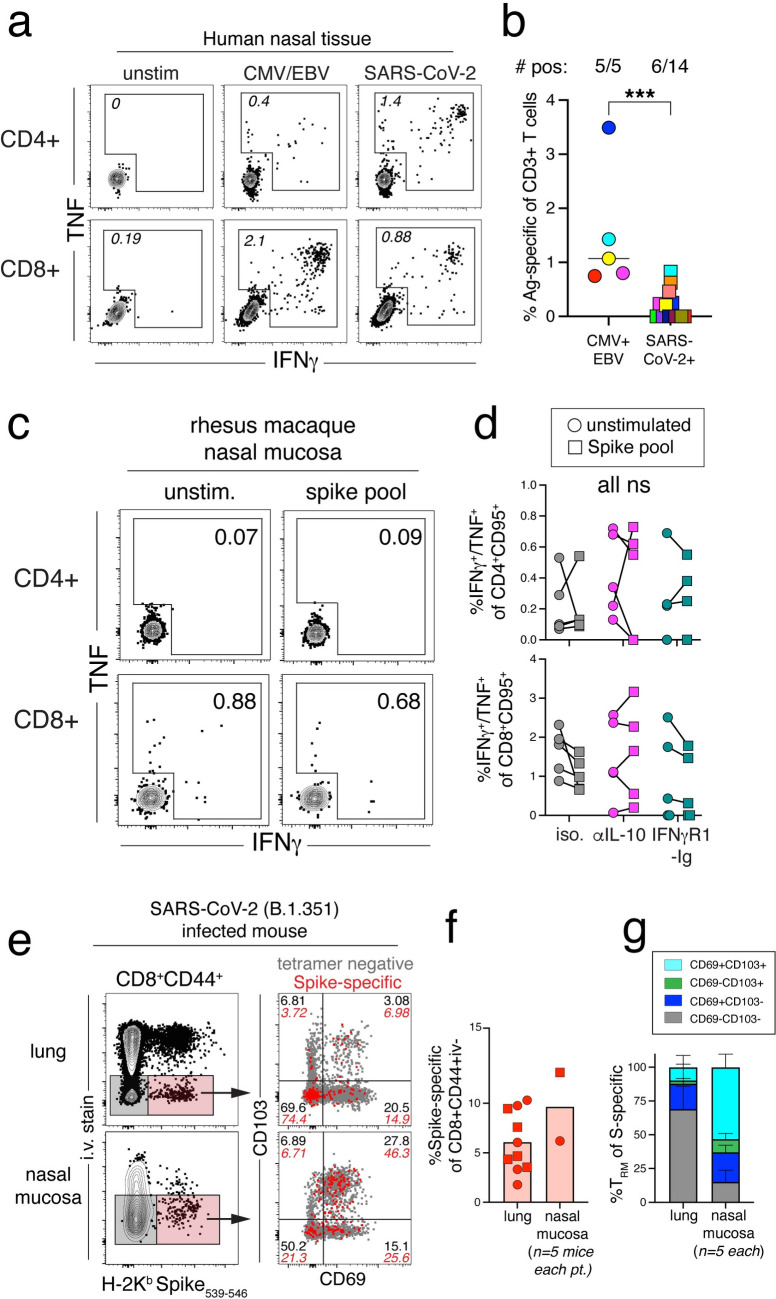
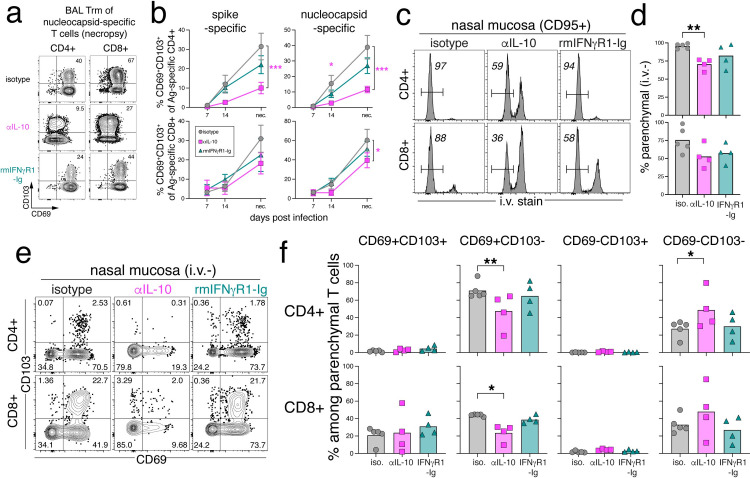
The regulation of inflammatory responses and pulmonary disease during SARS-CoV-2 infection is incompletely understood. Here we examine the roles of the prototypic pro- and anti-inflammatory cytokines IFNγ and IL-10 using the rhesus macaque model of mild COVID-19. We find that IFNγ drives the development of 18fluorodeoxyglucose (FDG)-avid lesions in the lungs as measured by PET/CT imaging but is not required for suppression of viral replication. In contrast, IL-10 limits the duration of acute pulmonary lesions, serum markers of inflammation and the magnitude of virus-specific T cell expansion but does not impair viral clearance. We also show that IL-10 induces the subsequent differentiation of virus-specific effector T cells into CD69+CD103+ tissue resident memory cells (Trm) in the airways and maintains Trm cells in nasal mucosal surfaces, highlighting an unexpected role for IL-10 in promoting airway memory T cells during SARS-CoV-2 infection of macaques.


Conflict of interest statement

A.S. is a consultant for Gritstone Bio, Flow Pharma, Moderna, AstraZeneca, Qiagen, Avalia, Fortress, Gilead, Sanofi, Merck, RiverVest, MedaCorp, Turnstone, NA Vaccine Institute, Gerson Lehrman Group and Guggenheim. LJI has filed for patent protection for various aspects of T cell epitope and vaccine design work. All other authors have no competing interests to disclose.

Figures

Fig 1
Fig 1. SARS-CoV-2 induced lung inflammation is increased with IL-10 blockade and decreased with IFNγ blockade.
(A) Experimental design: Fifteen male rhesus macaques, with n = 5 per group: IgG isotype control, anti-IL-10, or anti-IFNγ (rmIFNγR1-Ig). Animals were treated with 10mg/kg of monoclonal antibody i.v. one day prior to infection and three days after infections with SARS-CoV-2/USA/WA-1 at a dose of 2x10⁶ TCID50, administered intranasal (i.n.) and intratracheal (i.t.). Sampling was performed at the indicated timepoints. Individual animal IDs are indicated and used throughout. (B) 3D rendering of representative lung 18FDG-PET/CT images from baseline and 6 post infection from isotype control animal (DHDI). (C) Number of lesions per animal (left axis, points) and average number of lesions per group (right axis, grey bars). Significance calculated with individual t-test with Welch’s correction for lesions per animal. (D) Quantification of FDG uptake in standard uptake value (SUV) normalized to muscle, and volume of individual lesions (size of dot), based on volume of interest (VOI) > -550 Hounsfield units (HU) defined at days 2 or 6 post-infection. Significance was calculated with individual t-test with Welch’s correction for FDG uptake at day 6 between groups and Tukey’s multiple comparison test of day 2 vs. day 6 within each group. (E) Lesion score for individual lesions calculated as the sum of normalized max FDG uptake, normalized max Hounsfield’s units, and normalized max volume. Significance calculated with Dunn’s multiple comparison test. (F) Example PET/CT images showing pulmonary lymph node FDG signal from baseline, day 2, 6, 10, and 21–24 post-infection from isotype control animal DHNC. Orange arrows indicate lymph nodes and blue arrow indicates a lung lesion. (G) Quantification of metabolic activity of lymph nodes as measured FDG uptake in SUV, normalized to muscle. All time points post-infection were statistically significant over baseline by 2-way ANOVA and Tukey’s multiple comparison test. (H) Example PET/CT images with evidence of FDG signal from spleen, nasal turbinates, and tonsils from baseline and day 6 post infection. Animal IDs are embedded in image. DHBA and DHNC (isotype). DHMC (anti-IL10). (I) Quantification of change in FDG uptake (SUV) calculated as change from baseline for each animal with detectable signal from spleen, nasal turbinates, and tonsils. Significance calculated by 2-way ANOVA and Tukey’s multiple comparison test. (J) Plasma fibrinogen levels in mg/dL. Significance calculated with 2-way ANOVA and a Dunnett’s multiple comparison test. (K) Plasma C-reactive protein (CRP) in mg/L. Limit of detection >5mg/L. Significance calculated with a 2-way ANOVA and a Dunnett’s multiple comparison test. Panel A generated in part with BioRender.com.
Fig 2
Fig 2. IFNγ and IL-10 are not required to suppress SARS-CoV-2 replication.
(A) Subgenomic RNA quantification of the N gene (sgN) of SARS-CoV-2 by RT-qPCR in copies/mL from bronchoalveolar lavage (BAL), nasal swabs, and throat swabs. (B) sgN copies/gram of tissue at necropsy (day 28–35 post-infection) from spleen, axillary lymph node (axLN), non-PET/CT avid pulmonary lymph nodes (norm. pLN), previously PET/CT hot pulmonary lymph nodes (prev. hot pLN), salivary gland (SG), tonsil, nasal turbinates (nasal turb.), normal lung sections (norm. lung), and previously PET/CT hot lung sections. For A the cutoff for RNA detection is 3,000 copies/mL. For B the cutoff is 2,000 copies/gram of tissue. Graphs show individual animals from samples taken at baseline, days 2, 3, 6, 7, 10, 14, and 22 post-infection, as well as necropsy. Significance calculated with a 2-way ANOVA and a Dunnett’s multiple comparison test.
Fig 3
Fig 3. IFNγ blockade prolongs transcriptional signatures of innate and adaptive immune response to SARS-CoV-2 infection.
(A) Heatmap of mRNA expression by z-score of BAL immune cells at day 0, 3, 7, 14, and 28–35 after SARS-CoV-2 infection. Genes were pre-filtered on genes that responded to infection, see methods. K-means clustering was used to group genes in to five clusters. (Right) The sample key is based on treatment, grey = control, pink = anti-IL-10, and teal = rmIFNγR1-Ig. (B) Molecular degree of perturbation (MDP) for each gene was calculated based on change from baseline and summarized for each cluster. The number above each graph indicates the number of genes included in each cluster. (C) Gene ontology (GO) classification was performed, and the top significant pathways are shown with the genes included in the pathways highlight in red for genes that are increased over baseline and shown in blue for genes that are downregulated over baseline, identified with EnrichR. Statistical significance reported in S1 Table. (D) The top 10 genes in each cluster were determined and the fold change in each treatment group were compared to controls. The size of the circle represents the fold change, and the color of the circle indicates if the gene is upregulated or downregulated compared to control, at each timepoint. Significant changes are highlighted with bold outline (false discovery rate (FDR) <0.05).
Fig 4
Fig 4. IL-10 blockade increases SARS-CoV-2-specific T cell responses in the blood and BAL fluid.
(A) Representative flow cytometry plots of CD4+95+ and CD8+95+ T cells from the bronchoalveolar lavage (BAL) at day 14 post-infection responding to ex vivo peptide stimulation assay with SARS-CoV-2 15-mer peptide pools for spike (S), nucleocapsid (N), and membrane (M) proteins by production of IFNγ and TNF production. Numbers in plots are the frequency of the gated cytokine+ population. (B) Quantification of frequency of antigen specific CD4+95+ and CD8+95+ responses in BAL at baseline (dpi 0), days 3, 7, 14, and necropsy (dpi 28 or 35), calculated by taking the frequency of IFNγ+ or TNF+ in the stimulated samples and subtracting the frequency in the matched unstimulated samples. Each animal is represented as a point and the mean as a line for each treatment group. Legend is in bottom right corner. Significance calculated by 2-way ANOVA with Dunnett’s multiple comparison test. (C) The mean and SEM of the area under the curve (AUC) for antigen-specific CD4 T cell responses (x-axis) and antigen-specific CD8 T cell responses (y-axis) responses in BAL and PBMC samples calculated from ex vivo peptide stimulation with spike (S), nucleocapsid (N), and membrane (M), as represented in B. The AUC was determined for dpi 0–28 and interpolated by linear regression for animals necropsied at day 35. The bottom graphs represent the sum of the AUC for the S-, N-, and M-specific CD4 and CD8 T cell responses, and statistics represent a Dunnett’s multiple comparison test for total AUC responses from treatment groups compared to isotype control. (D) Quantification of frequency of antigen specific CD4+95+ and CD8+95+ responses in spleen, peripheral lymph nodes (axillary, cervical, and/or inguinal lymph nodes), normal pulmonary lymph nodes (norm. pulm. LN), previously PET/CT hot pulmonary lymph nodes (prev. hot pulm. LN), normal lung sections (norm. lung), and previously PET/CT hot lung sections (prev. hot lung) at necropsy (dpi 28 or 35), calculated as in B. Each animal is represented as a point and the antigen as a shape. Significance calculated by 2-way ANOVA with Dunnett’s multiple comparison test.
Fig 5
Fig 5. IL-10 blockade does not rescue the lack of SARS-CoV-2-specific T cell responses in the nasal mucosa of rhesus macaques.
(A) Representative flow cytometry plots of cytokine producing CD4+95+ or CD8+95+ T cells after ex vivo peptide stimulation with CMV and EBV peptide pools, SARS-CoV-2 peptide pools, or unstimulated samples from human nasal mucosa. Numbers in plots are the frequency of gated cytokine+ of activated CD4 or CD8 T cells. (B) Quantification of total antigen-specific T cells by cytokine+ (IFNγ+/TNF+) of total CD3+ T cells after stimulation with the indicated peptide pools. Number of samples with positive signal above background were calculated by subtracting the total cytokine+ T cells response in the unstimulated samples from the total cytokine+ response in the stimulated samples. Significance calculated with unpaired t-test. (C) Representative flow cytometry plots of CD4+95+ or CD8+95+ T cells responding to spike peptide pool from the nasal mucosa of isotype control rhesus macaque, DHDI, at necropsy (dpi 28). Numbers in plots are the frequency of the gated cytokine+ in stimulated or unstimulated samples. (D) Quantification of frequency of cytokine+ (IFNγ+ and/or TNF+) CD4+95+ or CD8+95+ T cells responding to spike peptide stimulation at necropsy (dpi 28 or 35) from stimulated and unstimulated samples from the nasal mucosa. Significance calculated with a 2-way ANOVA and Sidak’s multiple comparison test between stimulated and unstimulated samples. (E) (Left) Representative flow cytometry plots of i.v. stain and Spike tetramer (H-2Kb Spike539-546) CD8+CD44+ T cells from the lung and nasal mucosa of mice infected with SARS-CoV-2 (B.1.351) at necropsy (dpi 30). Red shaded gate shows parenchymal (i.v. negative) Spike-specific CD8 T cells and grey shaded gate represents parenchymal (i.v. negative) non-antigen-specific CD8 T cells. (Right) Representative flow cytometry plots of CD69 and CD103 expression by parenchymal (i.v. negative) spike-specific (red dots) and non-specific (grey dots) CD8 T cells from the lung and nasal mucosa. Numbers in plots indicate the frequency within the quadrants. (F) Quantification of the frequency of parenchymal (i.v. negative) spike-specific CD8 T cells from the lung and nasal mucosa from mice infected with SARS-CoV-2 (B.1.351) at necropsy (dpi 30). Data shown from two separate experiments, squares represent one experiment and circles represent a second experiment. Nasal mucosa samples were pooled (n = 5) prior to staining and each experiment represented as one data point. (G) Quantification of the frequency of CD69-CD103- (grey bars), CD69+CD103- (dark blue bars), CD69-CD103+ (green bars), or CD69+CD103+ (turquoise bars), of parenchymal spike-specific CD8 T cells from the lungs and nasal mucosa of mice infected with SARS-CoV-2 (B.1.351) at necropsy (dpi 30).
Fig 6
Fig 6. IL-10 blockade impairs the differentiation and maintenance of SARS-CoV-2-specific Trm cells in the respiratory tract.
(A) Representative flow cytometry plots of CD69 and CD103 expression among nucleocapsid-specific CD4+ and CD8+ T cells at necropsy. Numbers in upper right represent the frequency of CD69+CD103+ gate. (B) Quantification of the frequency of CD69+CD103+ among spike-specific and nucleocapsid-specific CD4+ T cells and CD8+ T cells from BAL from day 7, 14, and necropsy (day 28 or 35) post-infection. Graph shows mean and SEM. (C) Representative flow cytometry plots of bulk CD4+95+ or CD8+95+ T cells with intravenous stain (i.v. stain) from the nasal mucosa of rhesus macaques infected with SARS-CoV-2 at necropsy. Numbers in plots indicate the frequency of i.v. stain negative. (D) The frequency of parenchymal (i.v.-) CD4+ or CD8+ T cells from the nasal mucosa of rhesus macaques infected with SARS-CoV-2 at necropsy. Significance calculated with 2-way ANOVA and Dunnett’s multiple comparison test. No i.v. stain data is available for animal ID: DHNA (αIL-10) and DHGW (rmIFNγR1-Ig). (E) Representative flow cytometry plots of parenchymal (i.v.-) CD4+ or CD8+ T cells expressing CD69 and CD103 from the nasal mucosa of rhesus macaques infected with SARS-CoV-2 at necropsy. Numbers in plots indicate the frequency within the quadrants. (F) Quantification of the frequency of CD69-CD103-, CD69+CD103-, CD69-CD103+, or CD69+CD103+ of parenchymal CD4+ or CD8+ T cells from the nasal mucosa of rhesus macaques infected with SARS-CoV-2 at necropsy (dpi 28 or 35). DHNA and DHGW not included, as above. Significance calculated with 2-way ANOVA and Dunnett’s multiple comparison test with isotype control.

Update of

References

    1. Pirofski LA, Casadevall A. Pathogenesis of COVID-19 from the Perspective of the Damage-Response Framework. mBio. 2020;11(4). doi: 10.1128/mBio.01175-20 - DOI - PMC - PubMed
    1. Nelson CE, Namasivayam S, Foreman TW, Kauffman KD, Sakai S, Dorosky DE, et al.. Mild SARS-CoV-2 infection in rhesus macaques is associated with viral control prior to antigen-specific T cell responses in tissues. Sci Immunol. 2022:eabo0535. doi: 10.1126/sciimmunol.abo0535 - DOI - PMC - PubMed
    1. Munster VJ, Feldmann F, Williamson BN, van Doremalen N, Perez-Perez L, Schulz J, et al.. Respiratory disease in rhesus macaques inoculated with SARS-CoV-2. Nature. 2020;585(7824):268–72. doi: 10.1038/s41586-020-2324-7 - DOI - PMC - PubMed
    1. Zhang Q, Bastard P, Liu Z, Le Pen J, Moncada-Velez M, Chen J, et al.. Inborn errors of type I IFN immunity in patients with life-threatening COVID-19. Science. 2020;370(6515). - PMC - PubMed
    1. Bastard P, Rosen LB, Zhang Q, Michailidis E, Hoffmann HH, Zhang Y, et al.. Autoantibodies against type I IFNs in patients with life-threatening COVID-19. Science. 2020;370(6515). doi: 10.1126/science.abd4585 - DOI - PMC - PubMed