Clinical Trial
. 2024 May 7;134(12):e180916.
doi: 10.1172/JCI180916.

Crizanlizumab for retinal vasculopathy with cerebral leukoencephalopathy in a phase II clinical study

Affiliations
Clinical Trial

Crizanlizumab for retinal vasculopathy with cerebral leukoencephalopathy in a phase II clinical study

Wilson X Wang et al. J Clin Invest. .

Abstract

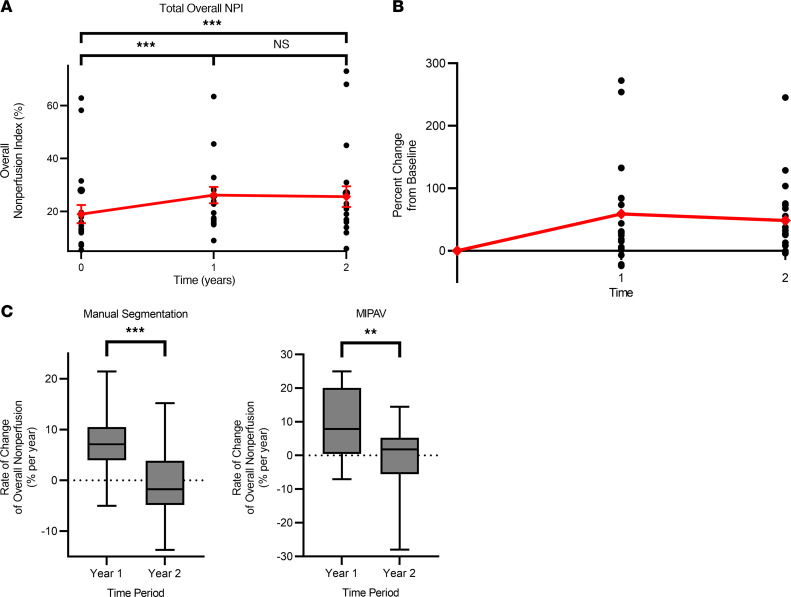
BackgroundRetinal vasculopathy with cerebral leukoencephalopathy and systemic manifestations (RVCL-S) is a rare, autosomal dominant, universally fatal disease without effective treatment options. This study explores the safety and preliminary efficacy of crizanlizumab, a humanized monoclonal antibody against P-selectin approved for the prevention of sickle cell crises, in slowing retinal nonperfusion and preserving vision in patients with RVCL-S.METHODSEleven patients with RVCL-S with confirmed exonuclease 3 prime repair exonuclease 1 (TREX1) mutations received monthly crizanlizumab infusions over 2 years. The study measured the nonperfusion index within 3 retinal zones and the total retina with fluorescein angiography, visual acuity, intraocular pressure (IOP), and optical coherence tomography central subfield thickness (CST) at baseline, 1 year, and 2 years. A mixed repeated-measures analysis was performed to assess the progression rates and changes from baseline.RESULTSEleven participants received crizanlizumab infusions. All of the participants tolerated crizanlizumab well, with 8 of 11 (72.7%) reporting mild adverse effects such as nausea, fatigue, and gastrointestinal symptoms. The change in total retinal nonperfusion was 7.22% [4.47, 9.97] in year 1 and -0.69% [-4.06, 2.68] in year 2 (P < 0.001). In the mid periphery, the change in nonperfusion was 10.6% [5.1, 16.1] in year 1 and -0.68% [-3.98, 5.35] in year 2 (P < 0.01), demonstrating a reduction in progression of nonperfusion in the second year of treatment. Visual acuity, IOP, and CST remained stable.CONCLUSIONCrizanlizumab has an acceptable safety profile. These results show promising potential for examining crizanlizumab in larger studies of RVCL-S and similar small-vessel diseases and for using the retina as a biomarker for systemic disease.Trial registrationClinicalTrials.gov NCT04611880.FUNDINGThe Clayco Foundation; DeNardo Education and Research Foundation Grant; Jeffrey T. Fort Innovation Fund; Siteman Retina Research Fund; unrestricted grant from Research to Prevent Blindness Inc.; National Heart,Lung, and Blood Institute (NHLBI), NIH (R01HL129241); National Institute of Neurological Disorders and Stroke (NINDS), NIH (RF1NS116565).

Keywords: Clinical trials; Ophthalmology; Retinopathy.


Conflict of interest statement

Conflict of interest: The authors have declared that no conflict of interest exists.

Figures

Figure 1
Figure 1. CONSORT diagram displaying the flow of RVCL-S patients through the 2-year protocol from initial assessment for eligibility to protocol completion with corresponding analyses performed.
Figure 2
Figure 2. logMAR and IOP values.
logMAR and IOP (mmHg) values for 22 RVCL-S patient eyes, with the mean ± SEM at baseline (blue) and year 2 (red).
Figure 3
Figure 3. OCT CST and logOCT values.
OCT CST and logOCT values for 22 RVCL-S patient eyes with mean ± SEM at baseline (blue) and year 2 (red).
Figure 4
Figure 4
(A) Overall NPI for all 20 eyes, with the unadjusted mean ± SEM (red) at each time point. (B) Percentage of change from each patient’s respective baseline, with the mean percentage change shown by the red line at each time point. (C) The rate of change of nonperfusion values is represented as a box-and-whisker plot, with bounds from the 25th to 75th percentiles, median line, and whiskers ranging from minimum to maximum values. The rates of change of the nonperfusion area during years 1 and 2 were determined by the manual segmentation and guided automatic methods using MIPAV. MMRM statistical analysis: **P < 0.01 and ***P < 0.001.
Figure 5
Figure 5. NPI values for the posterior pole, mid periphery, and far periphery.
NPI (percentage) with the mean ± SEM (red) at baseline, 1 year, and 2 years and the corresponding rate of change of nonperfusion values at each retinal zone according to the manual segmentation method at (A) the posterior pole, (B) the mid periphery, and (C) the far periphery. Rate-of-change values are represented as a box-and-whisker plot, with bounds from the 25th to 75th percentiles, the median line, and whiskers ranging from minimum to maximum values. MMRM statistical analysis: *P < 0.05, **P < 0.01, and ***P < 0.001.
Figure 6
Figure 6. MIPAV-guided segmentation of UWF images.
Original (top) and corresponding segmented (bottom) UWF images using MIPAV-guided automatic method at baseline (A), 1 year (B), and 2 years (C), showing the area of perfusion (green arrow), the TA outline (red arrow), the negative correction of area of perfusion (purple arrow), the negative correction of the TA (orange arrow), and the positive correction of the TA (yellow arrow).
Figure 7
Figure 7. Example image segmentation for a patient with RVCL-S.
(A) UWF fundoscopic image without segmentation. (B) UWF with concentric circles of radii 10 mm and 15 mm from the foveal avascular zone and areas enclosed delineate the retinal zones of the posterior pole (r between 0 mm and 10 mm), mid periphery (r between 10 mm and 15 mm), and far periphery (r >15 mm). (C) Manual segmentation of nonperfusion utilizing Optos software that quantifies the desired masked area. (D) MIPAV-guided automated method (also shown in Figure 6C) of quantification measuring the area of perfusion (green arrow), the outline of the TA (red arrow), negative correction of the TA (orange arrows), and positive correction of the TA (yellow arrow).

References

    1. de Boer I, et al. Retinal vasculopathy with cerebral leukoencephalopathy and systemic manifestations. GeneReviews. 2019 University of Washington, Seattle, September 19, - PubMed
    1. Richards A, et al. C-terminal truncations in human 3′-5′ DNA exonuclease TREX1 cause autosomal dominant retinal vasculopathy with cerebral leukodystrophy. Nat Genet. 2007;39(9):1068–1070. doi: 10.1038/ng2082. - DOI - PubMed
    1. Stam AH, et al. Retinal vasculopathy with cerebral leukoencephalopathy and systemic manifestations. Brain. 2016;139(11):2909–2922. doi: 10.1093/brain/aww217. - DOI - PMC - PubMed
    1. Wang WX, et al. Multimodal structural and functional characterization of retinal vasculopathy and cerebral leukoencephalopathy. Ophthalmol Retina. 2024;8(4):331–339. doi: 10.1016/j.oret.2023.10.013. - DOI - PubMed
    1. Wilms AE, et al. Retinal vasculopathy with cerebral leukoencephalopathy and systemic manifestations (RVCL-S): an update on basic science and clinical perspectives. Cereb Circ Cogn Behav. 2022;3:100046. doi: 10.1016/j.cccb.2022.100046. - DOI - PMC - PubMed

Publication types

MeSH terms

Substances

Associated data