. 2024 Jun 17;134(12):e177172.
doi: 10.1172/JCI177172.

Frameshift variants in C10orf71 cause dilated cardiomyopathy in human, mouse, and organoid models

Affiliations

Frameshift variants in C10orf71 cause dilated cardiomyopathy in human, mouse, and organoid models

Yang Li et al. J Clin Invest. .

Abstract

Research advances over the past 30 years have confirmed a critical role for genetics in the etiology of dilated cardiomyopathies (DCMs). However, full knowledge of the genetic architecture of DCM remains incomplete. We identified candidate DCM causal gene, C10orf71, in a large family with 8 patients with DCM by whole-exome sequencing. Four loss-of-function variants of C10orf71 were subsequently identified in an additional group of492 patients with sporadic DCM from 2 independent cohorts. C10orf71 was found to be an intrinsically disordered protein specifically expressed in cardiomyocytes. C10orf71-KO mice had abnormal heart morphogenesis during embryonic development and cardiac dysfunction as adults with altered expression and splicing of contractile cardiac genes. C10orf71-null cardiomyocytes exhibited impaired contractile function with unaffected sarcomere structure. Cardiomyocytes and heart organoids derived from human induced pluripotent stem cells with C10orf71 frameshift variants also had contractile defects with normal electrophysiological activity. A rescue study using a cardiac myosin activator, omecamtiv mecarbil, restored contractile function in C10orf71-KO mice. These data support C10orf71 as a causal gene for DCM by contributing to the contractile function of cardiomyocytes. Mutation-specific pathophysiology may suggest therapeutic targets and more individualized therapy.

Keywords: Cardiology; Cardiovascular disease; Genetic diseases; Genetic variation; Genetics.


Figures

Figure 1
Figure 1. Frameshift mutations of C10orf71 are associated with DCM.
(A) Identification of a C10orf71 variant segregating with DCM in a multigenerational family. d, death; DX, diagnosis; T, treatment; ICD, implantable cardioverter–defibrillator. (B) De novo C10orf71 variants identified in 3 probands from Anzhen DCM cohort.
Figure 2
Figure 2. C10orf71 is an intrinsically disordered protein specifically expressed in CMs.
(A) Result of folding prediction for the human full-length C10orf71 with PSIPRED. (B) Relative mRNA levels of mC10orf71 in various adult mouse tissues; error bars indicate SD (n = 3). (C) Relative mRNA levels of mC10orf71 during mouse heart development (n = 6). (D) TNNT2, MYH7, and C10orf71 expression levels in each cell type of human heart. (E and F) Representative images showing double immunofluorescence staining of the CMs from C57BL/6 mice (E) and iPSCs (F). ACTN2 and ACTC1 are the markers for Z disc and myofibers, respectively. DAPI, nuclei stain, blue. A1/A2 indicates 2 independent duplicate samples. Scale bars: 25 μm.
Figure 3
Figure 3. Phenotypes of embryonic heart in mC10orf71–/– mice.
(A) Relative mRNA levels of mC10orf71 in E18.5 hearts (n = 6 per group). ***P < 0.001 in t test. (B) Relative mRNA levels of transcription factors in E13.5 and E18.5 hearts (n = 6 per group). NS, no significance in t test. (C) Representative H&E images for embryonic hearts (first line) and immunofluorescence staining of N-cadherin (green), alpha-actinin (red), and DAPI (blue) in heart apex, left ventricle (LV) and right ventricle (RV) (line 2–4). Scale bar: 200 μm (first line), 20 μm (lines 2–4). (D) Compaction degree of left and right ventricle shown in panel C (n = 4 for WT and n = 5 for mC10orf71–/–). *P < 0.05 in Mann-Whitney test. (E) The relative signal intensity of α-actinin and N-cadherin shown in panel C. *P < 0.05 in Kruskal-Wallis combined with Dunn’s multiple comparisons test. (F) Positive signal of Ki67 in embryonic hearts. The compact layer refers to the area between the dashed line and the epicardium as defined by higher cell density. Scale bar: 200 μm (first line), 50 μm (lines 2–4). (G) Statistical results of panel F: *P < 0.05, **P < 0.01 in Kruskal-Wallis combined with Dunn’s multiple comparisons test. Each dot in panel A, B and D represents 1 biological repeat. Each dot in panel E and G represents 1 region of a heart, and each mouse has 3 dots. Data is represented as mean ± SD.
Figure 4
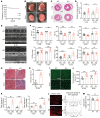
Figure 4. Phenotypes of heart in adult mC10orf71–/– mice.
(A) Survival rate of WT and mC10orf71–/– (n = 10 per group) mice. (B) A photograph of hearts from 4 and 8-month-old mice (4 mo; 8 mo). Scale bar: 2.5 mm.(C) Histological analysis of hearts by H&E staining. Scale bar: 2 mm. (D) Quantification of cross-sectional area of left ventricle shown in panel C (n = 10 per group at 4 months; n = 7–8 at 8 months). *P < 0.05, **P < 0.01 in t test. (E) Representative echocardiographic images. (F) Echocardiographic parameters (n = 16 per group at 4 months; n = 7–8 at 8 months). EF, ejection fraction; FS, fraction shortening; SV, stroke volume; LVID-s, internal dimension of left ventricle at end systole; LVVOL-s, left ventricular volume at end-systole; LVPW-s, posterior wall thickness of LV at end-systole. **P < 0.01, ***P < 0.001 in t test. (G) Masson staining of hearts. Scale bar: 150 μm. (H) Quantification of fibrosis area at 8 months shown in panel G. ***P < 0.001 in t test. (I) WGA staining of hearts. (J) Quantification of cross-sectional area of CMs shown in panel I (n = 10 per group at 4 months; n = 7–8 at 8 months, n = 250–350 cells per mouse). ***P < 0.001 in t test. Scale bar: 20 μm. (K) Relative mRNA levels of Acta1 and Nppb in hearts (n = 5 per group at 4 months; n = 7–8 at 8 months). **P < 0.01 in Mann-Whitney test. ***P < 0.001 in t test. (L and M) TT power analyses of the sarcomere organization were carried out with TTorg plugin in ImageJ. TTorg workflow of the sample images: magnification of an original image, 2D fast Fourier transformation (FFT) spectrum of the image, grey level profile of the FFT spectrum and analysis results. AU, arbitrary units. Each dot represents 1 biological repeat. Data is represented as mean ± SD.
Figure 5
Figure 5. C10orf71 deletion affects the expression and splicing of contractile genes.
(A) Heatmap of expression values for genes related to energy generation. (BE) Heatmap of expression values for genes related to fatty acid metabolism (B), sarcomere (C), Ca2+ cycling/SR (D), and ion channels (E). (FH) IGV view showing normalized accessibility of promoters of target genes. (I) qPCR validation of expression changes of Ttn, Tnnt2, and Rbm20 shown in K (n = 12–14). ***P < 0.001 in t test. (J and K) IGV view showing reads mapping to exons of Ttn and Tnnt2 (J) and RT-PCR validation of alternative splicing (K). Each dot represents 1 biological repeat. Data represent means ± SD.
Figure 6
Figure 6. C10orf71-defective CMs exhibit impaired contractile function.
(A) Representative images for cells used in IonOptix measurements. (B) Quantification of CM width shown in panel A (n = 48–50). ***P < 0.001 in t test. (C) Representative traces of sarcomere shortening in paced ventricular myocytes isolated from WT and KO mice. (D) Sarcomere shortening (expressed as the percentage of resting sarcomere length, SL), departure velocity, and return velocity in WT and KO CMs. *P < 0.05, **P < 0.01 in t test. (E) Relative mRNA levels of C10orf71 during WT1 hiPSC-CMs differentiation (n = 3 independent differentiations). (F) Representative images showing immunofluorescence staining of pluripotent markers (OCT4 and SOX2) in WT1 and Mut1 iPSCs. DAPI, nuclei stain, blue. Scale bar: 100 μm. (G) Representative images for WT1 and Mut1 monolayer hiPSC-CMs sheets. (H) Relative mRNA levels of TTN, TNNT2, MYH7, and ACTN2 during WT1 and Mut1 hiPSC-CMs differentiation (n = 3 independent differentiations). *P < 0.05, **P < 0.01, ***P < 0.001 in 2-way ANOVA followed by Šidák’s post hoc test. (I) MEA parameters for WT1 and Mut1 hiPSC-CMs differentiated for 40 days, including beat amplitude, beat period, and excitation-contraction delay (n = 18 for WT1 and n = 26 for Mut1). **P < 0.01, t test. *P < 0.05 in Mann-Whitney test. (J) Morphological changes of iPSC-HO at differentiation stages. Scale bar: 1 mm. (K) Contractility based on dynamic morphological information (n = 9 for WT1 and n = 12 for Mut1). ***P < 0.001 in t test. (L) FP waveforms of WT1 and Mut1 iPSC-HO. (M) MEA parameters for WT1 and Mut1 iPSC-HO, including beat amplitude, beat period, and excitation-contraction delay (n = 8 for WT1 and n = 7 for Mut1). *P < 0.05, t test. Each dot represents 1 biological repeat. Data represent mean ± SD.
Figure 7
Figure 7. OM rescues cardiac contractile dysfunction caused by C10orf71 deficiency.
(A) Flow chart of OM treatment and echocardiographic testing. (BF) Echocardiographic parameters (n = 5 males and 5–6 females per group at 0, 7, 14 days after OM treatment). EF, ejection fraction; FS, fraction shortening; SV, stroke volume; LVID-s, internal dimension of left ventricle at end-systole; LVVOL-s, left ventricular volume at end-systole; LVPW-s, posterior wall thickness of LV at end-systole. *P < 0.05, ***P < 0.001 in t test. (G) A photograph of hearts from OM treated and control mice. Scale bar: 2 mm. (H) Quantification of maximum width of the hearts shown in panel G (n = 5 males per group). *P < 0.05 in Mann-Whitney test. (I) WGA staining of hearts from OM treated and control mice. Scale bar: 50 μm. (J) Quantification of cross-sectional area of CMs shown in panel I (n = 5 males per group, n = 250–300 cells per mouse). *P < 0.05, **P < 0.01 in Kruskal-Wallis combined with Dunn’s multiple comparisons test. Each dot represents 1 biological repeat. Data represent mean ± SD.

References

    1. Elliott P, et al. Classification of the cardiomyopathies: a position statement from the European Society Of Cardiology Working Group on Myocardial and Pericardial Diseases. Eur Heart J. 2008;29(2):270–276. doi: 10.1093/eurheartj/ehm342. - DOI - PubMed
    1. Khalil H, Alzahrani T. Cardiomyopathy imaging. In: StatPearls. StatPearls Publishing; 2020. - PubMed
    1. McKenna WJ, Judge DP. Epidemiology of the inherited cardiomyopathies. Nat Rev Cardiol. 2021;18(1):22–36. doi: 10.1038/s41569-020-0428-2. - DOI - PubMed
    1. Marian AJ, Braunwald E. Hypertrophic cardiomyopathy: genetics, pathogenesis, clinical manifestations, diagnosis, and therapy. Circ Res. 2017;121(7):749–770. doi: 10.1161/CIRCRESAHA.117.311059. - DOI - PMC - PubMed
    1. Hershberger RE, et al. Clinical and genetic issues in dilated cardiomyopathy: a review for genetics professionals. Genet Med. 2010;12(11):655–667. doi: 10.1097/GIM.0b013e3181f2481f. - DOI - PMC - PubMed

Substances