. 2024 Oct;17(5):973-989.
doi: 10.1016/j.mucimm.2024.06.010. Epub 2024 Jun 29.

Inflammation of the nasal mucosa is associated with susceptibility to experimental pneumococcal challenge in older adults

Affiliations

Inflammation of the nasal mucosa is associated with susceptibility to experimental pneumococcal challenge in older adults

Britta C Urban et al. Mucosal Immunol. 2024 Oct.

Abstract

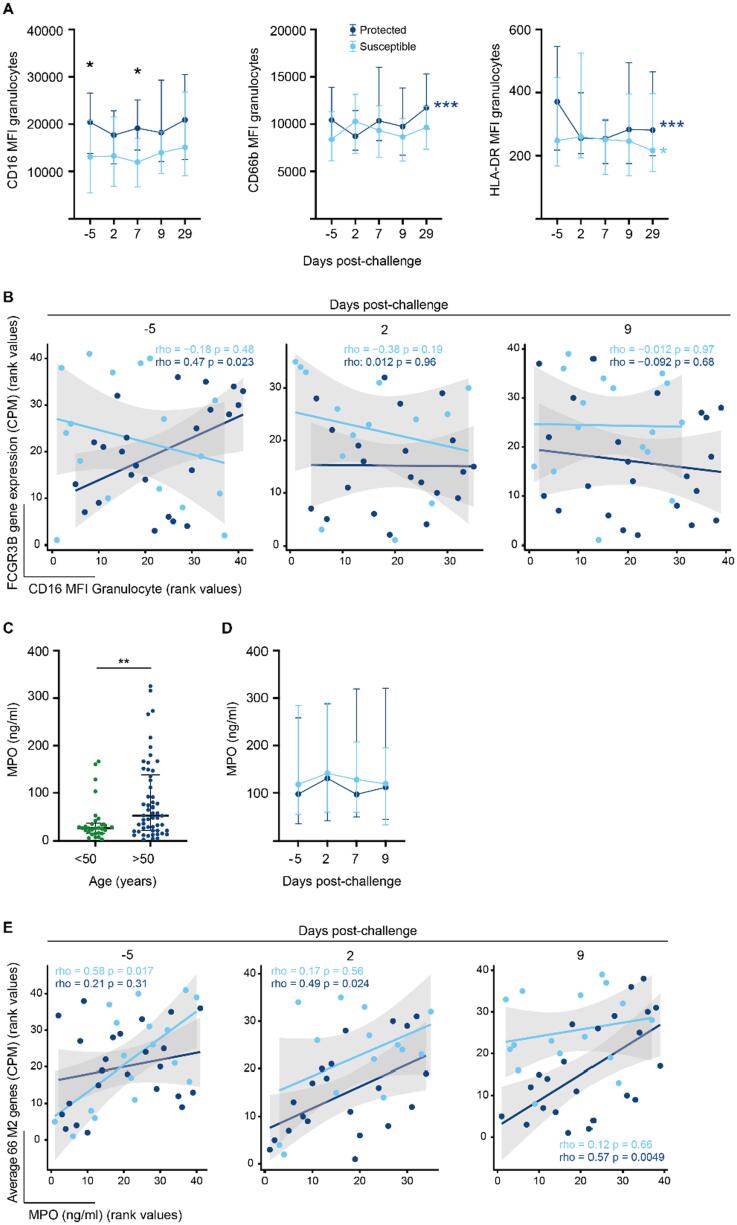
Streptococcus pneumoniae colonization in the upper respiratory tract is linked to pneumococcal disease development, predominantly affecting young children and older adults. As the global population ages and comorbidities increase, there is a heightened concern about this infection. We investigated the immunological responses of older adults to pneumococcal-controlled human infection by analyzing the cellular composition and gene expression in the nasal mucosa. Our comparative analysis with data from a concurrent study in younger adults revealed distinct gene expression patterns in older individuals susceptible to colonization, highlighted by neutrophil activation and elevated levels of CXCL9 and CXCL10. Unlike younger adults challenged with pneumococcus, older adults did not show recruitment of monocytes into the nasal mucosa following nasal colonization. However, older adults who were protected from colonization showed increased degranulation of cluster of differentiation 8+ T cells, both before and after pneumococcal challenge. These findings suggest age-associated cellular changes, in particular enhanced mucosal inflammation, that may predispose older adults to pneumococcal colonization.


Figures

Fig. 1
Fig. 1
Gene expression analysis of nasal cells showed distinct patterns in older adults susceptible to carriage before pneumococcal challenge. (A) Gene set variation analysis (GSVA) of immune response pathways of nasal cells collected before (day −5) and after (day 2, day 9) pneumococcal challenge of older and (B) younger study participants who were protected (carriage-negative) or susceptible (carriage-positive), (C) older study participants between 50 to 64 years old who were protected (carriage-negative) or susceptible (carriage-positive), (D) older study participants over 65 years old who were protected (carriage-negative) or susceptible (carriage-positive). Based on Euclidean distance calculation, we identified three groups: group I contains gene sets associated predominantly with innate immune responses, group II and III are enriched for gene sets associated with antibody-mediated and adaptative immune responses, respectively. CD = cluster of differentiation; MHC = Major histocompatibility complex
Fig. 2
Fig. 2
Co-expression analysis of nasal cell transcripts by carriage status before and after pneumococcal challenge. (A) Co-expressed genes were determined by CEMiTool (Co-Expression Module identification Tool), assessing normalized gene expression profile by carriage status (susceptible and protected) before (day −5) and after (days 2 and 9) pneumococcal challenge. Over-Representation Analysis (enrichr function from R package clusterProfiler) was used to determine the biological function of each module genes using Reactome database (level 3 gene sets). Gene Set Enrichment Analysis (GSEA) tool and z-score values for each gene across all timepoints were used to determine whether module genes were positively (positive NES values) or negatively (negative NES values) enriched. Overexpression analysis is shown for all older adults (all ages), 50-64 years old and over 65 years old study participants. (B) Heatmap showing log2 fold-change of overexpressed genes within each pathway before and after pneumococcal challenge (susceptible vs protected samples) for all older adults (all ages), 50–64 years old and over 65 years old study participants. Criteria of differentially expressed genes were absolute log2 fold-change >1 and non-adjusted p value <0.05.
Fig. 3
Fig. 3
Changes in cytokine concentration in the nasal lining fluid of older adults experimentally challenged with S. pneumoniae 6B. (A) Line graphs showing the median and interquartile range of cytokine concentrations in the nasal lining fluid in older study participants before (day −5) and after (day 2, day 7, and day 9) pneumococcal challenge in susceptible (light blue line, n = 22) and protected (dark blue line, n = 35) study participants. In protected study participants, the concentration of IL-15 was higher at day 9 (Mann-Whitney U test, *p = 0.0344), and in susceptible study participants concentration of CXCL10 (IP-10) was higher at day −5 and day 2 (Mann-Whitney U test, *p = 0.00116, **p = 0.0044) and the concentration of CXCL9 (MIG) was higher at day −5 (Mann-Whitney U test, *p = 0.0419). No differences were observed for CCL2 (MCP-1). (B) Line graphs showing the median and interquartile range of cytokine normalized gene expression (CPM = counts per million) in older study participants before (day −5) and after (day 2, and day 9) pneumococcal challenge in susceptible (light blue line, n = 18) and protected (dark blue line, n = 24) study participants. In susceptible study participants normalized gene expression of CXCL10 (IP-10) and CXCL9 (MIG) was higher at day −5 (DESeq2 Wald test, *p = 0.00303, *p = 0.0210, respectively), and CCL2 was higher at day 9 (DESeq2 Wald test, ***p = 0.000218). No differences were observed for IL-15. (C) Heatmap depicting log2 fold-change at day 2, 7, and 9 relative to baseline (day −5) samples for all older adults (all ages), 50–64 years old and over 65 years old study participants. The cytokines were grouped based on function: adaptive, anti-inflammatory, chemokines, growth factors, and pro-inflammatory responses. The statistical test performed was the non-parametric Wilcoxon test. One asterisk (*) indicates p value <0.05, and two asterisk (**) for p value <0.01. IFN = interferon; IL = Interleukins.
Fig. 4
Fig. 4
Recruitment of monocytes into the nasal mucosa of susceptible older adults is impaired. (A), In nasal micro-biopsies, the number of leukocytes, granulocytes and monocytes was comparable between younger (green, n = 91) and older adults (blue, n = 38) before pneumococcal challenge (day −5). Cell numbers of each leukocyte subset were normalized to epithelial cells as a ratio to account for differences in the total number of cells obtained for each biopsy. (B–D), Line graphs showing median and interquartile range of leukocytes, (B), granulocytes (C), and monocytes (D) in younger and older study participants before (day −5) and after (day 2, day 7, day 9, and day 29) pneumococcal challenge in susceptible (young: light green n = 28; old: light blue line, n = 22) and protected (young: dark green, n = 39; old: dark blue line, n = 35) study participants. The proportion of monocytes increased at day 9 after challenge in susceptible compared to protected younger adults (Mann Whitney U test, *p = 0.0122). This recruitment of monocytes into the nasal mucosa was not observed in susceptible older adults (n = 15). (E), Deconvolution analysis of granulocytes and myeloid cells using CIBERSORTx. Normalized gene expression log2 CPM (Counts Per Million) and granulocytes and monocytes databases were used to determine the estimated cell population proportion. BN = band neutrophils; CD = cluster of differentiation; CD141 = CD141+ dendritic cells; CD1c-CD141-dendritic cells = double negative; CD1C = CD1c+ dendritic cells; MM = metamyelocytes; mono = monocytes; pDC = plasmacytoid dendritic cells; PMN = polymorphonuclear; P/M = promyelocytes/myelocytes; SN = segmented neutrophils.
Fig. 5
Fig. 5
Granulocytes are activated in older adults susceptible to pneumococcal colonization. (A), Line graph (median and interquartile range) of expression levels of CD16, CD66b and HLA-DR on granulocytes before (day −5) and after challenge (day 2, day 7, day 9, and day 29) in protected (dark blue, n = 34) and susceptible (light blue, n = 22) older adults. The expression level of CD16 was significantly lower on nasal granulocytes at baseline and day 7 (Mann Whitney U test, baseline: p = 0.034, day 7: p = 0.014). Expression levels of CD66b changed significantly over time in protected older study participants (Friedman statistic 22.67, p = 0.0001) and for HLA DR in both protected (Friedman statistic 19.14, p = 0.0007) and susceptible (Friedman statistic 9.7, p = 0.044) study participants. (B), Correlation between expression levels of FCGR3B gene expression and CD16 on the surface of granulocytes at baseline (day −5), day 2 and day 9 in protected and susceptible study participants. (C), At baseline (day −5), the concentration of MPO (Myeloperoxidase) in nasal lining fluid in older adults (n = 54) was higher than in younger adults (n = 30). Shown are dot plots with median and interquartile range, Mann Whitney U test **p = 0.0085. (D), The concentration of MPO did not change after pneumococcal challenge in older study participants who became susceptible (light blue, n = 22) or remained protected (dark blue, n = 33). Line graph showing median and interquartile range of MPO concentration before and after inoculation with pneumococcus. (E), Correlation between expression levels of 66 M2 module genes associated with the Reactome pathway “neutrophil degranulation” and MPO concentration in nasal lining fluid at baseline (day −5), day 2 and day 9 in protected and susceptible study participants. CD = cluster of differentiation.
Fig. 6
Fig. 6
Expression of CD14 and CD16 is increased on monocytes of protected study participants. Line graph (median and interquartile range) of expression levels of CD14, CD16, and Human Leukocyte Antigen DR (HLA-DR) on monocytes before (day −5) and after challenge (day 2, day 7, day 9, and day 29) in protected (dark blue, n = 25) and susceptible (light blue, n = 14) older adults. The expression level of CD14 was significantly lower on nasal monocytes at baseline (Mann Whitney U test, baseline: p = 0.0019). The expression levels of CD14 and CD16 changed over time in both protected (CD14: Friedman statistic 18.01 p = 0.0012; CD16: Friedman statistic 27.98 p < 0.0001) and susceptible study participants (CD14: Friedman statistic 29.64, p < 0.0001; CD16 Friedman statistic 18.44, p = 0.001). CD = cluster of differentiation.
Fig. 7
Fig. 7
T cells are reduced in the nasal mucosa of older adults compared to younger adults. (A), In nasal microbiopsies, the number of CD3+ T cell subsets (as a log10 ratio with endothelial cells) is greatly reduced in older adults (blue) compared to younger adults (green) before pneumococcal challenge (day −5). (B), CD8+ and TCRVα7.2 CD8+ T cells are significantly lower in older compared to younger adults before pneumococcal challenge. Shown are dot blots of CD4+ T cells (younger adults n = 43, older adults n = 38), CD8+ T cells, TCRVα7.2 cells and DN T cells as percentage of CD3+ T cells, Mann Whitney U test, ***p < 0.001, ****p < 0.0001; (C), Expression levels of CD107a, PD1 and HLA DR on CD8+, CD4+ and TCRVα7.2 CD8+ T cells before and after challenge with Spn6B in protected (dark blue) and susceptible (light blue) older study participants. Line graphs show median and interquartile range at day −5 before and day 2, day 7 day 9 and day 29 after pneumococcal challenge. Mann Whitney U test *p < 0.05, **p < 0.01. CD = cluster of differentiation.

References

    1. Schneider J.L., et al. The aging lung: physiology, disease, and immunity. Cell. 2021;184:1990–2019. - PMC - PubMed
    1. Häder A., et al. Respiratory infections in the aging lung: implications for diagnosis, therapy, and prevention. Aging Dis. 2023;14:1091–1104. - PMC - PubMed
    1. Ghosh T.S., Shanahan F., O’Toole P.W. Toward an improved definition of a healthy microbiome for healthy aging. Nat. Aging. 2022;2:1054–1069. - PMC - PubMed
    1. Fulop T., et al. Immunology of aging: the birth of inflammaging. Clin. Rev. Allergy Immunol. 2023;64:109–122. - PMC - PubMed
    1. Goronzy J.J., Weyand C.M. Mechanisms underlying T cell ageing. Nat. Rev. Immunol. 2019;19:573–583. - PMC - PubMed

MeSH terms