. 2024 Jul;14(7):e1749.
doi: 10.1002/ctm2.1749.

Low-intensity pulsed ultrasound improves myocardial ischaemia‒reperfusion injury via migrasome-mediated mitocytosis

Affiliations

Low-intensity pulsed ultrasound improves myocardial ischaemia‒reperfusion injury via migrasome-mediated mitocytosis

Ping Sun et al. Clin Transl Med. 2024 Jul.

Abstract

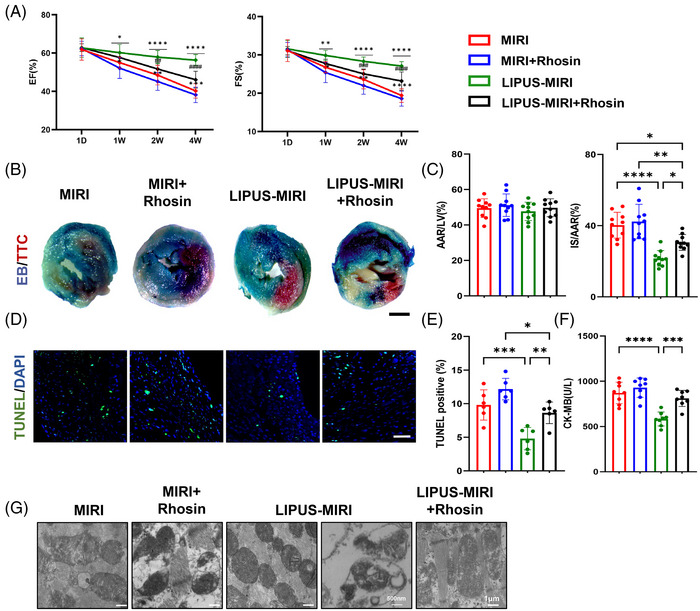
During myocardial ischaemia‒reperfusion injury (MIRI), the accumulation of damaged mitochondria could pose serious threats to the heart. The migrasomes, newly discovered mitocytosis-mediating organelles, selectively remove damaged mitochondria to provide mitochondrial quality control. Here, we utilised low-intensity pulsed ultrasound (LIPUS) on MIRI mice model and demonstrated that LIPUS reduced the infarcted area and improved cardiac dysfunction. Additionally, we found that LIPUS alleviated MIRI-induced mitochondrial dysfunction. We provided new evidence that LIPUS mechanical stimulation facilitated damaged mitochondrial excretion via migrasome-dependent mitocytosis. Inhibition the formation of migrasomes abolished the protective effect of LIPUS on MIRI. Mechanistically, LIPUS induced the formation of migrasomes by evoking the RhoA/Myosin II/F-actin pathway. Meanwhile, F-actin activated YAP nuclear translocation to transcriptionally activate the mitochondrial motor protein KIF5B and Drp1, which are indispensable for LIPUS-induced mitocytosis. These results revealed that LIPUS activates mitocytosis, a migrasome-dependent mitochondrial quality control mechanism, to protect against MIRI, underlining LIPUS as a safe and potentially non-invasive treatment for MIRI.

Keywords: low‐intensity pulsed ultrasound; mitochondria; mitocytosis; myocardial ischaemia‒reperfusion injury.


Conflict of interest statement

The authors declare they have no conflicts of interest.

Figures

FIGURE 1
FIGURE 1
Low‐intensity pulsed ultrasound (LIPUS) therapy ameliorated myocardial ischaemia‒reperfusion injury (MIRI) and cardiac dysfunction in mice. (A) Study flowchart. (B‒D) Representative M‐mode echocardiograms. Graphs showing the time course of left ventricular ejection fraction (LVEF) (1W: p = 0.0406; 2W: p = 0.00004; 4W: p < 0.0001) and left ventricular fractional shortening (LVFS) (1W: p = 0.0052; 2W: p = 0.0002; 4W: p < 0.0001; *MIRI‐no LIPUS group vs. MIRI + LIPUS group), left ventricular end‐systolic anterior wall thickness (LVAWs) (p = 0.0009) and left ventricular end‐diastolic anterior wall thickness (LVAWd) 4 week after MIRI (n = 10). (E and F) Representative images of Evans blue/TTC staining and quantification of infarct size (IS) (scale bar, 1 mm, p = 0.0007, n = 10). (G and H) TUNEL immunofluorescence staining identifies apoptotic cells, followed by 4',6‐diamidino‐2‐phenylindole (DAPI) staining (scale bar, 100 µm, n = 6). (I) Serum creatine kinase isoenzymes (CK‐MB) levels at 3 days after MIRI onset (n = 8). Results are expressed as mean ± standard deviation (SD). Comparisons of parameters were performed with analysis of variance (ANOVA) followed by Tukey's test for multiple comparisons; *** p <0.001; **** p < 0.0001.
FIGURE 2
FIGURE 2
Low‐intensity pulsed ultrasound (LIPUS) therapy refined mitochondrial homeostasis in vitro. (A) The percentage of JC‐1 green/red ratio in AC16 and HUVEC cells were calculated. (B) The production of reactive oxygen species (ROS) was measured in AC16 and HUVEC cells using a fluorescence microplate reader to determine the fluorescence intensity of 2,7‐dichlorodihydrofluorescein diacetate (DCFH‐DA) (A and B, n = 6). (C) Cellular oxygen consumption rate (OCR) levels at the indicated times from the basal level following the presence of the indicated drugs. Oligomycin, carbonyl cyanide 4‐(trifluoromethoxy) phenylhydrazone (FCCP), antimycin A and rotenone. (D) Indices of mitochondrial respiration calculated according to the OCR profiles: basal respiration, maximal respiration, adenosine triphosphate (ATP) production and spare respiration capacity in AC16 cells (n = 3). (E) Representative transmission electron microscopy (TEM) images of AC16 cells and HUVECs. Scale bar, 1 µm. Upper right panels, enlarged region of interest (ROI). Scale bar, 500 nm. (F) Quantification of abnormal mitochondria in the cells. n = 30 cells from three independent experiments. Results are expressed as mean ± standard deviation (SD). Comparisons of parameters were performed with analysis of variance (ANOVA) followed by Tukey's test for multiple comparisons in (A‒D). Two‐tailed unpaired t‐tests were used for statistical analysis in (E) and (F).
FIGURE 3
FIGURE 3
Low‐intensity pulsed ultrasound (LIPUS) facilitated migrasomes formation and damaged mitochondria expelling in a migrasome‐regulated manner in vitro. (A) Representative transmission electron microscopy (TEM) images of AC16 cells and HUVECs. Scale bar, 500 nm. Right panels, enlarged ROI. Scale bar, 200 nm. (B and C) AC16 cells and HUVECs were stained with WGA for migrasomes visualisation. Representative images of confocal microscopy and the migrasomes number of each cell. n = 120. Scale bar, 20 µm. (D and E) Western blot analysis for the migrasomes markers of indicated AC16 cells (N = 3 independent repeats). (F) Western blot analysis for the mitochondrial related proteins of indicated cardiomyocytes and migrasomes isolated from AC16 cells (N = 3 independent repeats). (G) Representative TEM images of cardiac tissue. Scale bar, 1 µm. Upper right panels, enlarged ROI. Scale bar, 500 nm. (H) Confocal image of AC16 cells stained with WGA, MitoSOX or MitoRed. Scale bar, 20 µm. Results are expressed as mean ± standard deviation (SD). Comparisons of parameters were performed with analysis of variance (ANOVA) followed by Tukey's test for multiple comparisons.
FIGURE 4
FIGURE 4
Inhibition of migrasome formation weakened the therapeutic effect of low‐intensity pulsed ultrasound (LIPUS) on myocardial ischaemia‒reperfusion injury (MIRI). (A) Echocardiogram measurement in LIPUS‐TSPAN CKO MIRI mice treated with LIPUS (left ventricular ejection fraction [LVEF]—1W: * p = 0.0316; 2W: * p = 0.0004; 4W: * p < 0.0001; * p = 0.0069; # p = 0.0032; left ventricular fractional shortening [LVFS]—1W: * p = 0.0196; 2W: * p = 0.0002; * p = 0.0452; # p = 0.0434; 4W: * p < 0.0001; * p = 0.0037; # p = 0.0017, n = 10). (B and C) Representative images of Evans blue/TTC staining and quantification of area at risk (AAR) and infarct size (IS) in LIPUS‐TSPAN CKO MIRI mice treated with LIPUS (scale bar, 1 mm, p = 0.043, n = 10). (D) Representative transmission electron microscopy (TEM) images of cardiac tissue. Scale bar, 1 µm. (E) Echocardiogram measurements in LIPUS‐TSPAN EKO MIRI mice treated with LIPUS (LVEF—1W: * p = 0.0150; # p = 0.0161; 2W: * p < 0.0001; # p = 0.0451; 4W: * p < 0.0001; # p = 0.0014, n = 10). (F and G) Representative images of Evans blue/TTC staining and quantification of AAR and IS in LIPUS‐TSPAN EKO MIRI mice treated with LIPUS (scale bar, 1 mm, p = 0.0001; p = 0.0086, n = 10). (H) Representative TEM images of cardiac tissue. Scale bar, 1 µm. Results are expressed as mean ± standard deviation (SD). Comparisons of parameters were performed with analysis of variance (ANOVA) followed by Tukey's test for multiple comparisons (* p < 0.05; *** p < 0.001; **** p < 0.0001; ** p < 0.01; *** p < 0.001; # p < 0.05; ## p < 0.01; *MIRI group vs. LIPUS‐MIRI group; *TSPAN C(E)KO‐MIRI group vs. LIPUS‐TSPAN C(E)KO MIRI group; #LIPUS‐MIRI group vs. LIPUS‐TSPAN C(E)KO MIRI group).
FIGURE 5
FIGURE 5
Low‐intensity pulsed ultrasound (LIPUS) evoked RhoA/Myosin II/F‐actin activation and YAP nucleation for KIF5B and Drp1 transcripting. (A) Volcano plot displaying differentially expressed genes (DEGs) between AC16 cells post‐I/R irradiated with or without LIPUS. Upregulated and downregulated DEGs are highlighted in red and green, respectively. FC, fold change. (B) Results of the gene set Gene Ontology (GO) enrichment analysis of the RNA sequencing data. (C) Western blot analysis of myocardial ischaemia‒reperfusion injury (MIRI) mice treated with or without LIPUS (N = 3 independent repeats). (D) Results of the gene set Kyoto Encyclopedia of Genes and Genomes (KEGG) enrichment analysis of the RNA sequencing data. (E) Western blot analysis of MIRI mice treated with or without LIPUS (N = 3 independent repeats). (F and G) mRNA expression analysis by RT‐qPCR in cardiac tissue of MIRI mice and AC16 cells post‐I/R and treated with LIPUS (n = 3). (H) Drp1 and KIF5B occupancy analysis by anti‐TEAD and ChIP‐qPCR in AC16 cells (n = 3). (I) Immunofluorescence co‐staining with KIF5B (red) and microtublin (green) in AC16 cells. Immunofluorescence staining with Drp1 (green) and F‐actin (red) in AC16 cells. Scale bar, 50 µm. (J) Western blot analysis for the mitochondrial related proteins of indicated cardiomyocytes and migrasomes isolated from cardiomyocytes with or without KIF5B si‐RNA transfection in AC16 cells (N = 3 independent repeats). Results are expressed as mean ± standard deviation (SD). Two‐tailed unpaired t‐tests were used for statistical analysis in (A) and (B). Comparisons of parameters were performed with analysis of variance (ANOVA) followed by Tukey's test for multiple comparisons in (C) and (D).
FIGURE 6
FIGURE 6
Absence of the beneficial effects of low‐intensity pulsed ultrasound (LIPUS) on myocardial ischaemia‒reperfusion injury (MIRI) improvement and damaged mitochondria ejection in mice with RhoA inhibition. (A) Echocardiogram measurements in MIRI mice treated with Rhosin and LIPUS (left ventricular ejection fraction [LVEF]—1W: * p = 0.0235; *p = 0.0155; 2W: * p < 0.0001; * p = 0.0026; # p = 0.0049; 4W: * p < 0.0001; * p = 0.0001; # p < 0.0001; left ventricular fractional shortening [LVFS]—1W: * p = 0.0022; * p = 0.0324; 2W: * p < 0.0001; * p = 0.0024; # p = 0.0010; 4W: * p < 0.0001; * p < 0.0001; # p < 0.0001; left ventricular end‐systolic anterior wall thickness [LVAWs]—p = 0.0006; *MIRI group vs. LIPUS‐MIRI group; p = 0.0226; *LIPUS‐MIRI group vs. LIPUS‐MIRI + Rhosin group; p = 0.0252; *MIRI + Rhosin group vs. LIPUS‐MIRI + Rhosin group, n = 10). (B and C) Representative images of Evans blue/TTC staining and quantification of area at risk (AAR) and infarct size (IS) in MIRI mice treated with Rhosin and LIPUS (scale bar, 1 mm, p < 0.0001; * MIRI group vs. LIPUS‐MIRI group; p = 0.263; *LIPUS‐MIRI group vs. LIPUS‐MIRI + Rhosin group; p = 0.0024; *MIRI + Rhosin group vs. LIPUS‐MIRI + Rhosin group; p = 0.015; *MIRI group vs. LIPUS‐MIRI + Rhosin group, n = 10). (D and E) TUNEL immunofluorescence staining identifies apoptotic cells, followed by DAPI staining (scale bar, 100 µm, p = 0.0006; *MIRI group vs. LIPUS‐MIRI group; p = 0.0073; *LIPUS‐MIRI group vs. LIPUS‐MIRI + Rhosin group; p = 0.0139; *MIRI + Rhosin group vs. LIPUS‐MIRI + Rhosin group, n = 6). (F) Serum CK‐MB levels at 3 days after MIRI onset treated with Rhosin and LIPUS. (G) Representative transmission electron microscopy (TEM) images of cardiac tissue. Scale bar, 1 µm. Enlarged ROI. Scale bar, 500 µm (p < 0.0001; *MIRI group vs. LIPUS‐MIRI group; p = 0.0005; *LIPUS‐MIRI group vs. LIPUS‐MIRI + Rhosin group, n = 8). Results are expressed as mean ± standard deviation (SD). Comparisons of parameters were performed with analysis of variance (ANOVA) followed by Tukey's test for multiple comparisons (* p < 0.05; ** p < 0.01; *** p < 0.001; **** p < 0.0001; ** p < 0.01; *** p < 0.001; **** p < 0.0001; # p < 0.05; #### p < 0.0001; *MIRI‐no LIPUS group vs. MIRI‐LIPUS group; *MIRI + Rhosin‐no LIPU group vs. MIRI + Rhosin‐LIPUS group; #MIRI‐LIPUS group vs. MIRI + Rhosin‐LIPUS group).
FIGURE 7
FIGURE 7
Inhibition of RhoA or Myosin II eliminated the effect of low‐intensity pulsed ultrasound (LIPUS) on mitochondrial status improvement and migrasome‐mediated mitocytosis. (A) Western blot analysis of AC16 cells treated with Rhosin and LIPUS (N = 3 independent repeats). (B) Oxygen consumption rate (OCR) and mitochondrial respiration of indicated AC16 cells treated with Rhosin and LIPUS (n = 3). (C) Representative transmission electron microscopy (TEM) images of AC16 cells and quantification of abnormal mitochondria in the cells treated with Rhosin and LIPUS. n = 30 cells from three independent experiments. Scale bar, 1 µm. Enlarged ROI. Scale bar, 500 nm. Enlarged ROI. Scale bar, 200 nm. (D) Confocal image of AC16 cells stained with WGA, MitoSOX or MitoRed. Scale bar, 20 µm. (E) Western blot analysis of AC16 cells treated with Blebbistatin and LIPUS (N = 3 independent repeats). (F) OCR and mitochondrial respiration of indicated AC16 cells treated with Blebbistatin and LIPUS (n = 3). (G) Representative TEM images of AC16 cells treated with Blebbistatin and LIPUS. n = 30 cells from three independent experiments. Scale bar, 1 µm. Enlarged ROI. Scale bar, 500 nm. Scale bar, 200 nm. Results are expressed as mean ± standard deviation (SD). Comparisons of parameters were performed with analysis of variance (ANOVA) followed by Tukey's test for multiple comparisons.

References

    1. Reed GW, Rossi JE, Cannon CP. Acute myocardial infarction. Lancet. 2017;389(10065):197‐210. - PubMed
    1. Tsao CW, Aday AW, Almarzooq ZI, et al. Heart disease and stroke statistics—2022 update: a report from the American Heart Association. Circulation. 2022;145(8):e153‐e639. - PubMed
    1. Ibanez B, James S, Agewall S, et al. 2017 ESC Guidelines for the management of acute myocardial infarction in patients presenting with ST‐segment elevation: the Task Force for the management of acute myocardial infarction in patients presenting with ST‐segment elevation of the European Society of Cardiology (ESC). Eur Heart J. 2018;39(2):119‐177. - PubMed
    1. Wang J, Zhou H. Mitochondrial quality control mechanisms as molecular targets in cardiac ischemia‒reperfusion injury. Acta Pharm Sin B. 2020;10(10):1866‐1879. - PMC - PubMed
    1. Heusch G. Myocardial ischaemia‒reperfusion injury and cardioprotection in perspective. Nat Rev Cardiol. 2020;17(12):773‐789. - PubMed

LinkOut - more resources