. 2024 Jun 29;15(1):5500.
doi: 10.1038/s41467-024-49873-y.

Delayed tumor-draining lymph node irradiation preserves the efficacy of combined radiotherapy and immune checkpoint blockade in models of metastatic disease

Affiliations

Delayed tumor-draining lymph node irradiation preserves the efficacy of combined radiotherapy and immune checkpoint blockade in models of metastatic disease

Irma Telarovic et al. Nat Commun. .

Abstract

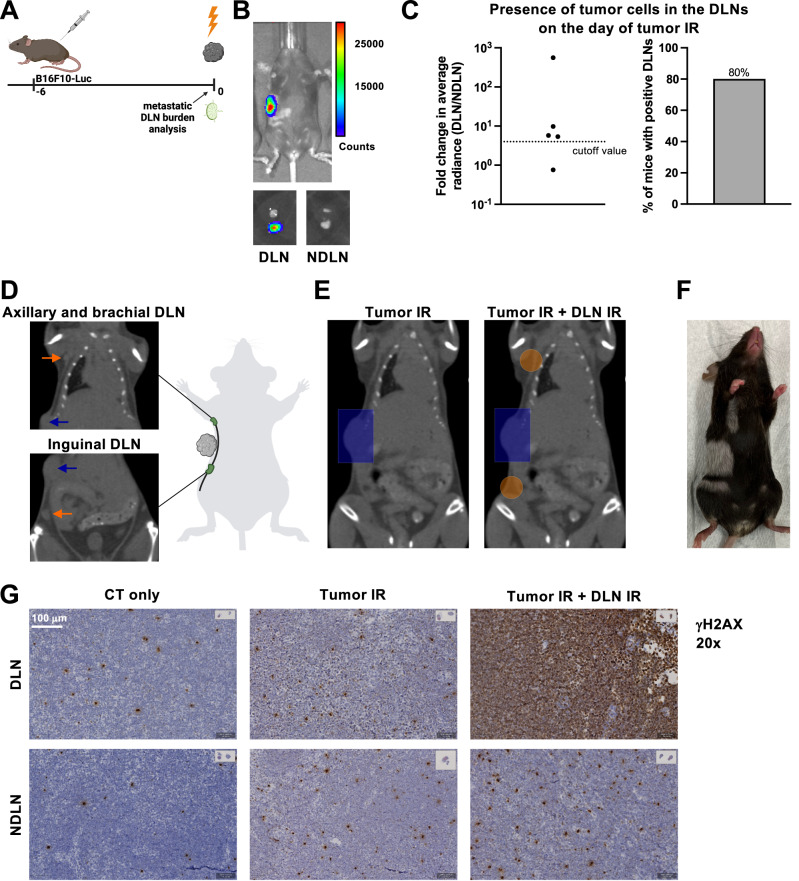
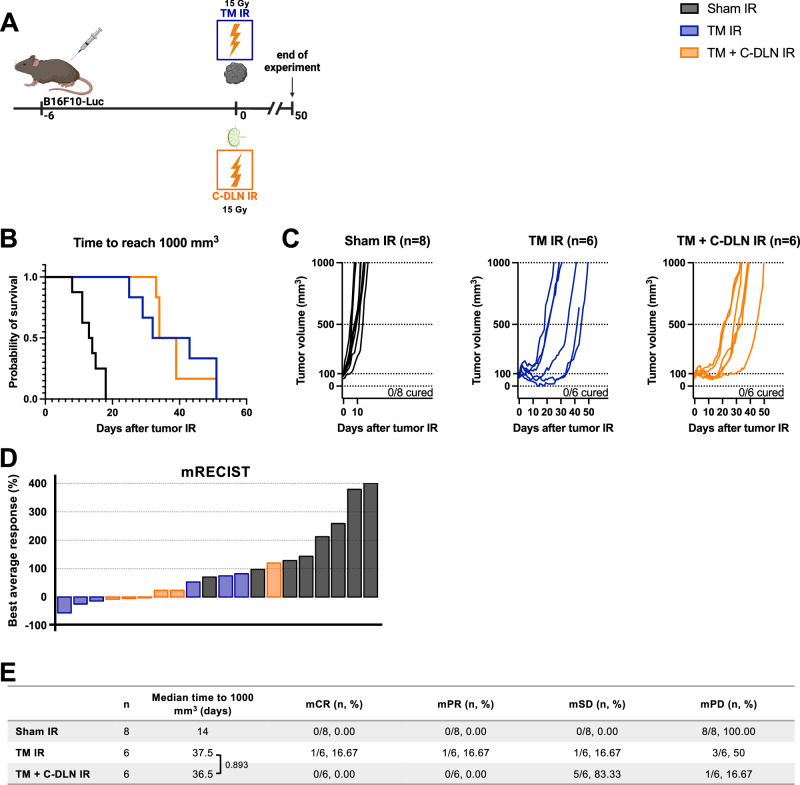
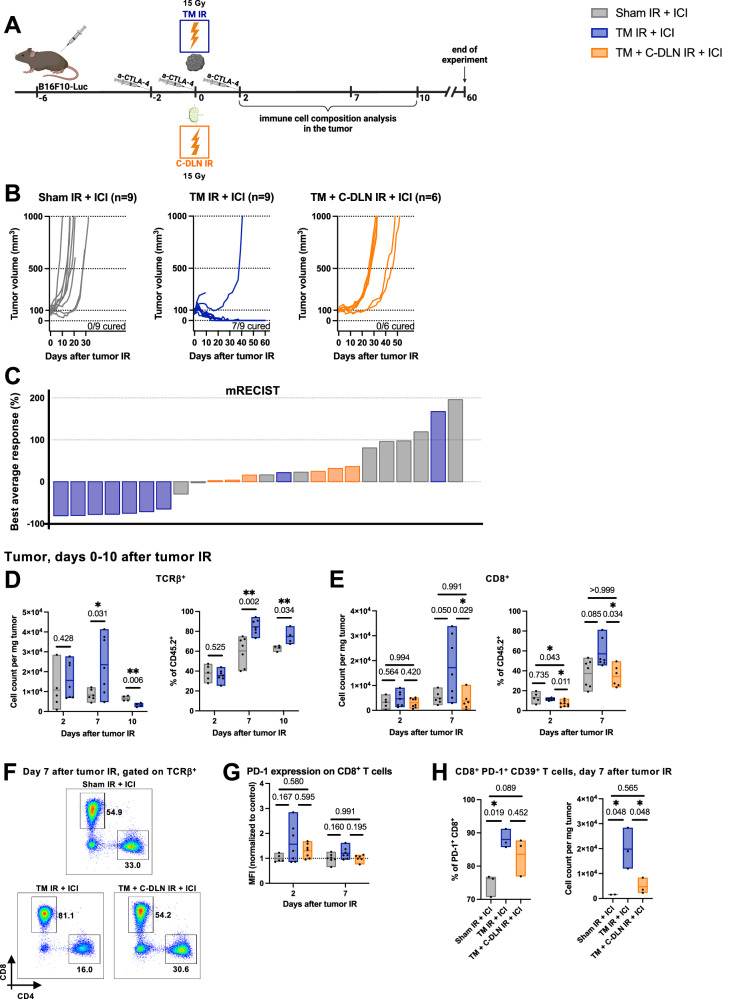
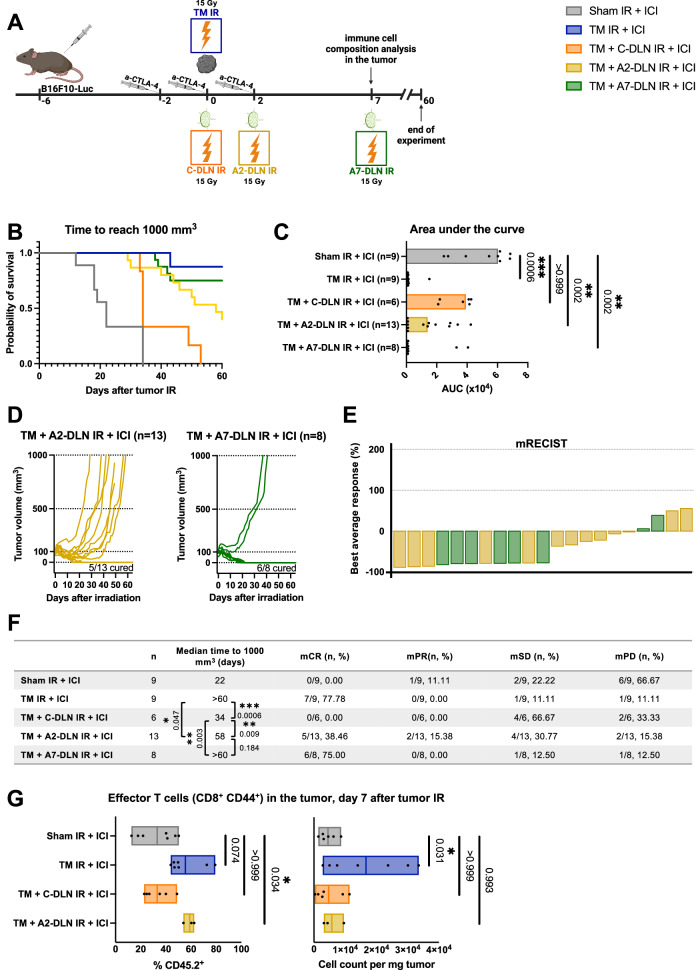
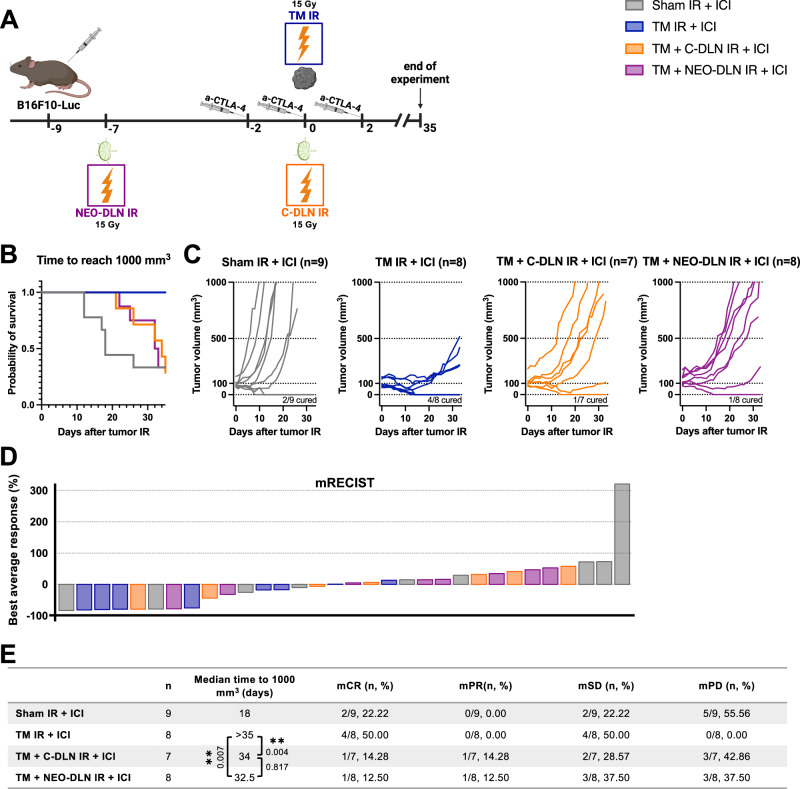
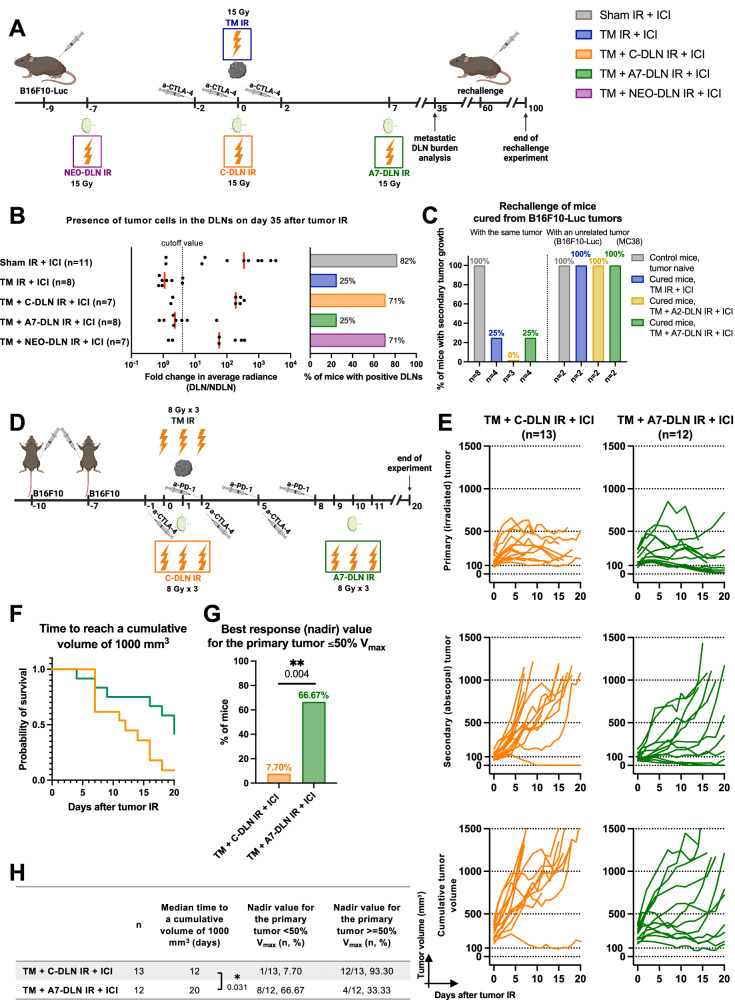
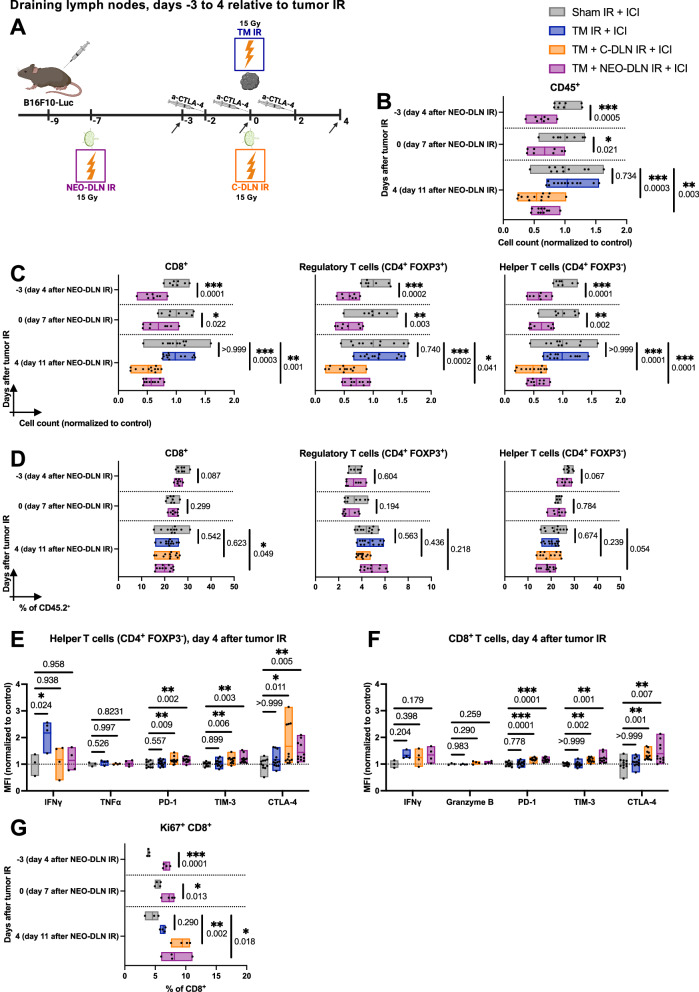
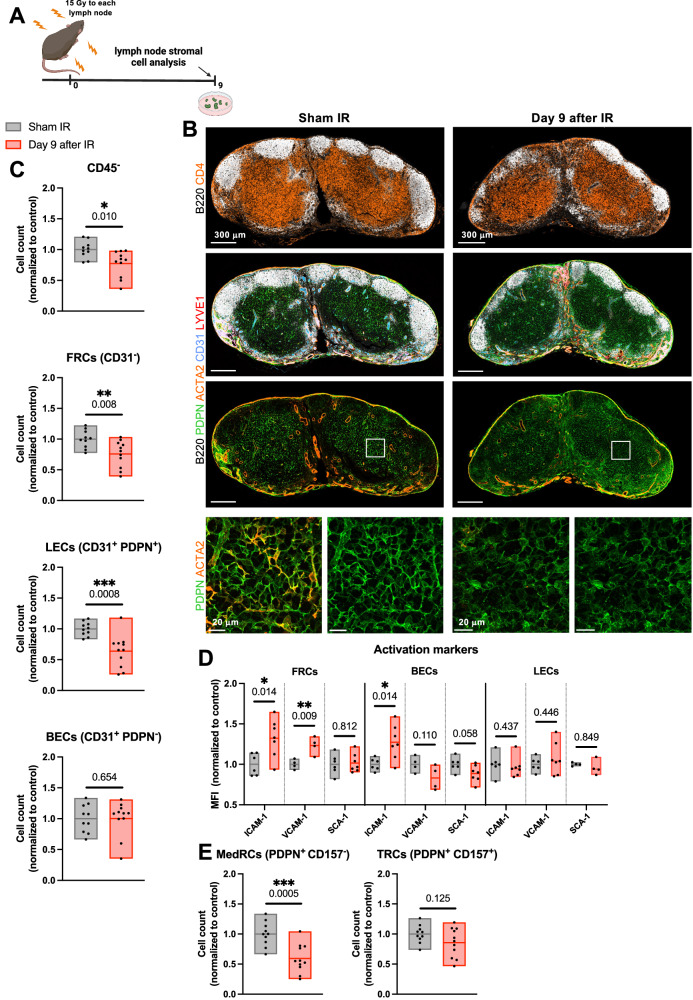
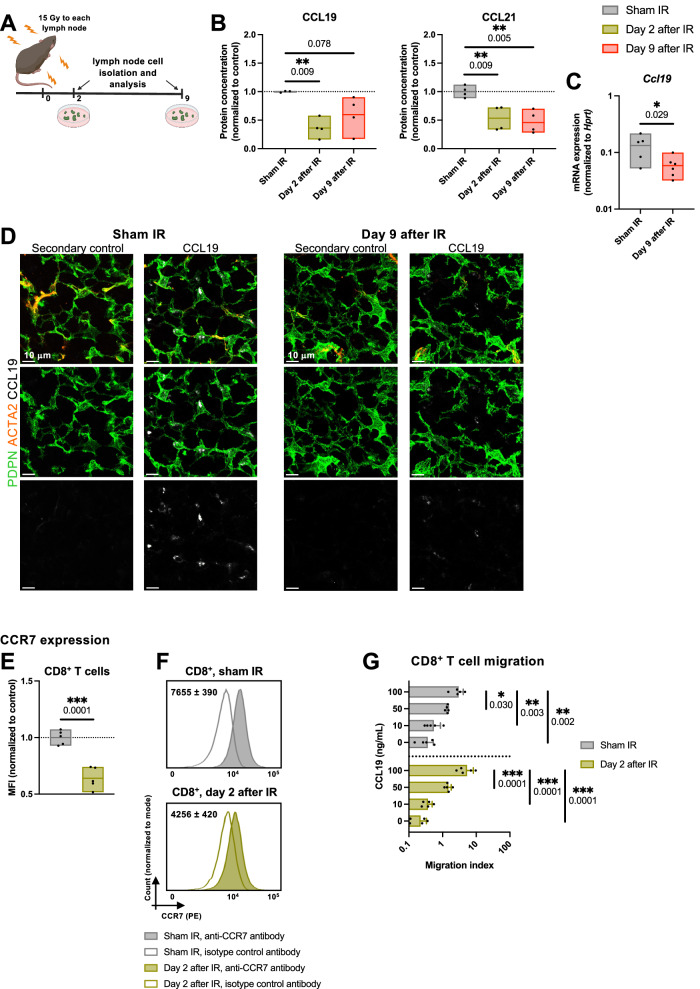
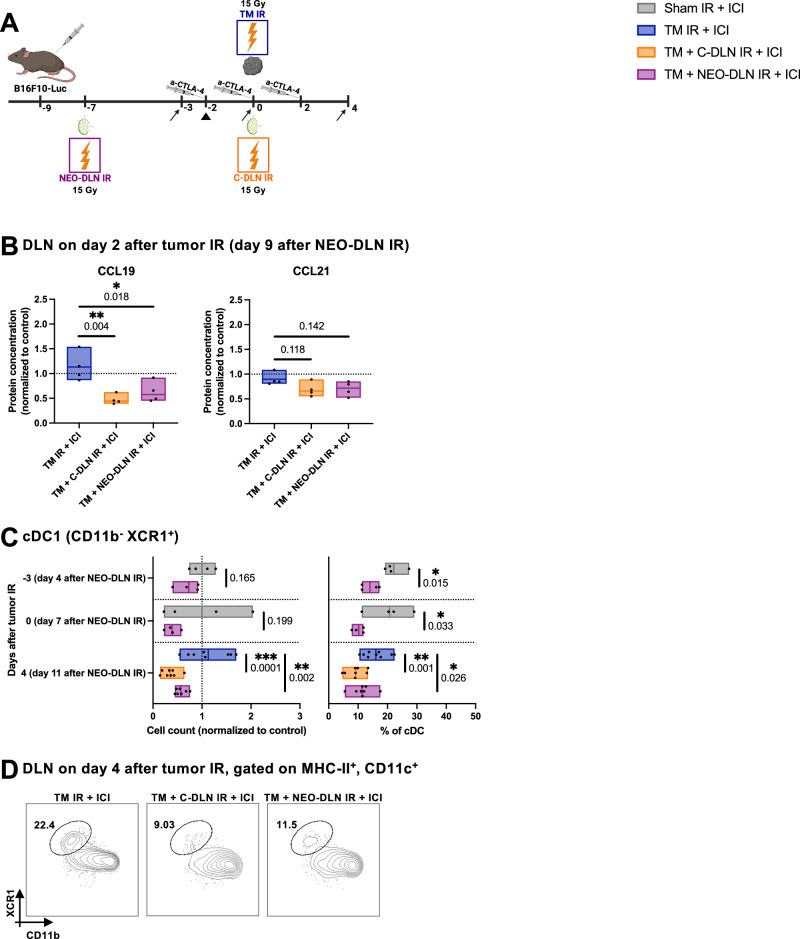
Cancer resistance to immune checkpoint inhibitors motivated investigations into leveraging the immunostimulatory properties of radiotherapy to overcome immune evasion and to improve treatment response. However, clinical benefits of radiotherapy-immunotherapy combinations have been modest. Routine concomitant tumor-draining lymph node irradiation (DLN IR) might be the culprit. As crucial sites for generating anti-tumor immunity, DLNs are indispensable for the in situ vaccination effect of radiotherapy. Simultaneously, DLN sparing is often not feasible due to metastatic spread. Using murine models of metastatic disease in female mice, here we demonstrate that delayed (adjuvant), but not neoadjuvant, DLN IR overcomes the detrimental effect of concomitant DLN IR on the efficacy of radio-immunotherapy. Moreover, we identify IR-induced disruption of the CCR7-CCL19/CCL21 homing axis as a key mechanism for the detrimental effect of DLN IR. Our study proposes delayed DLN IR as a strategy to maximize the efficacy of radio-immunotherapy across different tumor types and disease stages.


Conflict of interest statement

The authors declare no competing interests.

Figures

Fig. 1
Fig. 1. Accurate lymph node targeting using image-guided radiotherapy in a murine model of metastatic disease.
A A luciferase-expressing B16F10 mouse melanoma cell line was used to generate a metastatic melanoma tumor model. The day of tumor IR (day 0) was defined as the day when tumors reached an average size of 80 mm3 (day 6 after cell injection). B Top: Representative image of a tumor-bearing mouse on the day of tumor IR. Bottom: Excised lymph nodes from the same mouse, DLNs on the left and contralateral NDLNs on the right, with the axillary lymph node on top and the inguinal lymph node on the bottom of each image. C Quantitative analysis of the presence of tumor cells in the DLNs on the day of tumor IR. Left: Fold change in the average radiance of the DLN compared to the contralateral NDLN. Dotted line indicates the cutoff value for tumor cell positivity, defined as a 300% increase in the signal over the NDLN (fold change >4). Each dot represents an individual mouse. Right: Quantitative representation of the mice with tumor cell positive DLNs on the day of tumor IR, using the cutoff value defined above. n = 5 mice. D CT image on the day of tumor IR. Orange arrows point to the axillary and brachial (top), and inguinal DLNs (bottom). Blue arrow indicates the tumor. E Radiotherapy treatment plans. Left: Tumor-only IR is performed using a rectangular 8 × 12 mm field, shown in blue. Right: Two additional circular 5 mm fields (in orange) are used to target the DLNs. F Mouse with depigmentation corresponding to area of skin exposed to IR during tumor and DLN IR, photographed on day 60 after delivering 15 Gy. G γH2AX staining performed 30 min after delivering 15 Gy. Top row: DLN, bottom row: contralateral NDLN. Left column: planning CT only, middle column: planning CT and tumor IR, and right column: planning CT, tumor IR and DLN IR. Representative sections from n = 1 mouse per treatment group, 6 lymph nodes per mouse. Source data are provided as a Source Data file. Figures A and D, created with BioRender.com, released under a Creative Commons Attribution-NonCommercial-NoDerivs 4.0 International license.
Fig. 2
Fig. 2. Concomitant draining lymph node irradiation does not affect the tumor response to radiotherapy alone.
A B16F10-Luc tumor-bearing mice received tumor IR, with or without concomitant DLN IR. “Sham IR” group (black) was sham-irradiated, “TM IR” group (blue) received tumor IR and “TM + C-DLN IR” group (orange) received DLN IR concomitantly to tumor IR. Tumor growth was followed over 50 days. BE Treatment response represented by Kaplan–Meier survival analysis (B and E), individual tumor growth curves (C) and a waterfall plot derived from the mRECIST analysis (D). Time to reach 1000 mm3 was used as the endpoint for Kaplan–Meier analysis. Each line in C and each bar in D represents an individual mouse. Parameters derived from the mRECIST analysis in D and E are described in the Methods section. mCR, complete response; mPR, partial response; mSD, stable disease; mPD, progressive disease. Number of mice in each group is indicated in the corresponding graph title in C. Logrank test (Mantel–Cox) was used to compare the survival curves; corresponding p values are displayed in E. All p values are displayed, with *, ** and *** indicating p < 0.05, p < 0.01 and p < 0.001, respectively. Source data are provided as a Source Data file. Figure A, created with BioRender.com, released under a Creative Commons Attribution-NonCommercial-NoDerivs 4.0 International license.
Fig. 3
Fig. 3. Concomitant draining lymph node irradiation abrogates the beneficial effect of radioimmunotherapy.
A B16F10-Luc tumor-bearing mice received α-CTLA-4 and tumor IR, with or without concomitant DLN IR. All groups received α-CTLA-4. “Sham IR + ICI” group (gray) was sham-irradiated, “TM IR + ICI” group (blue) received tumor IR, and “TM + C-DLN IR + ICI” group (orange) received DLN IR concomitantly to the tumor IR. Tumor growth was followed over 60 days. Immune cell composition was analyzed at different timepoints, as indicated. Treatment response represented by individual tumor growth curves (B) and a waterfall plot derived from the mRECIST analysis (C). Each line in B and each bar in C represents an individual mouse. Best average response value in C is described in the Methods section. Number of mice is indicated in B. DH Tumor immune microenvironment. Gating strategy is shown in Supplementary Fig. 1A. Each dot represents an individual mouse. Floating bars span from the minimal to the maximal value of each group. Line indicates the mean. D Tumor-infiltrating T cells (TCRβ+). Left: cell count per mg tumor, right: TCRβ+ cells as a percent of CD45+ cells. E Tumor-infiltrating CD8+ T cells. Left: cell count per mg tumor, right: CD8+ cells as a percent of CD45+ cells. F Representative plots on day 7 after tumor IR. Numbers indicate the percentages of CD8+ and CD4+ T cells within the T cell compartment. G PD-1 expression on CD8+ T cells, expressed as the geometric mean of the fluorescence intensity (MFI), normalized to the average MFI value of the “Sham IR + ICI” group. H CD8+ PD-1+ CD39+ T cells. Left: expressed as a percent of all PD-1+ CD8+ T cells, right: CD8+ PD-1+ CD39+ T cell count per mg tumor. n ≥ 4 for D, n ≥ 5 for E and G, and n = 3 mice per group for H (exact numbers provided in Source Data file). Data were tested for normality using the Shapiro–Wilk test. For data following a normal distribution, treatment groups were compared using the two-sided unpaired t test (D) or one-way ANOVA with Holm–Sidak’s multiple comparisons test (E, left, G and H). For non-normally distributed data, the comparison was performed using the Kruskal–Wallis test with Dunn’s multiple comparisons test (E, right). All p values are displayed, with *, ** and *** indicating p < 0.05, p < 0.01 and p < 0.001, respectively. Source data are provided as a Source Data file. Figure A, created with BioRender.com, released under a Creative Commons Attribution-NonCommercial-NoDerivs 4.0 International license.
Fig. 4
Fig. 4. Delayed (adjuvant) draining lymph node irradiation preserves the efficacy of radioimmunotherapy.
A B16F10-Luc tumor-bearing mice received α-CTLA-4 and tumor IR, with or without DLN IR at different timepoints. All groups received α-CTLA-4. “Sham IR + ICI” group (gray) was sham-irradiated, “TM IR + ICI” group (blue) received tumor IR, “TM + C-DLN IR + ICI” group (orange) received DLN IR concomitantly to the tumor IR, “TM + A2-DLN IR + ICI” (yellow) and “TM + A7-DLN IR + ICI” (green) received DLN IR delayed by 2 and 7 days, respectively. Tumor growth was followed over 60 days. Immune cell composition was analyzed on day 7 after tumor IR. BF Treatment response represented by the Kaplan–Meier survival analysis (B and F), area under the curve (AUC) analysis (C), individual tumor growth curves (D) and a waterfall plot derived from the mRECIST analysis (E). Time to reach 1000 mm3 was used as the endpoint for Kaplan–Meier analysis. Each dot in C, each line in D and each bar in E represents an individual mouse. Bar width in C represents the median value of the corresponding group. Parameters derived from the mRECIST analysis in E and F are described in the Methods section. mCR complete response, mPR partial response, mSD stable disease, mPD progressive disease. Number of mice in each group is indicated in F. G Tumor-infiltrating effector T cells on day 7 after tumor IR. Left: Effector T cells as a percentage of CD45+ cells, right: cell count per mg tumor. Gating strategy is shown in Supplementary Fig. 1A. Each dot represents an individual mouse. Floating bars span from the minimal to the maximal value of each group. Line indicates the mean. n ≥ 3 mice per group (exact numbers provided in Source Data file). Data were tested for normality using the Shapiro–Wilk test. For data following a normal distribution, treatment groups were compared using the one-way ANOVA with Holm–Sidak’s multiple comparisons test (G, right). For non-normally distributed data, the comparisons were performed using the Kruskal–Wallis test with Dunn’s multiple comparisons test (C and G, left). Logrank test (Mantel–Cox) was used to compare the survival curves; corresponding p values are displayed in F. All p values are displayed, with *, ** and *** indicating p < 0.05, p < 0.01 and p < 0.001, respectively. Source data are provided as a Source Data file. Figure A, created with BioRender.com, released under a Creative Commons Attribution-NonCommercial-NoDerivs 4.0 International license.
Fig. 5
Fig. 5. Neoadjuvant draining lymph node irradiation fails to preserve the efficacy of radioimmunotherapy.
A B16F10-Luc tumor-bearing mice received α-CTLA-4 and tumor IR, with or without DLN IR at different timepoints. All groups received α-CTLA-4. “Sham IR + ICI” group (gray) received was sham-irradiated “TM IR + ICI” group (blue) received tumor IR, “TM + C-DLN IR + ICI” group (orange) received DLN IR concomitantly to the tumor IR and “TM + NEO-DLN IR + ICI” (purple) received DLN IR 7 days prior to tumor IR. Tumor growth was followed over 35 days. Treatment response represented by the Kaplan–Meier survival analysis (B and E), individual tumor growth curves (C) and a waterfall plot derived from the mRECIST analysis (D). Time to reach 1000 mm3 was used as the endpoint for Kaplan–Meier analysis. Each line in C and each bar in D represents an individual mouse. Parameters derived from the mRECIST analysis in D and E are described in the Methods section. mCR complete response, mPR partial response, mSD stable disease, mPD progressive disease. Number of mice in each group is indicated in the corresponding graph title in C. Logrank test (Mantel–Cox) was used to compare the survival curves; corresponding p values are displayed in E. All p values are displayed, with *, ** and *** indicating p < 0.05, p < 0.01 and p < 0.001, respectively. Source data are provided as a Source Data file. Figure A, created with BioRender.com, released under a Creative Commons Attribution-NonCommercial-NoDerivs 4.0 International license.
Fig. 6
Fig. 6. Adjuvant draining lymph node irradiation allows for the development of regional control and the induction of long-lasting tumor-specific immunity.
A B16F10-Luc tumor-bearing mice received α-CTLA-4 and tumor IR, with or without DLN IR at different timepoints, as illustrated. For the evaluation of the presence of tumor cells, DLNs were excised on day 35 after tumor IR. For the rechallenge, cured mice were injected on the contralateral flank, using either the same B16F10-Luc or antigenically unrelated MC38 cells on day 60 after tumor IR. Tumor growth was followed for 40 days after the rechallenge. B Quantification of tumor cell positivity in the DLNs. Left: Fold change in the average radiance of the DLN compared to the contralateral NDLN. Dotted line indicates the cutoff value for tumor cell positivity, defined as a 300% increase in the signal over the NDLN (fold change >4). Each dot represents an individual mouse. Red line represents the median. Right: Quantification of mice with DLN metastasis, using the cutoff value of 4. Number of mice in each group is indicated in the graph. C Percentage of mice with second tumor growth after rechallenging, using either the same B16F10-Luc or antigenically unrelated MC38 cells. Number of mice in each group is indicated in the graph. D Mice bearing two B16F10-Luc tumors received α-CTLA-4, α-PD-1 and tumor IR, as indicated. DLN IR was performed either concomitantly (C-DLN IR, orange), or 7 days after tumor IR (A7-DLN IR, green). All targets received 8 Gy per fraction in three fractions. Tumor growth was followed over 20 days. Treatment response represented by individual tumor growth curves (E), Kaplan–Meier survival analysis (F and H), and the percentage of mice achieving a 50% or more decrease in the primary (irradiated) tumor volume (i.e. nadir value ≤ 50% Vmax) (G and H). Time to reach a cumulative volume (i.e. the sum of the primary and secondary tumor volume on a given day) of 1000 mm3 was used as the endpoint for Kaplan–Meier analysis. Each line in E represents an individual mouse. Number of mice in each group is indicated in E. Logrank test (Mantel–Cox) was used to compare the survival curves; corresponding p values are displayed in H. Two-sided Fisher’s exact test was used to compare the categorical data in G. All p values are displayed, with *, ** and *** indicating p < 0.05, p < 0.01 and p < 0.001, respectively. Source data are provided as a Source Data file. Figures A and D, created with BioRender.com, released under a Creative Commons Attribution-NonCommercial-NoDerivs 4.0 International license.
Fig. 7
Fig. 7. Concomitant and neoadjuvant draining lymph node irradiation induce prolonged lymphopenia in the irradiated lymph node.
A All B16F10-Luc tumor-bearing mice received α-CTLA-4. Sham IR + ICI” group (gray) was sham-irradiated, “TM IR + ICI” group (blue) received tumor IR, “TM + C-DLN IR + ICI” group (orange) received DLN IR concomitantly to the tumor IR, and “TM + NEO-DLN IR + ICI” group (purple) received DLN IR 7 days prior to tumor IR. Immune cell composition of the DLNs was analyzed at different timepoints (indicated by arrows). Gating strategy is shown in Supplementary Fig. 4A. BD Immune cell composition of the DLN in response to IR. B Absolute cell counts of all CD45+ cells. C, D CD8+ T cells, regulatory T cells (CD4+ FOXP3+) and helper T cells (CD4+ FOXP3) represented by cell counts (C) and as a percentage of CD45+ cells (D). E, F Expression of various activation and exhaustion markers on day 4 after tumor IR, expressed as the geometric mean of the fluorescence intensity (MFI), normalized to the average MFI value of the “Sham IR + ICI” group. E Helper T cells. F CD8+ T cells. G Percentage of CD8+ T cells in the DLN positive for Ki67. Each dot represents an individual mouse. Floating bars span from the minimal to the maximal value of each group. Line indicates the mean. n ≥ 8 for BD, and n ≥ 3 mice per groups for EG (exact numbers provided in Source Data file). Data were tested for normality using the Shapiro–Wilk test. For data following a normal distribution (all data except as specified below), treatment groups were compared using the two-sided unpaired t test or one-way ANOVA with Holm–Sidak’s multiple comparisons test. For non-normally distributed data, comparisons were performed using the two-sided Mann–Whitney test (helper T cells in C, day 0; regulatory T cells in D, day 0; G, day 0) or the Kruskal–Wallis test (CD8+ T cells in C, day 4; TIM-3 and CTLA-4 in E and F), with Dunn’s multiple comparisons test. All p values are displayed, with *, ** and *** indicating p < 0.05, p < 0.01 and p < 0.001, respectively. Source data are provided as a Source Data file. Figure A, created with BioRender.com, released under a Creative Commons Attribution-NonCommercial-NoDerivs 4.0 International license.
Fig. 8
Fig. 8. Irradiation induces changes in the stromal cell compartment of the lymph node.
A Brachial, axillary, and inguinal lymph nodes on both sides of healthy mice were irradiated with 15 Gy. Lymph nodes were harvested on day 9 after IR. B Fluorescence microscopy of a section of a sham-irradiated (left column) and an irradiated inguinal lymph node (right column). Sections are stained for B220 (white), CD4 (orange, top row), podoplanin (PDPN) (green), actin alpha 2 (ACTA2) (orange, bottom three rows), CD31 (blue) and LYVE1 (red). Bottom row shows enlargement of areas outlined with white squares. Representative sections from n = 2 mice per treatment group, 2 lymph nodes per mouse. CE Flow cytometry analysis of the stromal cell compartment of the lymph node. Gating strategy is shown in Supplementary Fig. 6A. Each dot represents an individual mouse. Floating bars span from the minimal to the maximal value of each group. Line indicates the mean. C Top to bottom: Cell counts of all CD45 cells, fibroblastic reticular cells (FRCs), lymphatic endothelial cells (LECs) and blood endothelial cells (BECs). D The expression of activation markers ICAM-1, VCAM-1 and SCA-1 on major stromal cell subsets, expressed as the geometric mean of the fluorescence intensity (MFI), normalized to the average MFI value of the “Sham IR” group. E Cell counts of FRCs subtypes, medullary reticular cells (MedRCs) and T zone reticular cells (TRCs). For the sham-irradiated group (gray), n = 10 for C and E, and n ≥ 4 mice for D (exact numbers provided in Source Data file). For the group which received lymph node IR 9 days prior to analysis (red), n = 11 for C and E, and n ≥ 4 for D (exact numbers provided in Source Data file). Data were tested for normality using the Shapiro–Wilk test. For data following a normal distribution, treatment groups were compared using the two-sided unpaired t test (C, except for BECs; D and E). For non-normally distributed data, the comparison was performed using the two-sided Mann–Whitney test (C, BECs). All p values are displayed, with *, ** and *** indicating p < 0.05, p < 0.01 and p < 0.001, respectively. Source data are provided as a Source Data file. Figure A, created with BioRender.com, released under a Creative Commons Attribution-NonCommercial-NoDerivs 4.0 International license.
Fig. 9
Fig. 9. Lymph node irradiation interferes with the CCR7-CCL19/CCL21 immune cell homing axis.
A Brachial, axillary, and inguinal lymph nodes on both sides of healthy C57BL/6 mice were irradiated using 15 Gy. Lymph nodes were harvested on days 2 (green) and 9 (red) after IR. B CCL19 and CCL21 protein concentration in the DLNs, expressed relative to the average value of the sham-irradiated mice (gray). n = 4 mice per group. C Ccl19 mRNA expression in fibroblastic reticular cells, normalized to Hprt. n = 6 mice per group. D Fluorescence microscopy of a section of a sham-irradiated (left) and an irradiated inguinal lymph node (right), on day 9 after IR. Sections are stained for podoplanin (PDPN) (green), actin alpha 2 (ACTA2) (orange) and CCL19 (white). Representative sections from n = 2 mice per treatment group, 2 lymph nodes per mouse. E, F CCR7 expression on CD8+ T cells. E Geometric mean of the fluorescence intensity (MFI) of CCR7 on CD8+ T cells, normalized to the corresponding average MFI value of in the sham-irradiated group. F Representative histograms. Values in histograms indicate the average MFI of CCR7 on CD8+ T cells (shaded histograms) minus the MFI of the corresponding isotype control (transparent histograms) ± standard deviation (SD). n = 5 mice per group. G Transwell migration assay of CD8+ T cells isolated from sham-irradiated lymph nodes (gray) and lymph nodes irradiated with 15 Gy 2 days prior to resection (green). Migration index is calculated by dividing the number of migrated cells in the given condition with the basal migration value (i.e. the number of migrated cells towards the bottom chamber containing 10% FBS). n = 5 mice per group. Each dot represents an individual mouse. Floating bars in B, C and E span from the minimal to the maximal value of each group. Line indicates the mean. Bar width in G represents the mean value, with error bars indicating the SD. According to the Shapiro–Wilk test, all data followed a normal distribution. Groups were compared using the two-sided unpaired t test (C and E), one-way ANOVA with Holm–Sidak’s multiple comparisons test (B) and two-way ANOVA with Holm–Sidak’s multiple comparisons test (G). All p values are displayed, with *, ** and *** indicating p < 0.05, p < 0.01 and p < 0.001, respectively. Source data are provided as a Source Data file. Figure A, created with BioRender.com, released under a Creative Commons Attribution-NonCommercial-NoDerivs 4.0 International license.
Fig. 10
Fig. 10. Draining lymph node irradiation disrupts the CCR7-CCL19/CCL21 axis, which correlates with a reduction in the lymph node-infiltrating cross-presenting conventional type 1 dendritic cells.
A All B16F10-Luc tumor-bearing mice received α-CTLA-4. “TM IR + ICI” group (blue) received tumor IR, “TM + C-DLN IR + ICI” group (orange) received DLN IR concomitantly to the tumor IR, and “TM + NEO-DLN IR + ICI” group (purple) received DLN IR 7 days prior to tumor IR. Dendritic cells were analyzed at different timepoints (indicated by arrows). Gating strategy is shown in Supplementary Fig. 7. CCL19 and CCL21 protein quantification was performed on day 2 after tumor IR (arrowhead). B CCL19 and CCL21 protein concentration in the DLNs on day 2 after tumor IR (corresponding to day 9 after neoadjuvant DLN IR), expressed relative to the average value of the sham-irradiated mice. n = 4 mice per group. C, D cDC1s in the DLN displayed as cell counts (C, left) and as a percentage of all cDCs (C, right). D Representative plots from DLNs on day 4 after tumor IR. Numbers indicate the percentage of cDC1 within the cDC compartment. n ≥ 4 mice per group (exact numbers provided in Source Data file). Each dot represents an individual mouse. Floating bars span from the minimal to the maximal value of each group. Line indicates the mean. Data were tested for normality using the Shapiro–Wilk test. All data followed a normal distribution. Treatment groups were compared using the two-sided unpaired t test (C, day -3 and day 0) and one-way ANOVA with Holm–Sidak’s multiple comparisons test (B and C, day 4). All p values are displayed, with *, ** and *** indicating p < 0.05, p < 0.01 and p < 0.001, respectively. Figure A, created with BioRender.com, released under a Creative Commons Attribution-NonCommercial-NoDerivs 4.0 International license.

References

    1. Sharma P, Allison JP. Immune checkpoint targeting in cancer therapy: toward combination strategies with curative potential. Cell. 2015;161:205–214. doi: 10.1016/j.cell.2015.03.030. - DOI - PMC - PubMed
    1. Jenkins RW, Barbie DA, Flaherty KT. Mechanisms of resistance to immune checkpoint inhibitors. Br. J. Cancer. 2018;118:9–16. doi: 10.1038/bjc.2017.434. - DOI - PMC - PubMed
    1. Johnson DB, Nebhan CA, Moslehi JJ, Balko JM. Immune-checkpoint inhibitors: long-term implications of toxicity. Nat. Rev. Clin. Oncol. 2022;19:254–267. doi: 10.1038/s41571-022-00600-w. - DOI - PMC - PubMed
    1. Marciscano AE, et al. Immunomodulatory effects of stereotactic body radiation therapy: Preclinical insights and clinical opportunities. Int J. Radiat. Oncol. 2021;110:35–52. doi: 10.1016/j.ijrobp.2019.02.046. - DOI - PubMed
    1. Weichselbaum RR, Liang H, Deng L, Fu YX. Radiotherapy and immunotherapy: a beneficial liaison? Nat. Rev. Clin. Oncol. 2017;14:365–379. doi: 10.1038/nrclinonc.2016.211. - DOI - PubMed

Substances

LinkOut - more resources