. 2024 Jul 1;15(1):4632.
doi: 10.1038/s41467-024-48955-1.

The chromatin regulator Ankrd11 controls cardiac neural crest cell-mediated outflow tract remodeling and heart function

Affiliations

The chromatin regulator Ankrd11 controls cardiac neural crest cell-mediated outflow tract remodeling and heart function

Yana Kibalnyk et al. Nat Commun. .

Abstract

ANKRD11 (Ankyrin Repeat Domain 11) is a chromatin regulator and a causative gene for KBG syndrome, a rare developmental disorder characterized by multiple organ abnormalities, including cardiac defects. However, the role of ANKRD11 in heart development is unknown. The neural crest plays a leading role in embryonic heart development, and its dysfunction is implicated in congenital heart defects. We demonstrate that conditional knockout of Ankrd11 in the murine embryonic neural crest results in persistent truncus arteriosus, ventricular dilation, and impaired ventricular contractility. We further show these defects occur due to aberrant cardiac neural crest cell organization leading to outflow tract septation failure. Lastly, knockout of Ankrd11 in the neural crest leads to impaired expression of various transcription factors, chromatin remodelers and signaling pathways, including mTOR, BMP and TGF-β in the cardiac neural crest cells. In this work, we identify Ankrd11 as a regulator of neural crest-mediated heart development and function.


Conflict of interest statement

The authors declare the following competing interests: J.M. is an employee of Vizgen. The remaining authors declare no competing interests.

Figures
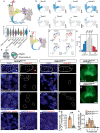
Fig. 1
Fig. 1. Ankrd11 is expressed in cardiac neural crest cells and ablated in the Ankrd11ncko mouse model.
a UMAP embedding of mouse trunk neural crest and neural tube lineage at E9.5 and E10.5 (total 2121 cells). Data were re-analyzed from ref. . b mRNA expression of Ankrd11 and key markers for migratory and cardiac neural crest, abundance indicated by color intensity. c Ankrd11 expression level distribution in different cell types of mouse trunk neural crest and neural tube lineage at E9.5 and E10.5. dd’ Expression of Ankrd11 and key markers in cardiac NCC cluster (92 cells). e Ankrd11 expression level distribution in cardiac NCC cluster. Dash-dotted, dotted, and dashed lines refer to the first (blue), second (gray), and third (red) quartiles (q), respectively. f, g Representative images of Ankrd11nchet (f) and Ankrd11ncko (g) embryos at E11.5 showing YFP fluorescence. h Schematic of OFT transverse section at E11.5. io Representative images of Ankrd11nchet (Ankrd11fl/WT;Wnt1Cre2, ij”, m, n, and Ankrd11ncko (Ankrd11fl/fl;Wnt1Cre2, kl”, o E11.5 OFT (im) or neural tube (n, o) sections processed for Basescope with Ankrd11 exon 7 mRNA probe (il”, n, o) and control negative probe (m) (red), and counterstained for cell nuclei (DAPI; blue). Solid outlines: OFT mesenchyme. * autofluorescent red blood cells. i’l’ High magnification images of OFT mesenchyme (white dashed boxes in il). Dashed outlines: Ankrd11+ cells. i”l” High magnification images of OFT myocardium (yellow dashed boxes in il). Dashed outlines: Ankrd11+ cells. n, o High magnification images of neural tube (NT) regions. Dashed outlines: Ankrd11+ cells. p Quantification for i-l for % Ankrd11+ cells in Ankrd11nchet (orange) and Ankrd11ncko (green) OFT mesenchyme. Two-tailed unpaired t-test (p = 0.0055). q Quantification of p for the distribution of Ankrd11+ puncta/cell in Ankrd11nchet OFT mesenchyme. **p < 0.01. Graphs represent mean ± s.e.m, n = 3 Ankrd11nchet and n = 3 Ankrd11ncko samples from two independent litters. Scale bars: 1 mm (f, g), 100 µm (il), 10 µm (i’-o). CNCC cardiac neural crest cells, CNS central nervous system, LV left ventricle, migr migratory, NCC neural crest cells, NT neural tube, OFT outflow tract, premigr pre-migratory, RV right ventricle. Source data are provided as a Source Data file.
Fig. 2
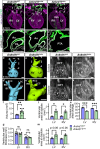
Fig. 2. Conditional loss of Ankrd11 in the neural crest leads to outflow tract defects and decreased ventricular function at E18.5. Related to Supplemental Fig. 1and the associated movie files.
ac Representative images of Ankrd11WT (Ankrd11WT/WT;Wnt1Cre2, a), Ankrd11nchet (Ankrd11fl/WT;Wnt1Cre2, b) and Ankrd11ncko (Ankrd11fl/fl;Wnt1Cre2, c) E18.5 heart coronal sections, immunostained for CNCC derivatives (YFP; green) and counterstained for cell nuclei (Hoechst; magenta). a’c’. High magnification images of OFT regions (white dashed boxes in ac) from the same or adjacent sections immunostained for alpha-smooth muscle actin (αSMA; white) and CNCC derivatives (YFP; green). de’. Representative 3D reconstructions of µCT scans of E18.5 Ankrd11ctrl (Ankrd11fl/fl, Ankrd11fl/WT and Ankrd11nchet d) and Ankrd11ncko (e) hearts and magnified images (d’, e’) of the OFT regions (from white dashed boxes in d, e). f, g Quantification of d-e for total ventricular volumes (f) and ventricular wall thicknesses (g) from Ankrd11ctrl (blue) and Ankrd11ncko (green) embryos. Two-tailed unpaired t-test (f, p = 0.0057); two-tailed multiple t-tests with Holm-Sidak multiple comparisons test (g). hk Representative B-mode long-axis images of in utero echocardiography of Ankrd11ctrl (Ankrd11fl/fl, Ankrd11fl/WT, and Ankrd11nchet, h, i) and Ankrd11ncko (j, k) embryos during systole (h, j) and diastole (i, k). Dashed lines outline the heart and ventricles in each image. ln Quantification of the ventricular area during systole (l), diastole (m), and percent area change between systole and diastole (n) in the left (LV) and right (RV) ventricles from Ankrd11ctrl and Ankrd11ncko embryos. Two-tailed multiple t-tests with Holm-Sidak multiple comparisons test (l, LV p = 0.012655, RV p = 0.013974; n, LV p = 0.000121, RV p = 0.000974). ns: not significant, *p < 0.05, ** p < 0.01, ***p < 0.001. Graphs represent mean ± s.e.m; n = 7 Ankrd11ctrl and 8 Ankrd11ncko (f); n = 8 Ankrd11ctrl, 7 Ankrd11ncko LV, 5 Ankrd11ncko RV (g); n = 3 Ankrd11ctrl and n = 3 Ankrd11ncko (ln) samples. Embryos were taken from 3 independent litters. Scale bars: 500 µm. Ao aorta, BCT brachiocephalic trunk, LCC left common carotid artery, LS left subclavian artery, LV left ventricle, OFT outflow tract, PA pulmonary artery, RCC right common carotid artery, RS right subclavian artery, RV right ventricle, TA truncal artery, V ventricle, VSD ventricular septal defect. Source data are provided as a Source Data file.
Fig. 3
Fig. 3. Conditional loss of Ankrd11 in the neural crest causes delayed CNCC organization and failed OFT septation at E11.5-E12.5. Related to Supplemental Fig. 2.
a Schematic of OFT transverse sections undergoing different stages of remodeling along the proximal-distal axis from E11.5 to E12.5. In the proximal and medial OFT, CNCCs in green are condensed into tightly organized columns. In the distal region, streams of CNCCs from both OFT cushions migrated medially and fused to form the aorticopulmonary (AP) septum and two distinct vessels of the aorta (Ao) and pulmonary artery (PA). be Representative images of E11.5 Ankrd11nchet (b, c) and Ankrd11ncko (d, e) distal OFT transverse sections immunostained for CNCC and their derivatives (YFP; green) and F-actin (phalloidin; blue) and counterstained for nuclei (Hoechst; magenta). fi’. Representative images of E11.5 Ankrd11nchet (f, g) and Ankrd11ncko (h, i) medial OFT sections. White dashed boxes are shown at higher magnification in f’–i’. * OFT cushion center. jq Representative images of E12.5 Ankrd11nchet (j, k, n, o) and Ankrd11ncko (l, m, p, q) distal OFT sections. ru’ Representative images of E12.5 Ankrd11nchet (r, s) and Ankrd11ncko (t, u) medial OFT sections. White dashed boxes are shown at higher magnification in r’–u’. v Schematic of Ankrd11nchet CNCC nuclei orientation within an OFT cushion at E11.5-E12.5. Nuclei oriented perpendicularly to the cushion center (pink cell) are closer to 90° while nuclei oriented in parallel (teal cell) are closer to 0°. Method adapted from ref. . Created with BioRender.com released under a Creative Commons Attribution-NonCommercial-NoDerivs 4.0 International license. w, x Quantification of CNCC nuclear orientation to OFT cushion center at E11.5 and E12.5 in medial regions between Ankrd11nchet (orange) and Ankrd11ncko (green) genotypes. Two-tailed multiple t-tests with Holm-Sidak multiple comparisons test (w, 90-70 p = 0.000226, 29-0 p = 0.000148). ns: not significant; p > 0.05 ***p < 0.001. Graphs represent mean ± s.e.m; n = 3 Ankrd11nchet and n = 3 Ankrd11ncko samples from at least 2 independent litters. Scale bars: 100 µm. Source data are provided as a Source Data file.
Fig. 4
Fig. 4. Conditional loss of Ankrd11 in the neural crest causes delayed BMP signaling in OFT cushions.
ap Representative images of Ankrd11nchet (a, b, e, f, i, j, m, n) and Ankrd11ncko (c, d, g, h, k, l, o, p) distal and medial OFT cushions (outlined with white dashed lines) at E11.5 (ah) and E12.5 (ip) immunostained for CNCCs (YFP; green), pSmad1/5/8 (white) and counterstained for nuclei (Hoechst, magenta). q, r Quantification of ap for percent of pSmad1/5/8+ CNCCs (% pSmad1/5/8 + YFP + /YFP+ cells) in Ankrd11nchet (orange) and Ankrd11ncko (green) genotypes in the medial region, and in the Ankrd11ncko genotype the distal region, at E11.5 and E12.5. Two-way ANOVA with Sidak’s multiple comparisons test (q, E11.5 Ankrd11nchet vs. E11.5 Ankrd11ncko p = 0.0035, E11.5 Ankrd11ncko vs. E12.5 Ankrd11ncko p = 0.035); two-tailed unpaired t-test (r, p = 0.0078). Graphs represent mean ± s.e.m; n = 3 Ankrd11nchet and n = 3 Ankrd11ncko samples from at least 2 independent litters. ns: not significant, *p < 0.05, **p < 0.01. Scale bars: 100 µm. Source data are provided as a Source Data file.
Fig. 5
Fig. 5. Conditional loss of Ankrd11 in the neural crest causes delayed mTOR signaling in OFT cushions. Related to Supplemental Fig. 3.
ap Representative images of Ankrd11nchet (a, b, e, f, i, j, m, n) and Ankrd11ncko (c, d, g, h, k, l, o, p) distal and medial OFT cushions (outlined with white dashed lines) at E11.5 (ah) and E12.5 (ip) immunostained for CNCCs (YFP; green), pS6 (white) and counterstained for nuclei (Hoechst, magenta). q, r Quantification of ap for percent of pS6 CNCCs (% pS6 + S6 + YFP + /S6 + YFP+ cells) in Ankrd11nchet (orange) and Ankrd11ncko (green) medial OFT (q), and in the Ankrd11ncko distal OFT (r), at E11.5 and E12.5. Two-way ANOVA with Sidak’s multiple comparisons test (q, E11.5 Ankrd11nchet vs. E11.5 Ankrd11ncko p = 0.0108, E11.5 Ankrd11ncko vs. E12.5 Ankrd11ncko p = 0.0182); two-tailed unpaired t-test (r, p = 0.0033). Graphs represent mean ± s.e.m; n = 3 Ankrd11nchet and n = 3 Ankrd11ncko samples from at least 2 independent litters. ns: not significant, *p < 0.05, **p < 0.01. Scale bars: 100 µm. Source data are provided as a Source Data file.
Fig. 6
Fig. 6. Conditional loss of Ankrd11 in the neural crest causes failure of asymmetric TGF-β signaling in OFT cushions at E11.5 that is partially restored by E12.5. Related to Supplemental Fig. 4.
ap Representative images of E11.5 Ankrd11nchet (a, b, e, f, i, j, m, n) and Ankrd11ncko (c, d, g, h, k, l, o, p) distal and medial OFT, in the parietal (PC) and septal (SC) cushions (outlined with white dashed lines) at E11.5 (ah) and E12.5 (ip) immunostained for CNCCs (YFP; green), pSmad2/3 (white) and counterstained for nuclei (Hoechst, magenta). qt Quantification of ap for percent of pSmad2/3 CNCCs (% pSmad2/3 + YFP + /YFP+ cells) in Ankrd11nchet (orange) and Ankrd11ncko (green) medial OFT (q, s) and in the Ankrd11ncko distal OFT (r, t), at E11.5 (q, r) and E12.5 (s, t), in the parietal and septal cushions. Two-tailed multiple t-tests with Holm-Sidak multiple comparisons test, medial (q, Ankrd11nchet p = 0.030585; s, Ankrd11nchet p = 0.004133, Ankrd11ncko p = 0.002271); two-tailed unpaired t-test, distal. Graphs represent mean ± s.e.m; n = 3 Ankrd11nchet and n = 3 Ankrd11ncko samples from at least 2 independent litters. ns: not significant, *p < 0.05, **p < 0.01. Scale bars: 100 µm. Source data are provided as a Source Data file.
Fig. 7
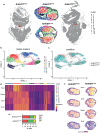
Fig. 7. MERFISH identified CNCC clusters in the OFT at E11.5. Related to Supplemental Fig. 5.
a Plot showing the spatial position of cells from representative transverse sections of E11.5 Ankrd11nchet (left) and Ankrd11ncko (right) embryos subjected to MERFISH with a custom 140 gene panel (Supplementary Data 1). A red bounding box defining the OFT is magnified and shown with cell clusters in the center. Cells in the OFT are colored according to Leiden clustering (clusters 1-13). b, c Plots showing the position of OFT cells from all samples in UMAP-space. Cells are colored according to Leiden clustering in b and according to genotype in c. d Heatmap plot showing scaled expression of Penk, Pdgfra, Sox9, and Postn in OFT cells from all samples. Cells are ordered according to their clustering. e Bar plot showing the proportion of all CNC-classified cells belonging to different genotypes and clusters (Ankrd11nchet: cluster 2, 518 cells; cluster 3, 306 cells; cluster 7, 152 cells. Ankrd11ncko: cluster 2, 475 cells; cluster 3, 632 cells; cluster 7, 249 cells). f Plots showing spatial positions of OFT cells colored according to normalized gene expression. Left column shows cells from representative Ankrd11nchet sample, right column shows cells from representative Ankrd11ncko sample. n = 3 Ankrd11nchet and n = 3 Ankrd11ncko samples from at least 2 independent litters. Source data are provided as a Source Data file.
Fig. 8
Fig. 8. Conditional loss of Ankrd11 in the neural crest causes dysregulated expression of a diverse set of genes at E11.5. Related to Supplemental Fig. 6.
a Dotplots showing statistically significantly differentially expressed genes (DEGs) between the Ankrd11nchet and Ankrd11ncko genotypes for each cluster. Dots are colored according to average log fold-change of expression from Ankrd11nchet genotype (negative change indicates expression is lower in Ankrd11ncko compared to Ankrd11nchet, and a positive change indicates higher expression). The dot radius corresponds to the percent of cells in each cluster that express (i.e., show the presence of at least one transcript) the gene of interest. Genes displayed are ordered according to absolute average log2 fold-change (highest at the top, lowest at the bottom). b Heatmap plot showing scaled expression of differentially expressed genes between the Ankrd11nchet and Ankrd11ncko genotypes for each cluster. Cells are ordered according to their clustering. Genes displayed are ordered according to absolute average log2 fold-change (highest at the top, lowest at the bottom). c Violin plots showing scaled expression of selected differentially expressed genes between the Ankrd11nchet and Ankrd11ncko for each cluster. Genes were selected by taking the 8 highest absolute average log2 fold-change values from each marker group. n = 3 Ankrd11nchet and n = 3 Ankrd11ncko samples from at least 2 independent litters. Source data are provided as a Source Data file.

References

    1. Wu W, He J, Shao X. Incidence and mortality trend of congenital heart disease at the global, regional, and national level, 1990-2017. Medicine (Baltim.) 2020;99:e20593. doi: 10.1097/MD.0000000000020593. - DOI - PMC - PubMed
    1. van der Linde D, et al. Birth prevalence of congenital heart disease worldwide: a systematic review and meta-analysis. J. Am. Coll. Cardiol. 2011;58:2241–2247. doi: 10.1016/j.jacc.2011.08.025. - DOI - PubMed
    1. Keyte A, Hutson MR. The neural crest in cardiac congenital anomalies. Differentiation. 2012;84:25–40. doi: 10.1016/j.diff.2012.04.005. - DOI - PMC - PubMed
    1. Neeb Z, Lajiness JD, Bolanis E, Conway SJ. Cardiac outflow tract anomalies. Wiley Interdiscip. Rev. Dev. Biol. 2013;2:499–530. doi: 10.1002/wdev.98. - DOI - PMC - PubMed
    1. Vega-Lopez GA, Cerrizuela S, Tribulo C, Aybar MJ. Neurocristopathies: new insights 150 years after the neural crest discovery. Dev. Biol. 2018;444:S110–S143. doi: 10.1016/j.ydbio.2018.05.013. - DOI - PubMed