. 2024 Jul 1;15(1):5534.
doi: 10.1038/s41467-024-49338-2.

Distinct genetic liability profiles define clinically relevant patient strata across common diseases

Collaborators, Affiliations

Distinct genetic liability profiles define clinically relevant patient strata across common diseases

Lucia Trastulla et al. Nat Commun. .

Abstract

Stratified medicine holds great promise to tailor treatment to the needs of individual patients. While genetics holds great potential to aid patient stratification, it remains a major challenge to operationalize complex genetic risk factor profiles to deconstruct clinical heterogeneity. Contemporary approaches to this problem rely on polygenic risk scores (PRS), which provide only limited clinical utility and lack a clear biological foundation. To overcome these limitations, we develop the CASTom-iGEx approach to stratify individuals based on the aggregated impact of their genetic risk factor profiles on tissue specific gene expression levels. The paradigmatic application of this approach to coronary artery disease or schizophrenia patient cohorts identified diverse strata or biotypes. These biotypes are characterized by distinct endophenotype profiles as well as clinical parameters and are fundamentally distinct from PRS based groupings. In stark contrast to the latter, the CASTom-iGEx strategy discovers biologically meaningful and clinically actionable patient subgroups, where complex genetic liabilities are not randomly distributed across individuals but rather converge onto distinct disease relevant biological processes. These results support the notion of different patient biotypes characterized by partially distinct pathomechanisms. Thus, the universally applicable approach presented here has the potential to constitute an important component of future personalized medicine paradigms.


Conflict of interest statement

F.I. receives funding from Open Targets, a public-private initiative involving academia and industry, and performs consultancy for the joint AstraZeneca-CRUK functional genomics center and for Mosaic Therapeutics. TFMA is a salaried employee of Boehringer Ingelheim Pharma outside the submitted work. The remaining authors declare no competing interests.

Figures
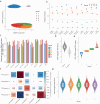
Fig. 1
Fig. 1. Stratification of CAD patients from imputed gene expression.
a First 2 components of uniform manifold approximation and projection (UMAP) from gene T-scores in liver for CAD patients. Genes are clumped at 0.9 correlation, separately standardized and PCs corrected, and multiplied by Z-statistic CAD associations. Each dot represents a patient colored by the cluster membership. b Prediction of clustering structure on 9 external CARDIoGRAM cohorts. Y-axis shows the fraction of cases assigned to each cluster in UKBB dataset and each external cohort for which the clustering structure was projected. The dashed lines indicate the fraction value for UKBB model clustering. c For each group, Spearman correlation of WMW estimates in UKBB and each external cohort only from genes that are significantly associated with that group across all tissues. d Distribution of CAD polygenic risk score (PRS) for all UKBB individuals based on CAD GWAS summary statistics from UKBB CAD GWAS. Cases: 19,023, controls: 321,916. The quartiles represent the 25th, 50th (median), and 75th percentiles. Upper whiskers extend to the maximum data value within 1.5 times the interquartile range (IQR) above the 75th percentile, while lower whiskers reach the minimum data value within 1.5 times the IQR below the 25th percentile. Violin plots encompass both the maximum and minimum values. e Distribution of CAD PRS for CAD affected individuals split into 4 groups based on PRS quantiles from lowest (1) to highest (4) PRS values. N. of samples in each group is respectively gr1 4756, gr2 4756, gr3 4755 and gr4 4756. Boxplots and violin plots show the same statistics as (d).f Enrichment between PRS quartiles and liver partitions. Each value indicates the fraction of (observed - expected)/expected individuals in the intersection between the groups as computed from the chi-squared statistic. Color and shape reflect the extent of enrichment. g Distribution of CAD PRS across CAD-affected individuals for groups defined by CASTom-iGEx clustering. N. of samples in each group is respectively gr1 6105, gr2 4783, gr3 2831, gr4 4520, gr5 784. Boxplots and violin plots show the same statistics as (d).
Fig. 2
Fig. 2. CASTom-iGEx based stratification outperforms PRS grouping.
a CAD relevant continuous endophenotypes from the UKBB with significant (FDR ≤ 0.1) patient group specific differences compared to all remaining CAD patients based on CASTom-iGEx groups depicting regression coefficient (βGLM) with 95% Confidence Interval (CI). Full dot indicates that βGLM is significant (0.1 threshold) after BH correction. Similar results for binary and ordinal categorical phenotypes are shown in Supplementary Fig.  9a. N. of samples in each group is are gr1 = 6105, gr2 = 4783, gr3 = 2831, gr4 = 4520, gr5 = 784. For each endophenotype tested, the number of samples per group varied and was lower than the entire CAD case population of 19,023 due to missing values, ranging from 16314 to 18919 total cases. b Similar to a. for PRS quantile-based CAD patient grouping (FDR ≤ 0.1). N. of samples in each group is are gr1 = 4756, gr2 = 4756, gr3 = 4755 and gr4 = 4756. Forest plot measures are defined as in (a). c Overlap of unique significantly CAD patient group associated endophenotypes for PRS quantile (blue) and CASTom-iGEx (red) based grouping. d For group-specific endophenotypes in liver clustering (FDR ≤ 0.1), comparison between the variance explained (R2) by liver partition (y-axis) and PRS quartiles partition as computed from the difference of R2 in the full linear model (pheno ~ group + cov) and the covariates only model (pheno ~ cov). e For all CAD related endophenotypes (n = 249, x-axis) log2 ratio of variance explained (R2) between the CASTom liver patient strata and PRS quartile patient strata (y-axis left). Each bar represents one endophenotype, color coding indicates significance of endophenotype-patient stratum association (n.s. – not significant, nom – nominally significant p-value ≤ 0.001, FDR – FDR ≤ 0.1). Lines show cumulated variance explained (y-axis left) across all endophenotypes for CASTom liver-based grouping (red) and PRS quartiles (blue). P-value indicates difference in cumulated variance based on Wilcoxon-test. f Number of unique genes across tissues cluster-relevant (FDR ≤ 0.01) divided per group, in CASTom-iGEx liver (left) and PRS quartiles (right) partitions. The total number across all groups of cluster-relevant genes is shown on top. g Same as f. but for cluster-relevant pathways (FDR ≤ 0.01).
Fig. 3
Fig. 3. Differences in genetic liabilities across distinct biological process across CAD patient groups.
a CAD associated pathways with higher significance than any of the included genes. Bars indicate PALAS Z-statistic (x-axis) with text signifying gene pathway coverage. The pathway name in bold reflects pathways without any significant gene (FDR > 0.05). b Pathways significantly (FDR ≤ 0.01) differentially active across CAD patient groups based on Wilcoxon-Mann-Whithney (WMW) analysis (test two-sided). Rows indicate the names of selected pathways and respective tissue is shown in parentheses. The left-side annotations show the corresponding CAD Z-statistics from PALAS 1. c Spearman correlation of WMW estimates of pathway scores between all significant group-specific pathways in UKBB (y-axis) and the corresponding pathways in each external cohort (CARDIoGRAM) (x-axis) for each group (color coding) across all tissues. d Odds ratio (median-unbiased estimation) with 95% CI of PALAS cluster pathways among PALAS CAD pathways (FDR ≤ 0.05). PALAS cluster pathways are detected from PALAS comparing non-affected individuals with CAD cases in each group from Liver. In each group, the number of pathways both in negative classes (PALAS cluster FDR > 0.05 and PALAS CAD FDR > 0.05) and both in positive classes (PALAS cluster FDR ≤ 0.05 and PALAS CAD FDR ≤ 0.05) are respectively gr1: negative 36140, positive 116; gr2: negative 33272, positive 231; gr3: negative 35962, positive 81; gr4: negative 33405, positive 166; gr5: negative 36165, positive: 49. e Comparison z-statistic for general CAD PALAS (PALAS 1, x-axis) and patient group specific PALAS (PALAS 2, y-axis) for each CASTom-iGEx defined group. Red dots indicate significant (FDR ≤ 0.05) associations in both PALAS, green significance only in PALAS 1 and turquoise significance only in PALAS 2. f Overlap of pathways significantly (FDR ≤ 0.05) associated with CAD (blue, PALAS 1), significantly associated with at least one CASTom-iGEx based patient group compared to all controls (green, PALAS 2), and those showing group specific activities when compared to all other CAD cases only (red, WMW group) out of 7978 tested pathways retained after pathway similarity pruning (JS < 0.2, see Methods).
Fig. 4
Fig. 4. Patient group-specific genetic liabilities are linked to the genetic basis of group-specific disease relevant endophenotypes.
a Frequency of pathway number (x-axis) significantly (FDR ≤ 0.1) associated with UKBB endophenotypes (n = 341). b Distribution of absolute Pearson correlation (y-axis) of significant (FDR ≤ 0.1) pathway-endophenotype and pathway-patient group association PALAS z-statistic for control endophenotypes (n = 317) and CAD patient group associated endophenotypes (n = 24). The quartiles illustrated in box plots represent the 25th, 50th (median), and 75th percentiles. The interquartile range (IQR) denotes the difference between the 75th and 25th percentiles. Upper whiskers extend to the maximum data value within 1.5 times the IQR above the 75th percentile, while lower whiskers reach the minimum data value within 1.5 times the IQR below the 25th percentile. Violin plots encompass both the maximum and minimum values. c Forest plot showing Pearson correlation (x-axis) between pathway z-statistic for CAD patient group specific PALAS and z-statistic for pathways associated with UKBB endophenotypes (y-axis) for each CASTom-iGEx defined group. Only endophenotypes significantly associated with at least one group (FDR ≤ 0.1) are considered. Blue bar indicates that the association is significant in both measured group-specific endophenotype and correlation from group PALAS and endophenotype PALAS z-statistics (both FDR ≤ 0.1).
Fig. 5
Fig. 5. Distinct CAD patient groups exhibit differences in clinical outcome parameters.
a Mean value of selected group-specific endophenotypes in each group rescaled to 0-100 range. b Mean pathway score value of selected group-specific pathways compared to healthy controls. The values are rescaled to 0-100 range and include the average scores for controls as reference. c Distribution of age of stroke for patients in UKBB. In c-e nominal p-values from group-wise GLM is shown at the top of the bar/violin plot. Boxplot elements include median as central line, 1st and 3rd quartiles as box limits, 1.5 interquartile ranges from 1st and 3rd quartiles as corresponding whiskers. N. of samples in each violin/boxplots are respectively:gr1 = 294, gr2 = 242, gr3 = 142, gr4 = 235, gr5 = 35. d Percentage of patients in UKBB clustering with comorbidity hyperlipidemia. e Percentage of patients in UKBB clustering with peripheral vascular disease. In (h-k). f CAD severity indicators across projected clusters in GerMIFSV cohort. Y-axis indicates the percentage of patients with a certain number of vessels affected (gray shades). X-axis indicates the projected group.
Fig. 6
Fig. 6. CASTOM-iGEx based identification of distinct patient subgroups in SCZ.
a Uniform manifold approximation and projection (UMAP) first 2 components of gene T-scores in DLPC standardized across n = 24,764 SCZ patients, corrected for PCs, and multiplied by Z-statistic SCZ associations. Each dot represents a patient in the transformed UMAP space colored by the cluster membership. b Wilcoxon-Mann-Whitney (WMW) estimates (test two-sided) for 296 group-specific pathways (FDR ≤ 0.05, Reactome and GO) including at least one gene in the MHC locus and considering only the most significant tissue per-pathways when repeated. The clustering is performed on SCZ patients in DLPC imputed gene expression, The row annotation on the left indicates the corresponding SCZ PALAS Z-statistics. The acronym in parenthesis in the pathway names refers to the tissue considered (DLPC = Dorsolateral Prefrontal Cortex in CMC, CEI = Cells EBV-transformed lymphocytes, BFBC = Brain Frontal Cortex BA9, BCeH = Brain Cerebellar Hemisphere, BCbg = Brain Caudate basal ganglia, BC = Brain Cortex, BCe = Brain Cerebellum, BHi = Brain Hippocampus, BHy = Brain Hypothalamus).
Fig. 7
Fig. 7. CASTom-iGEx defined SCZ patient groups differ with respect to cognitive parameters, risk for metabolic syndrome and disease severity.
a Forest plot for selected significantly different (FDR ≤ 0.05) endophenotype risk-scores across SCZ patient groups. X-axis shows the regression coefficient (dot) with 95% CI for the grouping variable (βGLM). The bars represent CI computed as [βGLM −1.96 * SE, βGLM + 1.96 * SE]. Full dot indicates that βGLM is significant after BH correction. Black dot indicates that the group-specific endophenotype association met the reliability threshold (CRM > 610, Methods). The top panel shows results for blood biochemistry, lower panels indicates other clinical and cognitive parameters. Endophenotypes are imputed here, the number of samples across them stays constant with gr1 = 9029, gr2 = 4418, gr3 = 8860 and gr4 = 520. b Rescaled mean values of selected SCZ patient group-specific pathways (Reactome and GO, WikiPathways and CMC Gene Set). c Group-specific spider plot related to Metabolic Syndrome phenotypes. Rescaled mean values of group-specific endophenotype-RS related to metabolic syndrome across all cohorts. Gray chart refers to all control combined in PGC cohorts. d Forest plot testing measured clinical differences across SCZ patients from the PsyCourse Study after individual patient projection onto PGC patient-based clusters. Forest plot as in a. with GLM testing for each pair of groups (label on top) and dots representing obtained odds ratio as exp(βGLM) being the endophenotypes binary / ordinal categorical. The bars represent CI computed as [exp(βGLM −1.96 * SE), exp(βGLM + 1.96 * SE)]. Full dot indicates significance at nominal level (p 0.05). tr. out/in – treatment outpatient/inpatient. Group sizes are gr1 = 75, gr2 = 237, gr3 = 244.

Update of

References

    1. Disease GBD, Injury I, Prevalence C. Global, regional, and national incidence, prevalence, and years lived with disability for 354 diseases and injuries for 195 countries and territories, 1990-2017: a systematic analysis for the Global Burden of Disease Study 2017. Lancet. 2018;392:1789–1858. doi: 10.1016/S0140-6736(18)32279-7. - DOI - PMC - PubMed
    1. Buchanan AV, Weiss KM, Fullerton SM. Dissecting complex disease: the quest for the Philosopher’s Stone? Int J. Epidemiol. 2006;35:562–571. doi: 10.1093/ije/dyl001. - DOI - PubMed
    1. Pang S, et al. Genetic and modifiable risk factors combine multiplicatively in common disease. Clin. Res. Cardiol. 2023;112:247–257. doi: 10.1007/s00392-022-02081-4. - DOI - PMC - PubMed
    1. McCarthy MI, et al. Genome-wide association studies for complex traits: consensus, uncertainty and challenges. Nat. Rev. Genet. 2008;9:356–369. doi: 10.1038/nrg2344. - DOI - PubMed
    1. Gallagher MD, Chen-Plotkin AS. The Post-GWAS Era: from association to function. Am. J. Hum. Genet. 2018;102:717–730. doi: 10.1016/j.ajhg.2018.04.002. - DOI - PMC - PubMed

Grants and funding