. 2024 Jun 29;15(1):5512.
doi: 10.1038/s41467-024-49709-9.

Low-intensity pulsed ultrasound stimulation (LIPUS) modulates microglial activation following intracortical microelectrode implantation

Affiliations

Low-intensity pulsed ultrasound stimulation (LIPUS) modulates microglial activation following intracortical microelectrode implantation

Fan Li et al. Nat Commun. .

Erratum in

Abstract

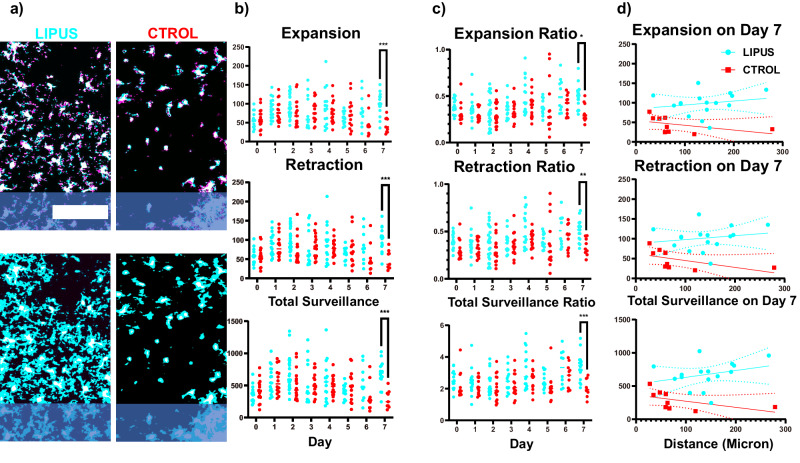
Microglia are important players in surveillance and repair of the brain. Implanting an electrode into the cortex activates microglia, produces an inflammatory cascade, triggers the foreign body response, and opens the blood-brain barrier. These changes can impede intracortical brain-computer interfaces performance. Using two-photon imaging of implanted microelectrodes, we test the hypothesis that low-intensity pulsed ultrasound stimulation can reduce microglia-mediated neuroinflammation following the implantation of microelectrodes. In the first week of treatment, we found that low-intensity pulsed ultrasound stimulation increased microglia migration speed by 128%, enhanced microglia expansion area by 109%, and a reduction in microglial activation by 17%, indicating improved tissue healing and surveillance. Microglial coverage of the microelectrode was reduced by 50% and astrocytic scarring by 36% resulting in an increase in recording performance at chronic time. The data indicate that low-intensity pulsed ultrasound stimulation helps reduce the foreign body response around chronic intracortical microelectrodes.


Conflict of interest statement

J.I. Broussard, N.N. Tirko, J. Greaser, K.W. Gheres, R. Bagwell, and M. Mulvihill have financial stakes in Actuated Medical. Actuated Medical has a patent pending on the hardware design and ultrasound stimulus technology. The inventors are Alanoud S. Alsubhi, Roger B. Bagwell, Jenna K. Greaser, Kevin A. Snook, Natasha A. Tirko, Ryan Clement, and Kyle Gheres. Application # is: 17/837,766. However, it is important to note that the competing interests did not affect the design, methodology, or interpretation of the results in any way. We declare this competing interest to maintain transparency and to provide readers with full disclosure. The remaining authors declare no competing interests.

Figures

Fig. 1
Fig. 1. Experimental apparatus for LIPUS treatment and two-photon imaging of microglia and vasculature following microelectrode implantation.
a To evaluate LIPUS stimulation power, a submersible hydrophone preamplifier was placed in degassed water (blue area) below the coverslip and PVA cone. The measurement of the spatial-peak temporal-average intensity (ISPTA) was conducted by setting the transducer’s voltage supply to 135 V. Axial and lateral ultrasound intensity plot from a representative trial (N = 1) used to characterize the transducer used for in vivo LIPUS experiments. Power was around 300 mW/cm2 at the center of the plane, 1 mm below the cover glass. Imaging planes covered a depth range from 0 to 0.3 mm below the cover glass. Attenuation of ultrasound power was assessed in both the XY plane (Top right figure) and the YZ plane (bottom right figure). Degree of attenuation was quantified by comparing the power at the various locations to the power at the center of the XY plane, specifically at the putative brain surface beneath the coverslip. b Representative trial (N = 1) of LIPUS induced tissue heating at two transducer operating intensities used for quantification of thermal effect from LIPUS stimulation. LIPUS was produced at 135 V (red) and 201 V (blue), a total of 15 min of LIPUS exposure, divided into three intervals of 5 min each, with 5 min of non-exposure between each sonication (red and blue periods). Driving the transducer at 135 V kept changes in brain temperature below 1 °C tested at 1.5 mm below the cortical surface. This driving voltage was used for subsequent experiments. c Illustration presents a timeline depicting the sequence of surgery, stimulation, and two-photon imaging. d Schematic representation of microelectrode implantation, sealing of craniotomy window, and LIPUS stimulation. Adapted from. e A representative two-photon image of a Cx3CR1-GFP transgenic mouse following an I.P. injection of sulforhodamine 101 (SR101) showing microglia cells in green and cerebral blood vessels in magenta. Shaded blue region indicates the location of the implanted microelectrode. Scale bar = 100 µm.
Fig. 2
Fig. 2. LIPUS increased the velocity of migrating microglia on day 1 and day 3.
a Microglia migration was characterized by aligning images from an earlier time point (magenta) and the listed time point (green). White indicates no cell movements. After microelectrode implantation, microglia migrated toward the microelectrode (shaded blue) as indicated by green cells being closer to the probe compared to magenta cells. b The velocity of migrating microglia was quantified. LIPUS treatment significantly increased the velocity of migrating microglia on day 1 and day 3 but significantly decreased on days 4, 5, 6 (two-sided Šídák’s multiple comparisons test, *p = 0.0360, ****p < 0.0001). c–f spatial characterization of migrating microglia velocity on days 1, 3, 5, and 6. Each microglia was fitted to a linear regression model to examine the relationship between microglia migration velocity and the distance from the microelectrode (solid line represents best fit, and dotted lines represent 95% confidence interval bands). Significant difference was detected in the intercepts from the linear regression model (p < 0.001) on day 1. LIPUS N = 7, n = 40; Control N = 5, n = 29 (see Supplementary Table 1). Scale bar = 100 µm.
Fig. 3
Fig. 3. LIPUS attenuated microglial activation on day 6.
a Left: Logistic regression analysis of microglia ramification over distances for the LIPUS (blue) and Control (red) groups. Y-axis represents the predicted percentage of ramified microglia using the logistic regression model. Dotted lines represent the 95% confidence bands. Right: Receiver Operating Characteristic (ROC) curve for each logistic regression model used in left panels. The proximity to the black dashed line indicates the model’s performance. Closer distance between the ROC curve and the random classifier line (black dashed line) indicates less suitability for fitting ramification data with a logistic regression model. Based on the ROC curves, the microglia ramification data was unsuitable for fitting into the logistic regression model on day 6 in the LIPUS group and on day 7 in the control group. b T-index calculation, which assesses the degree of activation based on the length of the most prominent leading versus lagging microglia process relative to the electrode. Error bars indicate the standard errors. c D-index calculation, which measures the degree of activation based on the number of leading versus lagging microglia processes relative to the electrode. Across spatial bins, the T-index and D-index generally decreased with time until day 3, indicating a higher degree of microglia activation. Starting from day 5, both indices began to increase. Notably, LIPUS treatment significantly increased both the T-index and D-index on day 6 (two-sided Šídák’s multiple comparisons test, *p < 0.01, ***p < 0.001), providing clear evidence of attenuated microglial morphological activation. LIPUS N = 5, n = 29; Control N = 4, n = 29 (see Supplementary Table 2). Error bars indicate SEM.
Fig. 4
Fig. 4. LIPUS increased the surveillance area expansion/retraction and total surveillance area of microglia on day 7.
a Top two rows: Examples of two-photon processed images showing microglia expansion (cyan), retraction (magenta), stable part (white) over a 1-min interval. Bottom two rows: Examples of two-photon processed images displaying the total surveillance area (cyan) and stable part (white) of microglia over a 10-min period. b Quantification of expansion, retraction, and total surveillance area. LIPUS treatment significantly increased the expansion, retraction, and total surveillance area on day 7 (two-sided Šídák’s multiple comparisons test, *** p < 0.001). c The expansion, retraction, and surveillance normalized by the stable part of microglia. LIPUS treatment significantly increased the expansion ratio, retraction ratio, and total surveillance ratio on day 7 (two-sided Šídák’s multiple comparisons test, *p = 0.01, **p = 0.004, ***p < 0.001). d Spatial characterization of microglia expansion/retraction and surveillance on day 7 (solid line represents best fit and dotted lines represent 95% confidence interval bands). LIPUS N = 4, n = 16; Control N = 2, n = 9 (see Supplementary Table 3). Scale bar = 100 µm.
Fig. 5
Fig. 5. LIPUS attenuated microglial encapsulation of intracortical microelectrode starting day 6.
a Representative two-photon images on day 14 revealed that microglia extensively covered the probe in the control group, whereas in the LIPUS group, microglia displayed distinct processes with reduced overlap. b The percentage of microglial surface coverage was quantified up to 20 µm above the surface of the implant (yellow outline in a), comparing LIPUS and control groups. LIPUS treatment resulted in a lower level of probe coverage, which occurred around day 6, and remained consistently lower than that in the control group (two-sided Šídák’s multiple comparisons test, *p = 0.01865, ***p < 0.001, ****p < 0.0001). LIPUS N = 7; Control N = 6 (see Supplementary Table 4). Error bars indicate SEM. Scale bar = 50 µm.
Fig. 6
Fig. 6. LIPUS reduced the number of vessel-associated microglia on day 7.
To identify vessel-associated microglia, a 22-mm Z stack was analyzed to identify microglial processes that exhibited at least one attachment to the blood vessel. a Representative two-photon images showing microglia (green) and vasculature (magenta) from day 0 to day 7. b Total microglia density (including non-vessel-associated and vessel-associated microglia) initially decreased up to day 3 and then returned to the same level as day 0 in both LIPUS and control groups. c Vessel-associated microglia density also exhibited a similar trend, decreasing up to day 3 and then returning to the baseline level. d Vessel-associated ratio was calculated by dividing the number of vessel-associated microglia by the total number of microglia. LIPUS treatment appeared to increase the vessel-associated microglia ratio on day 2 and significantly decrease it on day 7 (two-sided Šídák’s multiple comparisons test, p = 0.0002). e To account for individual variability, the ratio change was calculated by subtracting the vessel-associated ratio on each day from the vessel-associated ratio on day 0 for each animal. LIPUS treatment significantly reduced the vessel-associated microglia ratio on day 7 (two-sided Šídák’s multiple comparisons test, p < 0.0001). LIPUS N = 6; Control N = 6 (see Supplementary Table 5). Scale bar = 100 µm.
Fig. 7
Fig. 7. LIPUS reduces the diameter of cerebral blood vessels on day 28.
a Left images: two-photon microscopy images of LIPUS and control group on day 0 and day 28. White boxes denote the analyzed vasculatures. The probe is outlined in blue at the bottom of the images. Scale bar = 100 µm. Right images: magnification of blood vessels on day 28 in both groups. Scale bar = 20 µm. b Average blood vessel diameter over 28 days. LIPUS treatment significantly decreases the average vessel diameter on day 28 (one-sided Tukey’s multiple comparison test, *p = 0.02). c Average vessel diameter before and after stimulation on day 0. Significant reduction in average blood vessel diameter in the LIPUS group was observed only after stimulation compared to the control group (one-sided Welch’s t-test, *p = 0.0151). d No significant difference between groups was detected in vessel area coverage percentage. e Tortuosity measures the level of twisting or distortion of the vessels. No significant difference between groups was detected in tortuosity. f Maximum blood vessel branch length showed no significant difference between groups. g A higher average branch length was observed in the LIPUS group compared to a control group from day 2 to day 7 and day 28, however, no significant difference was detected. h No significant difference between groups was detected in number of blood vessel branches per vessel. LIPUS N = 3, n = 7; Control N = 4, n = 5 (see Supplementary Table 6). Error bars indicate the SEM.
Fig. 8
Fig. 8. LIPUS improves neuronal single-unit activity and decreases astrocytic scar formation around the probe.
a Single-unit yield over time. b Number of active channels over time. c Single-unit SNR. d Single-unit amplitude. e Noise floor. f Average impedance. * Indicates significant group-wise differences via a linear mixed model likelihood ratio test with a 95% confidence interval (two-sided, p < 0.05). g Left image: Representative histological stain for GFAP around a microelectrode probe hole in LIPUS-treated and control animals; Middle: GFAP intensity is increased in the control group compared to the LIPUS-treated group 30 µm away from the probe; Right: violin plot quantifies GFAP within the first 50 µm away from the shank (two-sided Sidak’s multiple comparisons, ^p < 0.0001, *p = 0.0371; Welch’s t-test ****p < 0.0001). h Left image: Representative histological stain for BDNF around a microelectrode probe hole in LIPUS-treated and control animals; Middle: BDNF staining showed no difference between the LIPUS and Control groups; Right: violin plot quantifies BDNF within 50 µm away from the shank. i Representative histological stain for DAPI, BDFN, and GFAP. af: LIPUS N = 4; Control N = 4. g, h: LIPUS N = 3, n = 10; Control N = 3, n = 9 (see Supplementary Table 7). Scale bar = 100 µm. Error bars indicate the SEM.

Update of

References

    1. Medzhitov, R. Origin and physiological roles of inflammation. Nature454, 428–435 (2008). 10.1038/nature07201 - DOI - PubMed
    1. Freire, M. O. & Van Dyke, T. E. Natural resolution of inflammation. Periodontology 200063, 149–164 (2013). 10.1111/prd.12034 - DOI - PMC - PubMed
    1. Grammas, P. Neurovascular dysfunction, inflammation and endothelial activation: implications for the pathogenesis of Alzheimer’s disease. J. Neuroinflamm.8, 1–12 (2011).10.1186/1742-2094-8-26 - DOI - PMC - PubMed
    1. Tarantini, S., Tran, C. H. T., Gordon, G. R., Ungvari, Z. & Csiszar, A. Impaired neurovascular coupling in aging and Alzheimer’s disease: contribution of astrocyte dysfunction and endothelial impairment to cognitive decline. Exp. Gerontol.94, 52–58 (2017). 10.1016/j.exger.2016.11.004 - DOI - PMC - PubMed
    1. Petty, M. A. & Lo, E. H. Junctional complexes of the blood–brain barrier: permeability changes in neuroinflammation. Prog. Neurobiol.68, 311–323 (2002). 10.1016/S0301-0082(02)00128-4 - DOI - PubMed

LinkOut - more resources